
15 Q
11th
9 Q
11th

23 Q
11th
11 Q
9th - 12th
10 Q
9th - 12th
9 Q
9th - 12th
11 Q
11th
12 Q
9th - 12th
15 Q
9th - 12th
16 Q
5th - Uni
20 Q
7th - Uni
14 Q
9th - 12th
20 Q
7th - Uni
20 Q
9th - Uni
18 Q
9th - 12th
15 Q
9th - 12th
10 Q
9th - 12th
15 Q
11th - 12th
25 Q
9th - 12th
11 Q
9th - 12th
12 Q
8th - Uni
20 Q
9th - 12th
28 Q
9th - 12th
20 Q
9th - Uni
Explore Data Visualization Worksheets by Grades
Explore Other Subject Worksheets for grade 11
Explore printable Data Visualization worksheets for Grade 11
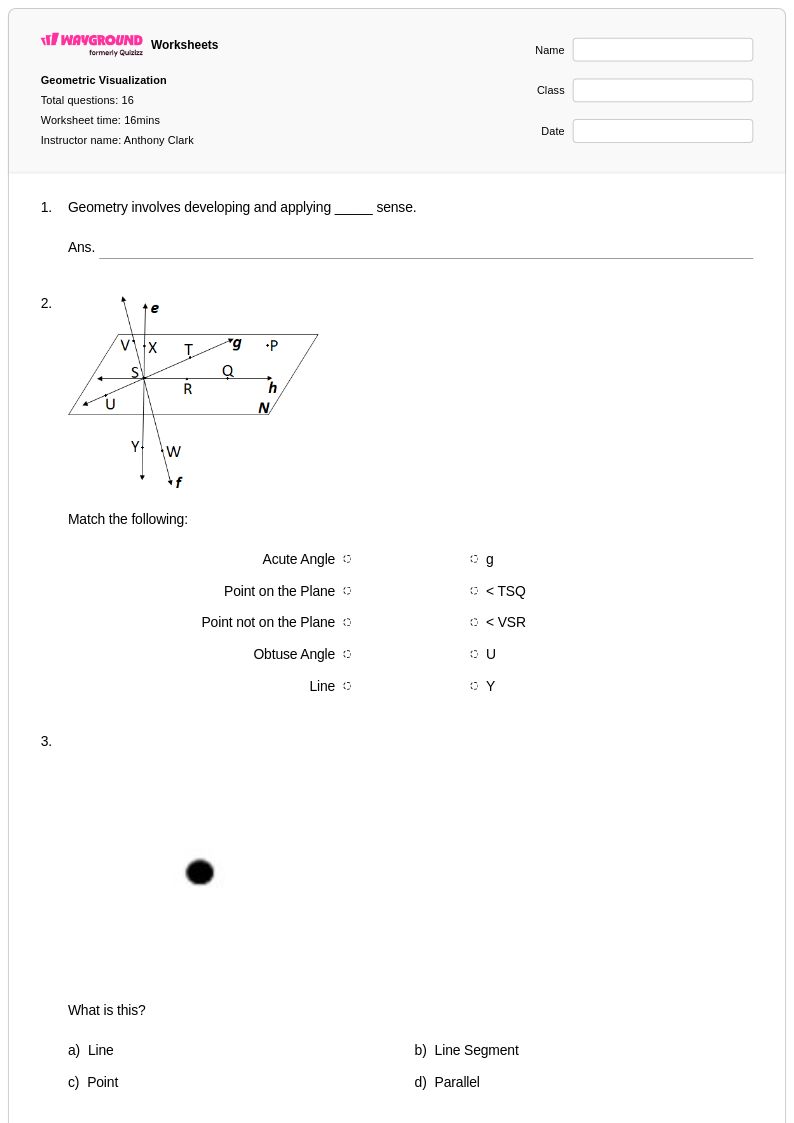
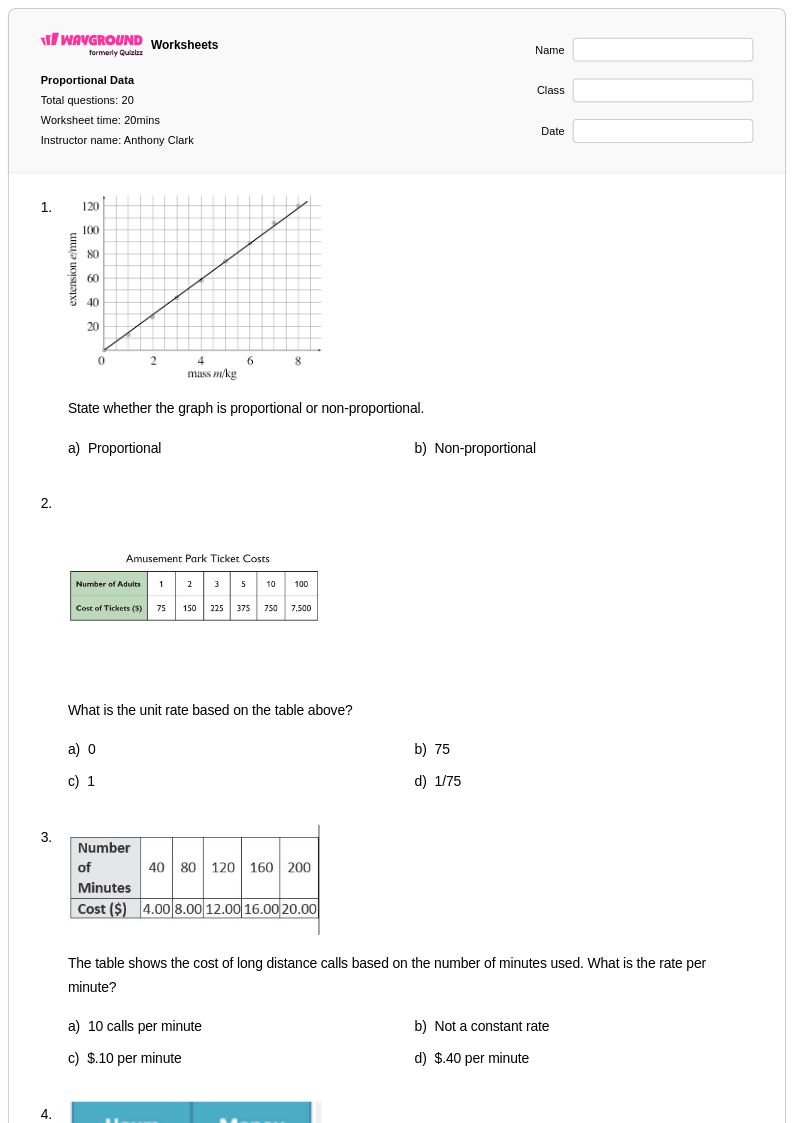
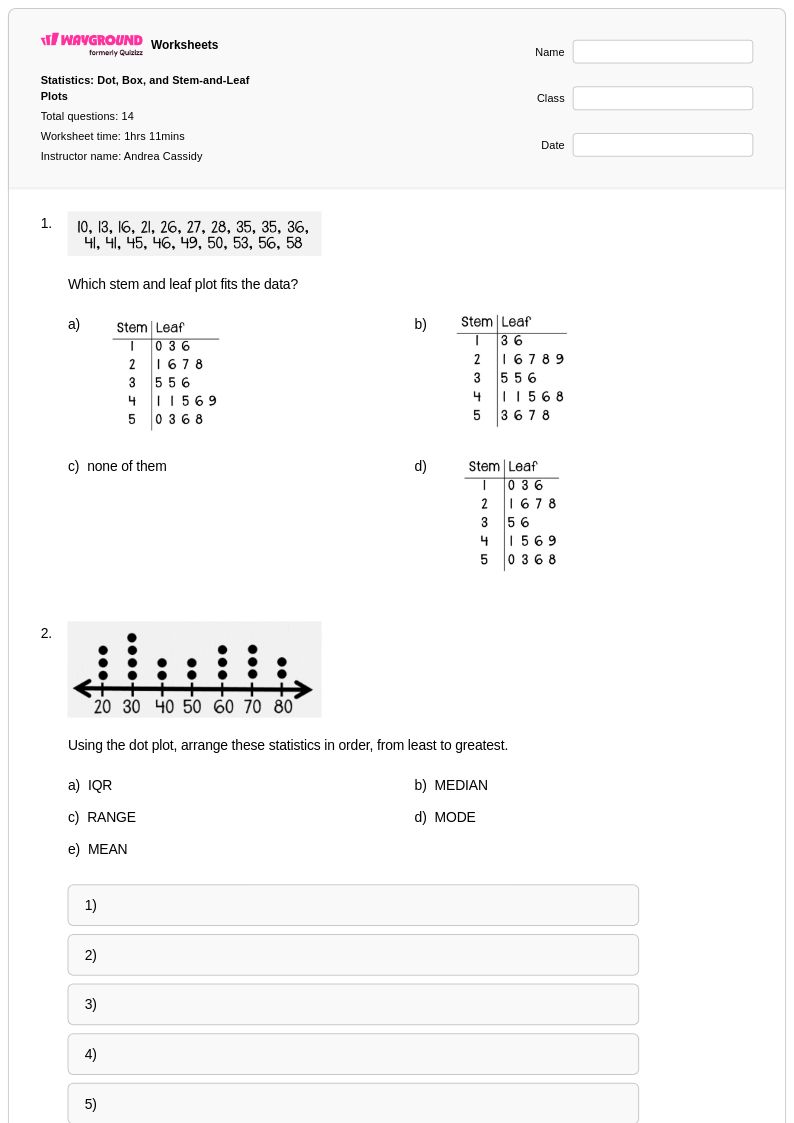
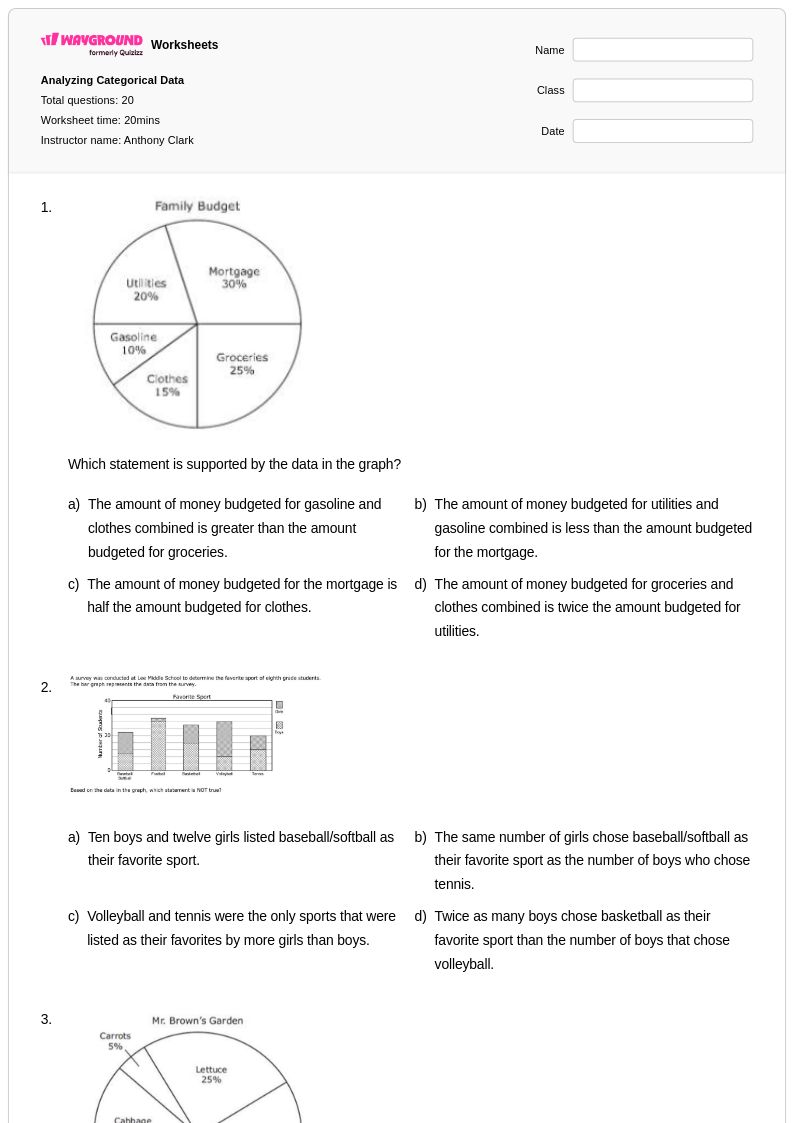
Data visualization worksheets for Grade 11 mathematics provide students with essential practice in creating, interpreting, and analyzing graphical representations of statistical data. These comprehensive resources available through Wayground (formerly Quizizz) focus on developing critical skills in constructing histograms, box plots, scatter plots, and other visual displays that reveal patterns, trends, and relationships within datasets. Students work through practice problems that emphasize proper scaling, axis labeling, and graph selection based on data type and analytical purpose. Each worksheet includes detailed answer keys that guide students through the reasoning process, helping them understand not just how to create visualizations but why specific formats are most appropriate for different statistical scenarios. These free printable resources strengthen students' ability to communicate mathematical findings effectively through visual means, a fundamental skill in advanced statistics and real-world data analysis.
Wayground (formerly Quizizz) supports mathematics educators with millions of teacher-created data visualization worksheets specifically designed for Grade 11 probability and statistics instruction. The platform's robust search and filtering capabilities allow teachers to quickly locate resources that align with curriculum standards and match their students' specific learning needs. Teachers can customize existing worksheets or create new ones using the platform's flexible tools, enabling differentiation for various skill levels within the same classroom. These resources are available in both printable pdf format for traditional classroom use and digital formats for interactive learning experiences. The extensive collection supports comprehensive lesson planning by providing materials suitable for initial concept introduction, skill practice, remediation for struggling students, and enrichment activities for advanced learners, ensuring that all students develop proficiency in translating numerical data into meaningful visual representations.