
11 Q
9th - 12th
10 Q
9th - 12th
9 Q
9th - 12th
12 Q
9th - 12th
25 Q
10th
15 Q
9th - 12th
16 Q
5th - Uni
20 Q
7th - Uni
14 Q
9th - 12th
11 Q
10th
20 Q
7th - Uni
20 Q
9th - Uni
18 Q
9th - 12th
15 Q
9th - 12th
15 Q
6th - Uni
20 Q
6th - Uni
10 Q
9th - 12th
15 Q
9th - 10th
25 Q
9th - 12th
11 Q
9th - 12th
12 Q
8th - Uni
20 Q
9th - 12th
28 Q
9th - 12th
40 Q
10th
Explore Data Visualization Worksheets by Grades
Explore Other Subject Worksheets for grade 10
Explore printable Data Visualization worksheets for Grade 10
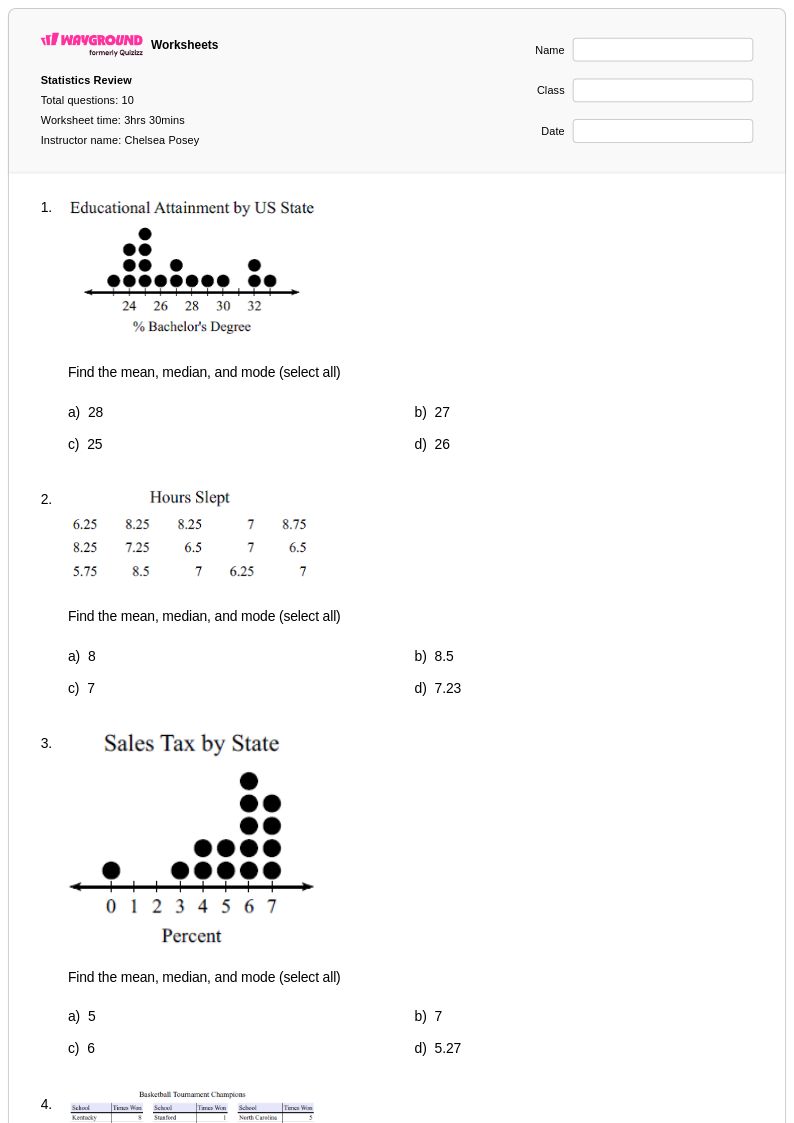
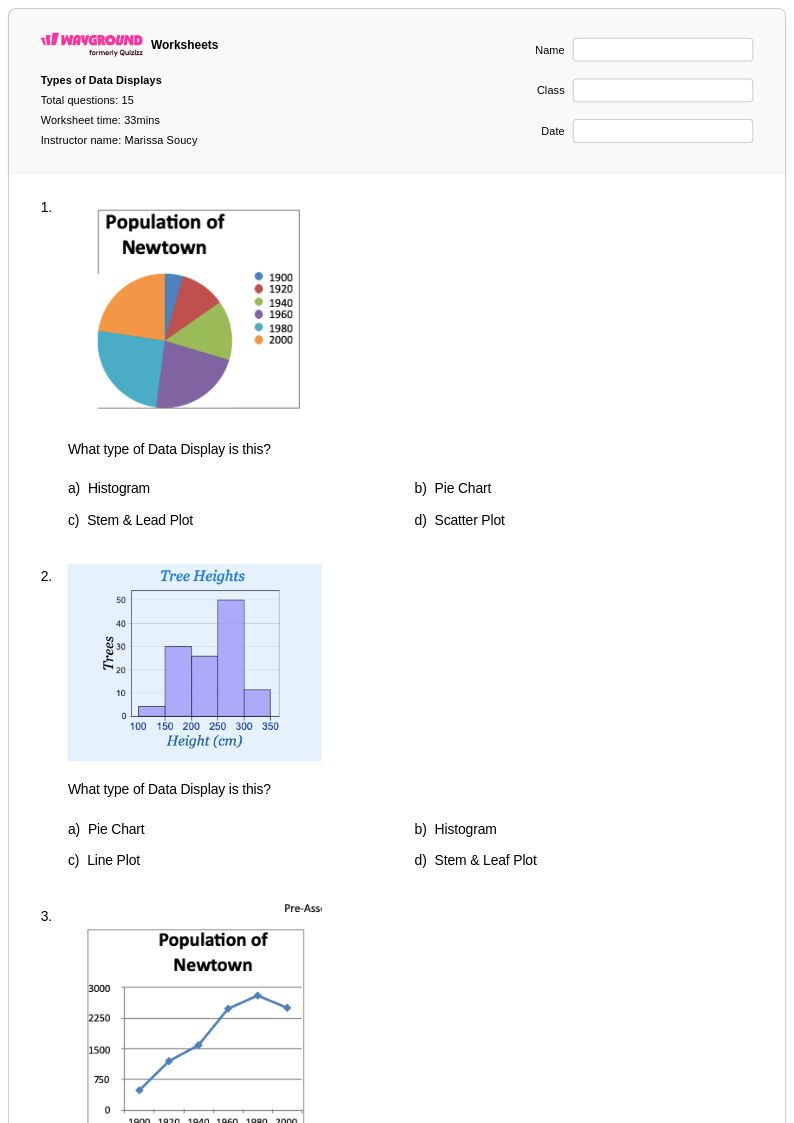
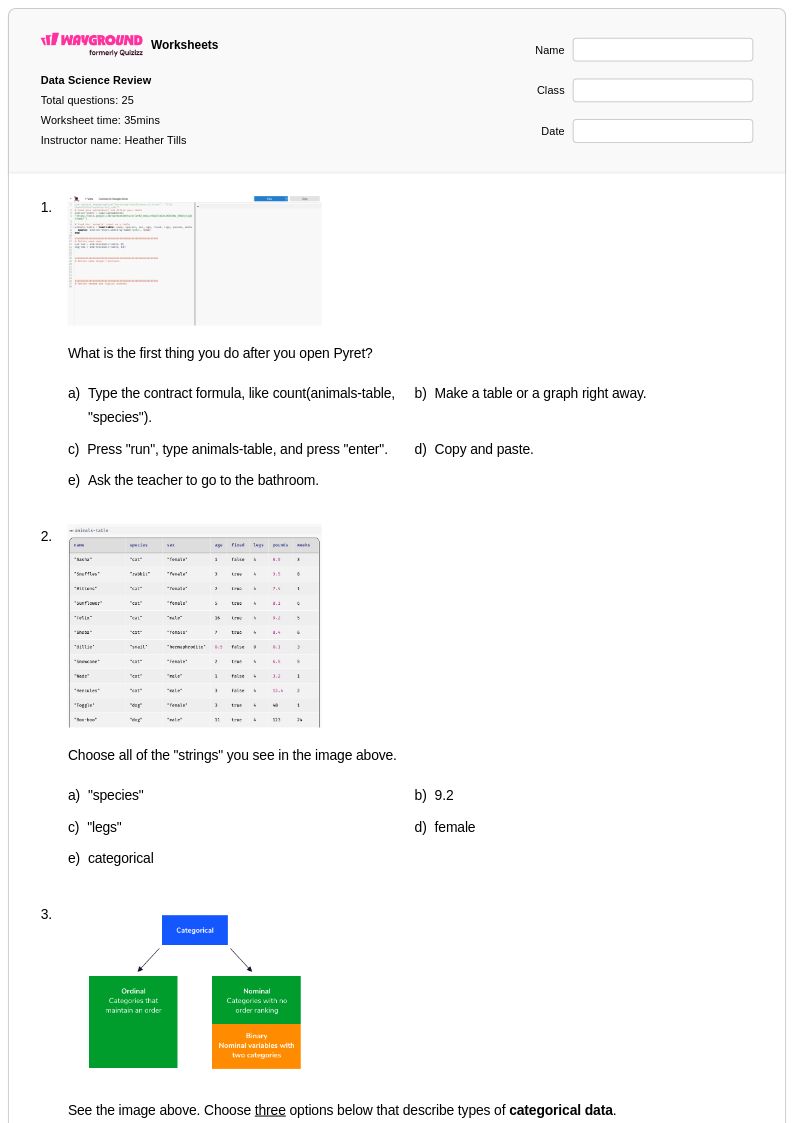
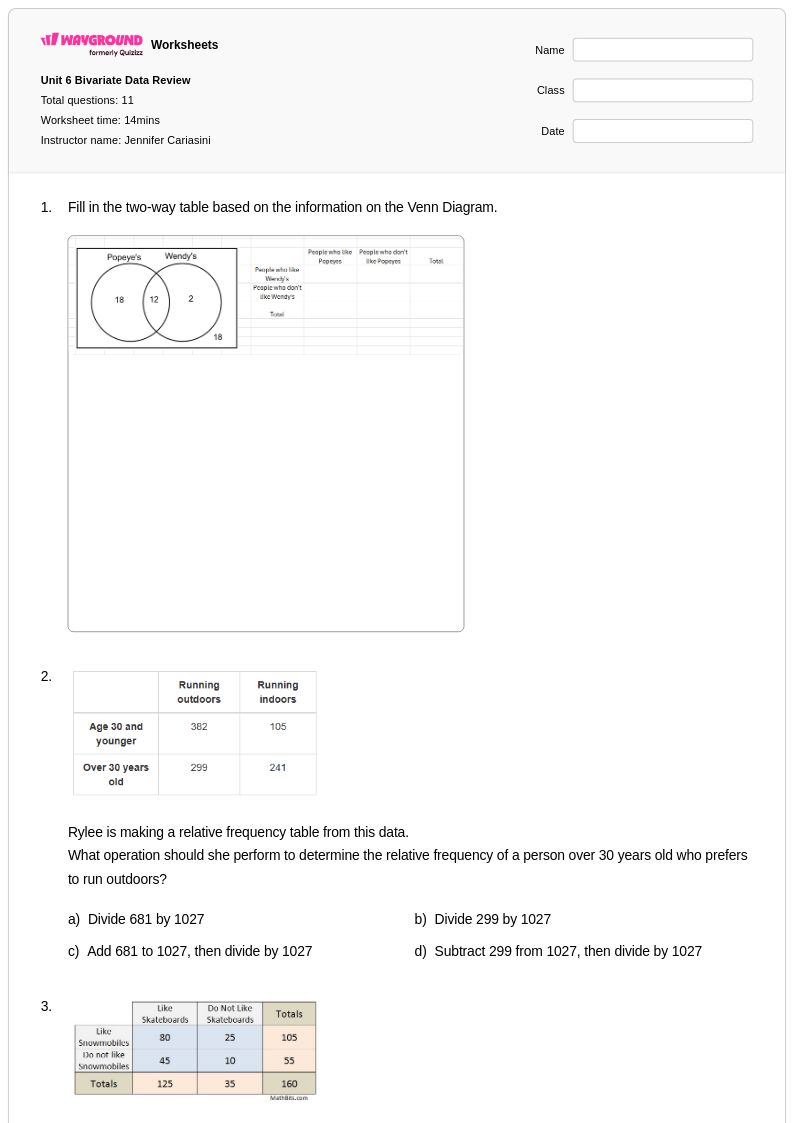
Data visualization worksheets for Grade 10 students available through Wayground (formerly Quizizz) provide comprehensive practice in interpreting, creating, and analyzing various graphical representations of statistical data. These expertly designed resources strengthen students' abilities to construct and evaluate histograms, box plots, scatter plots, bar charts, and other essential visual displays while developing critical thinking skills around data interpretation and statistical reasoning. The collection includes practice problems that guide students through real-world scenarios requiring them to select appropriate visualization methods, identify trends and patterns, and draw meaningful conclusions from graphical data presentations. Teachers can access complete answer keys and free printable pdf versions that support both independent study and collaborative learning environments.
Wayground's extensive library features millions of teacher-created data visualization resources specifically aligned with Grade 10 mathematics standards, offering educators powerful search and filtering capabilities to locate materials that match their exact curriculum needs. The platform's differentiation tools allow teachers to customize worksheet difficulty levels and modify content to accommodate diverse learning styles, while flexible formatting options provide both printable pdf downloads and interactive digital versions for seamless classroom integration. These comprehensive collections support effective lesson planning by offering varied practice opportunities for skill reinforcement, targeted remediation for struggling learners, and enrichment activities for advanced students, ensuring that all Grade 10 students can master essential data visualization concepts through structured, progressive practice.