
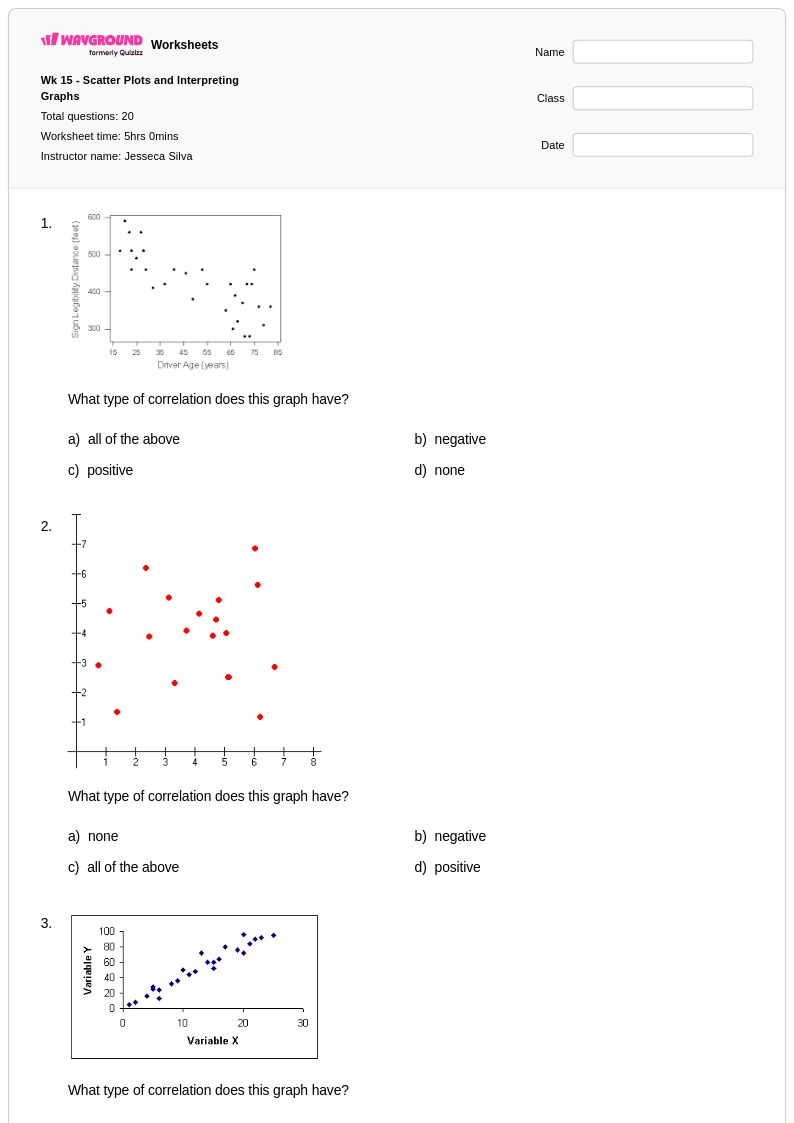
20Q
8th
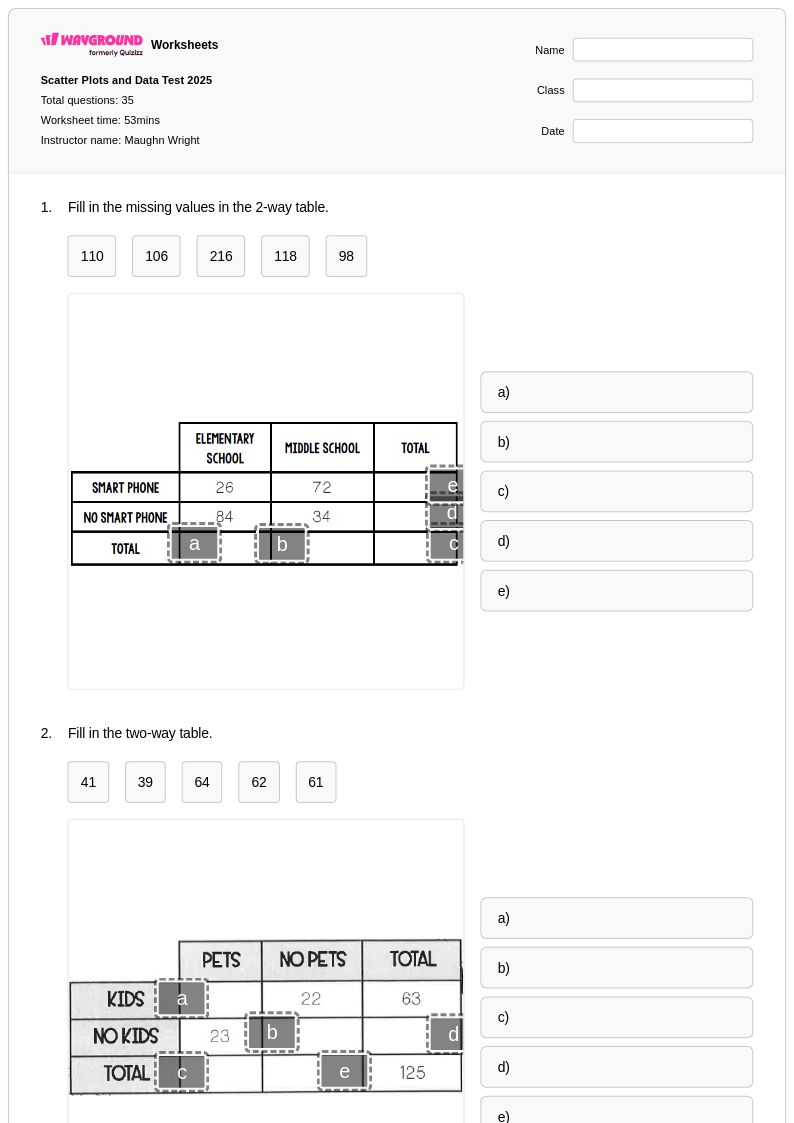
35Q
8th
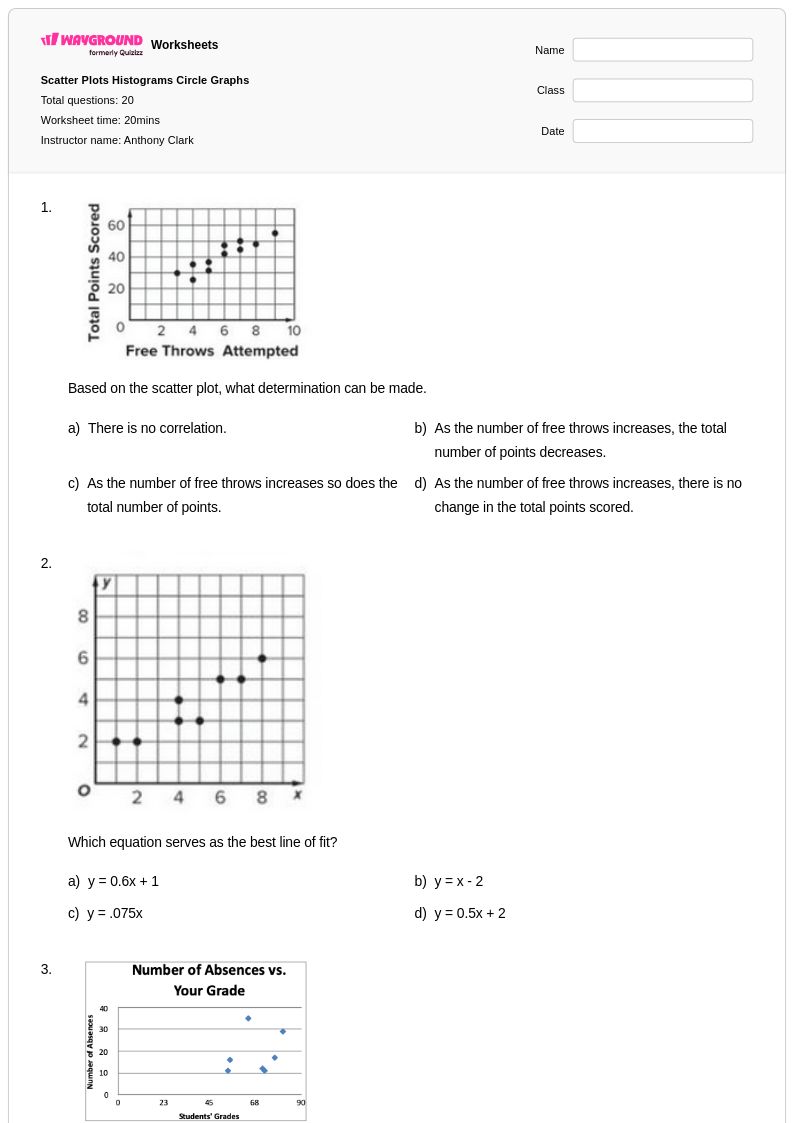
20Q
7th - Uni
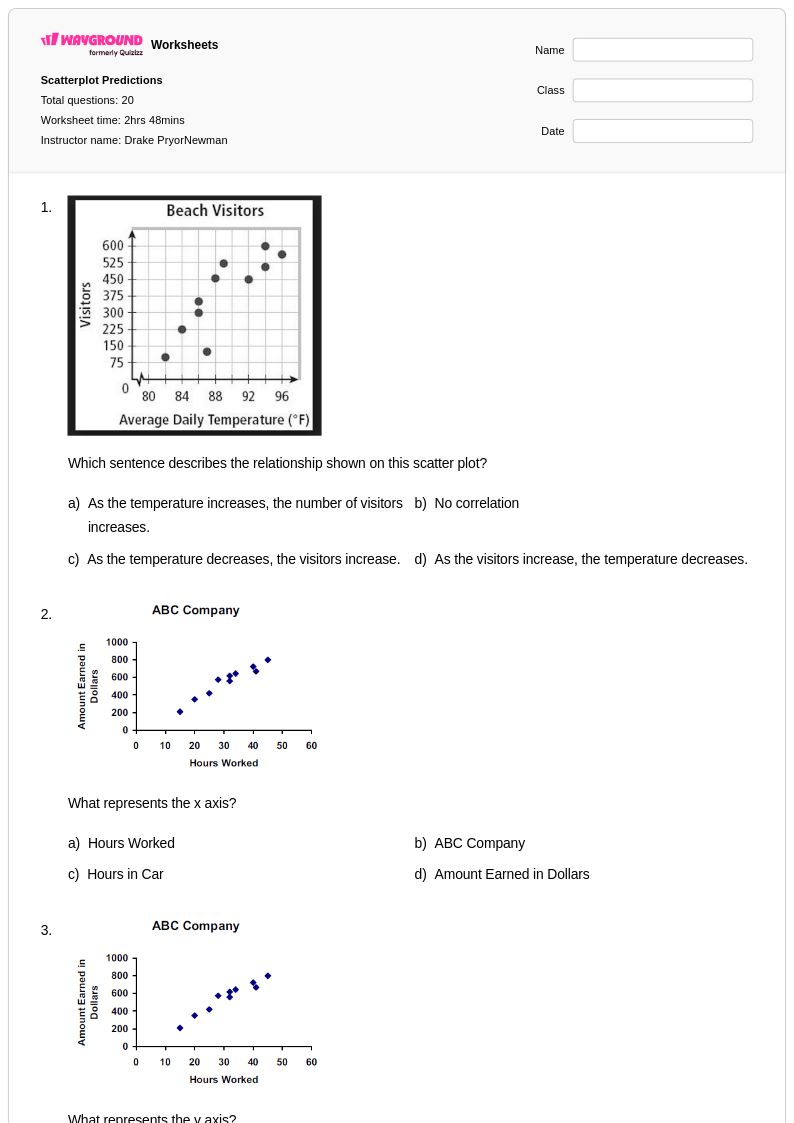
20Q
8th
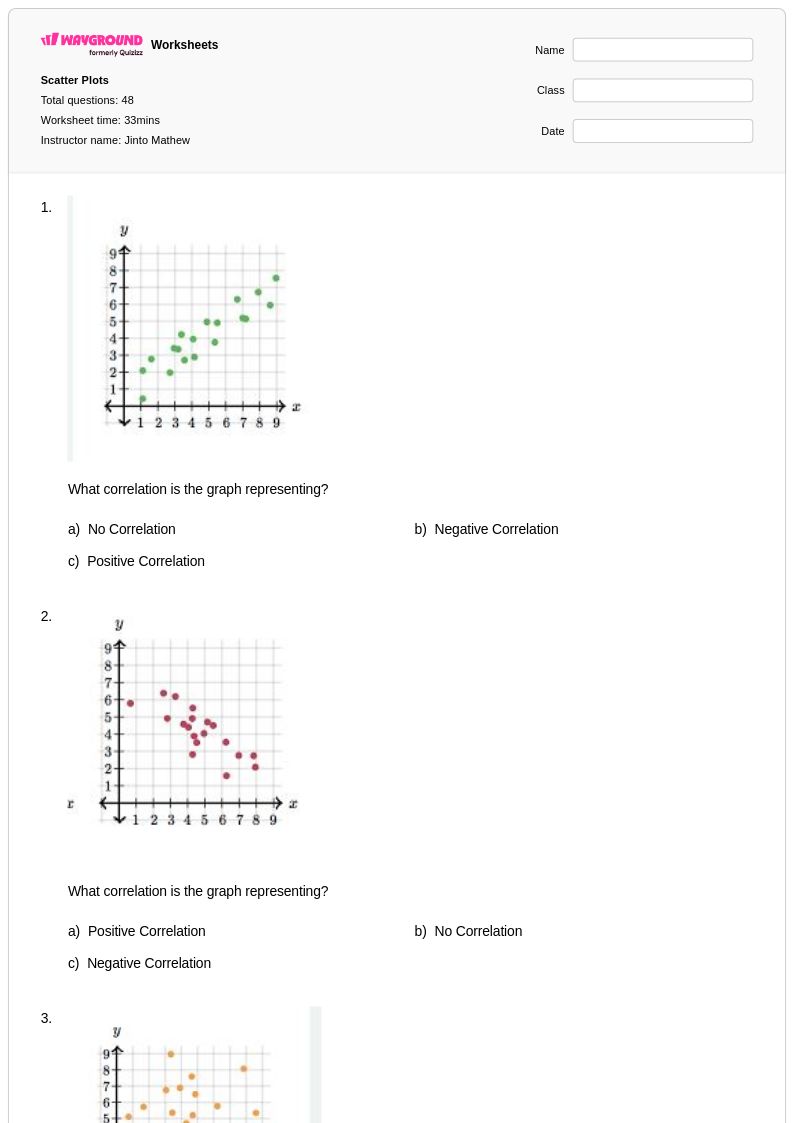
48Q
8th
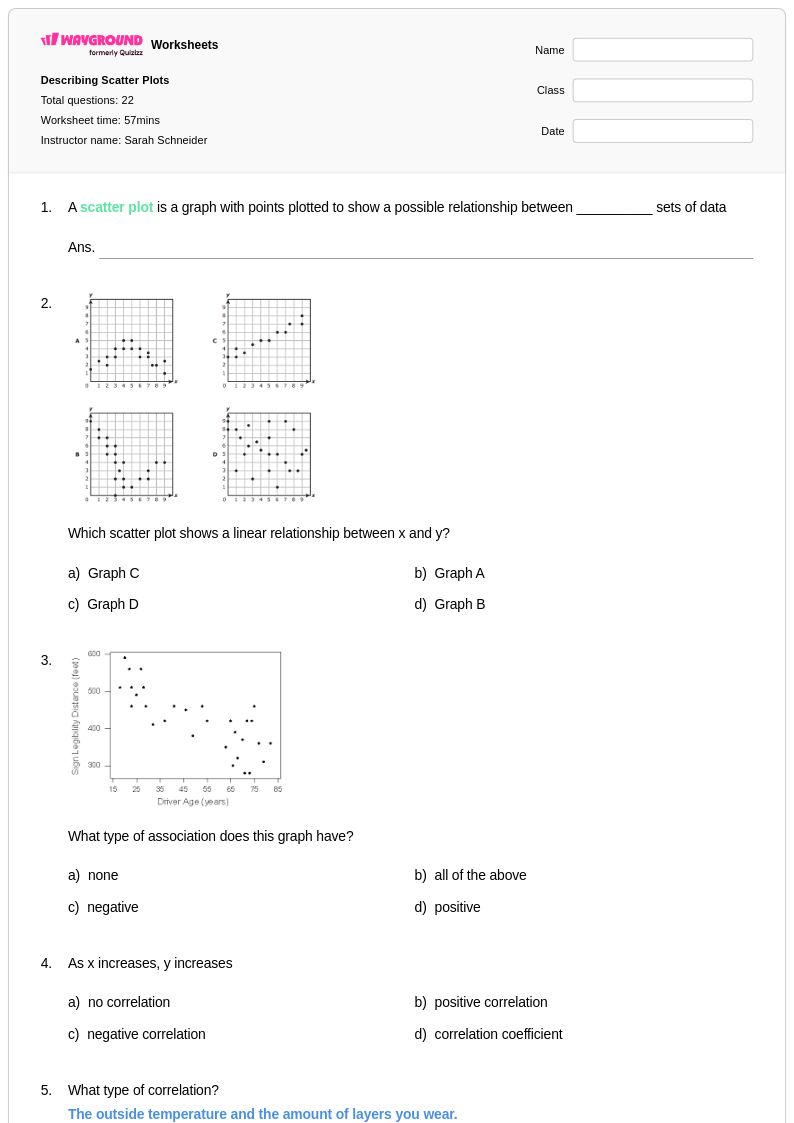
22Q
8th
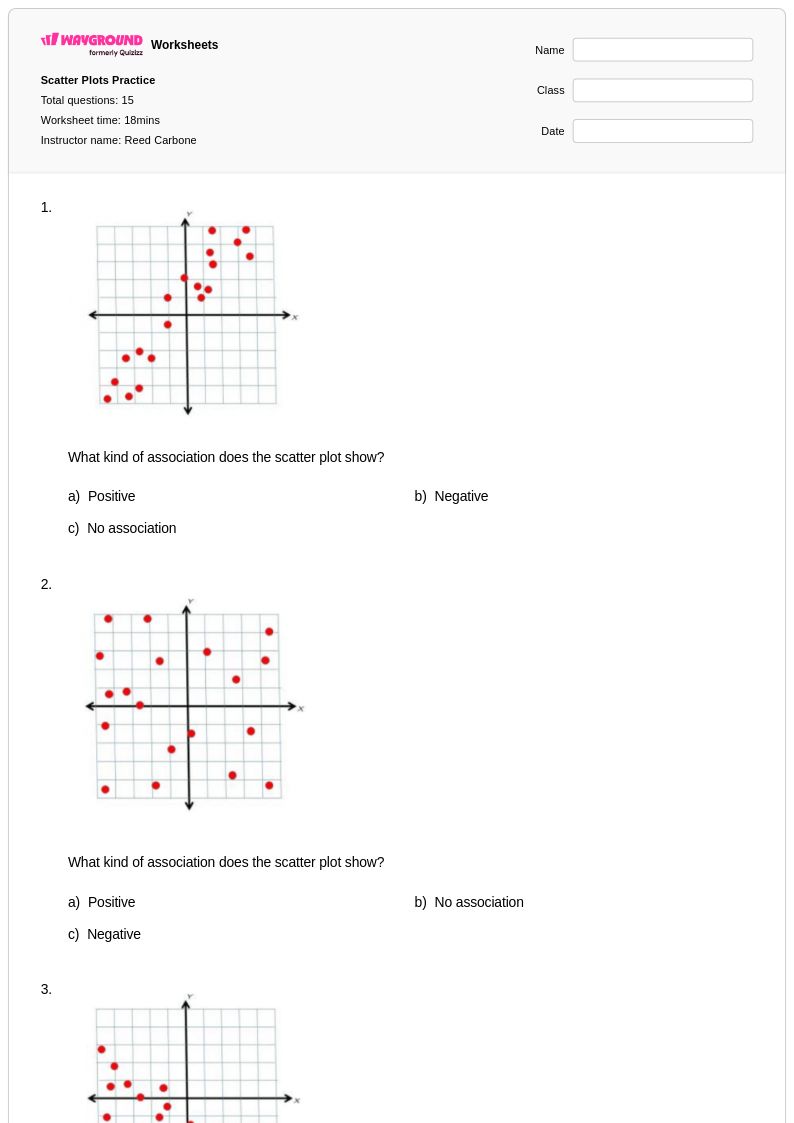
15Q
8th
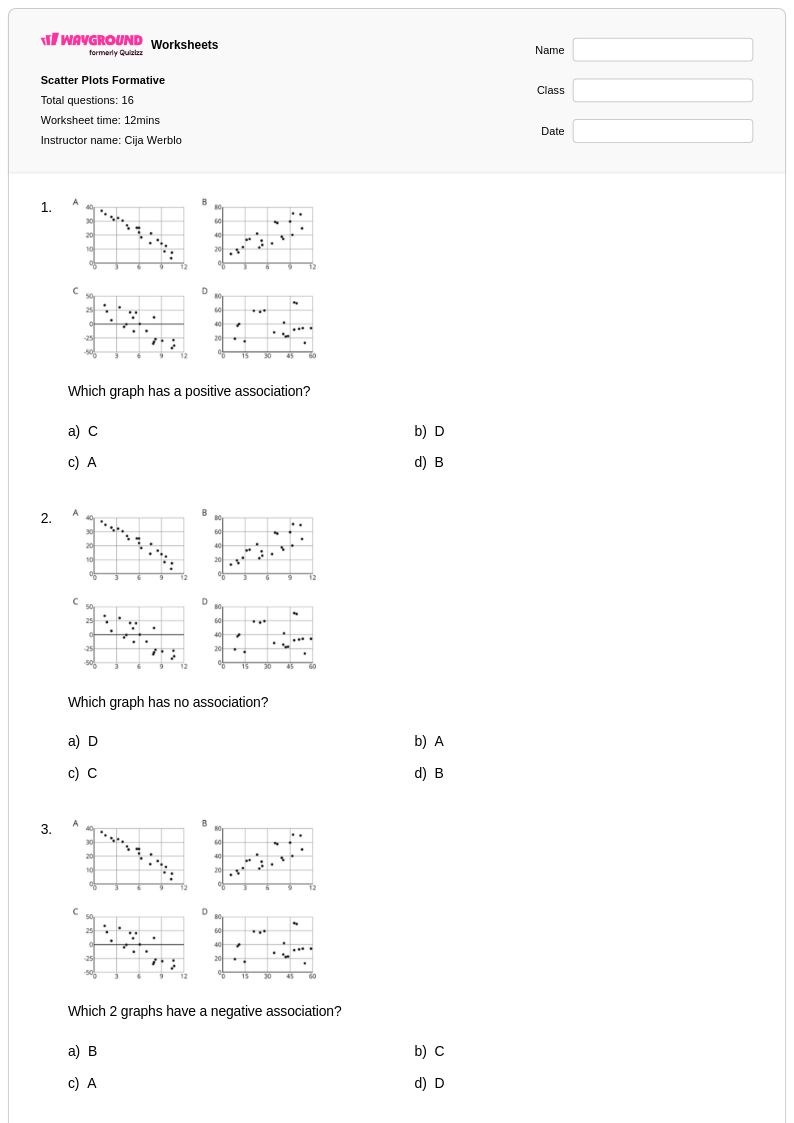
16Q
8th
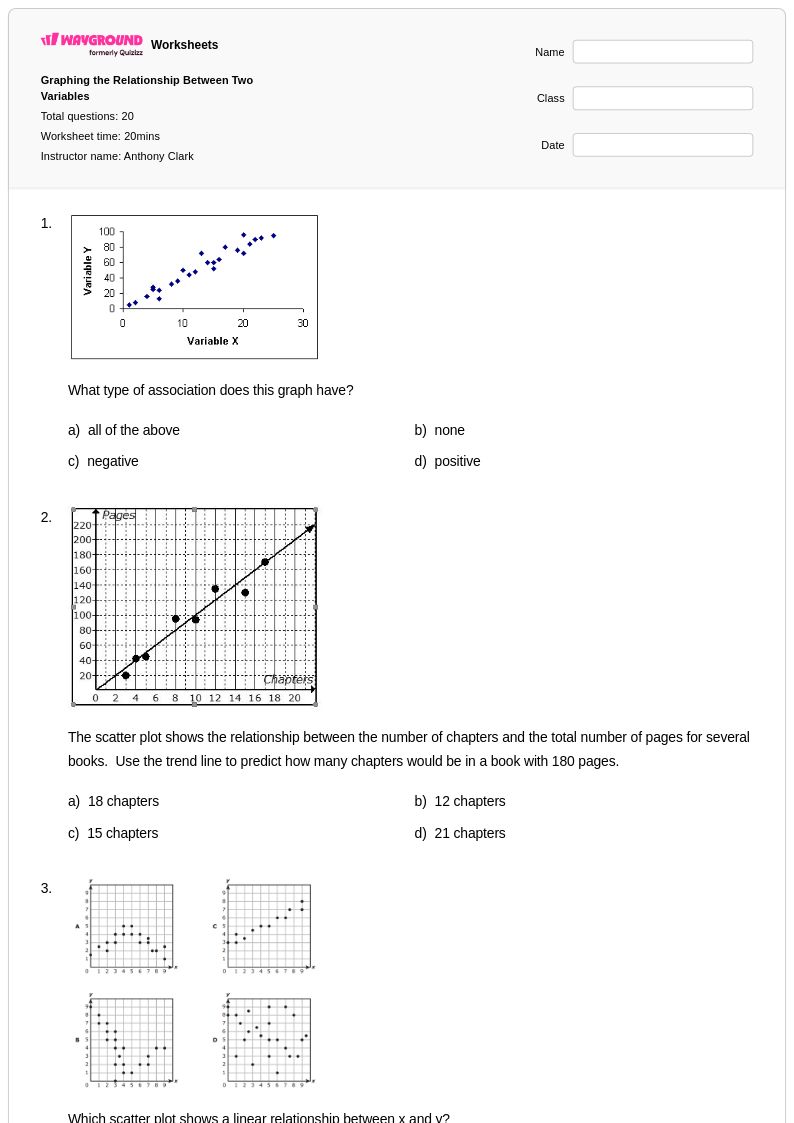
20Q
8th - Uni
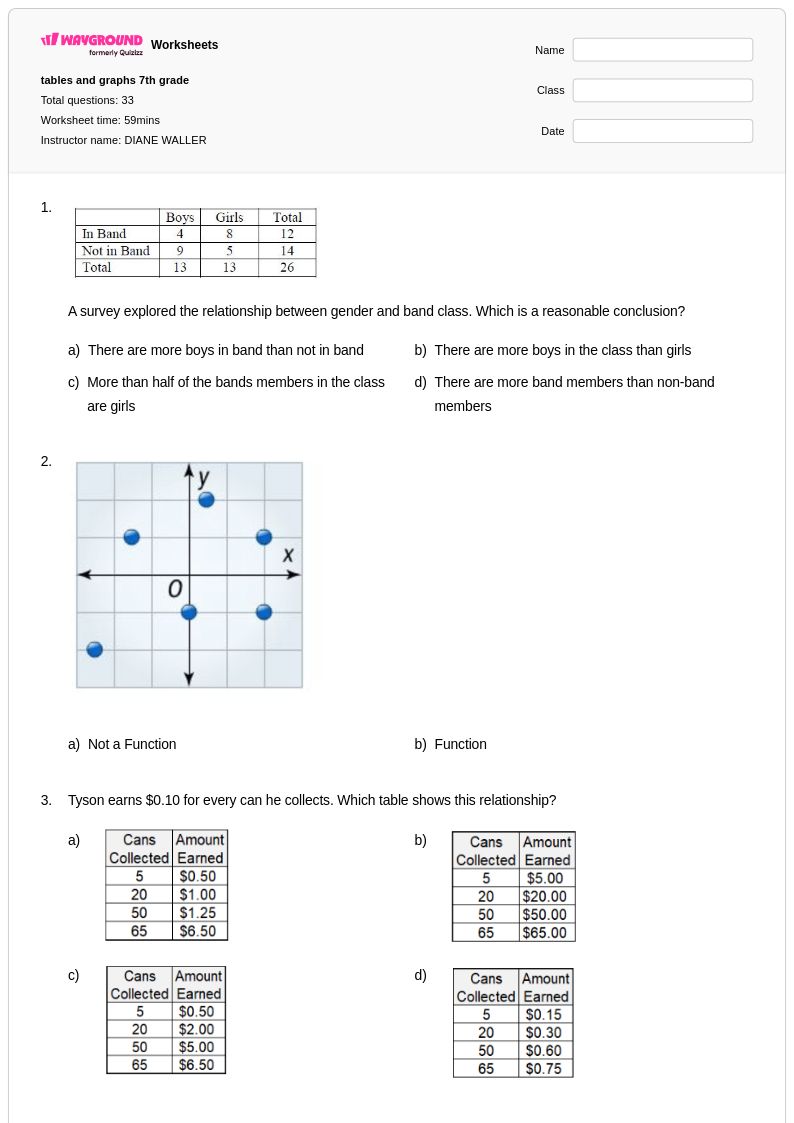
33Q
8th
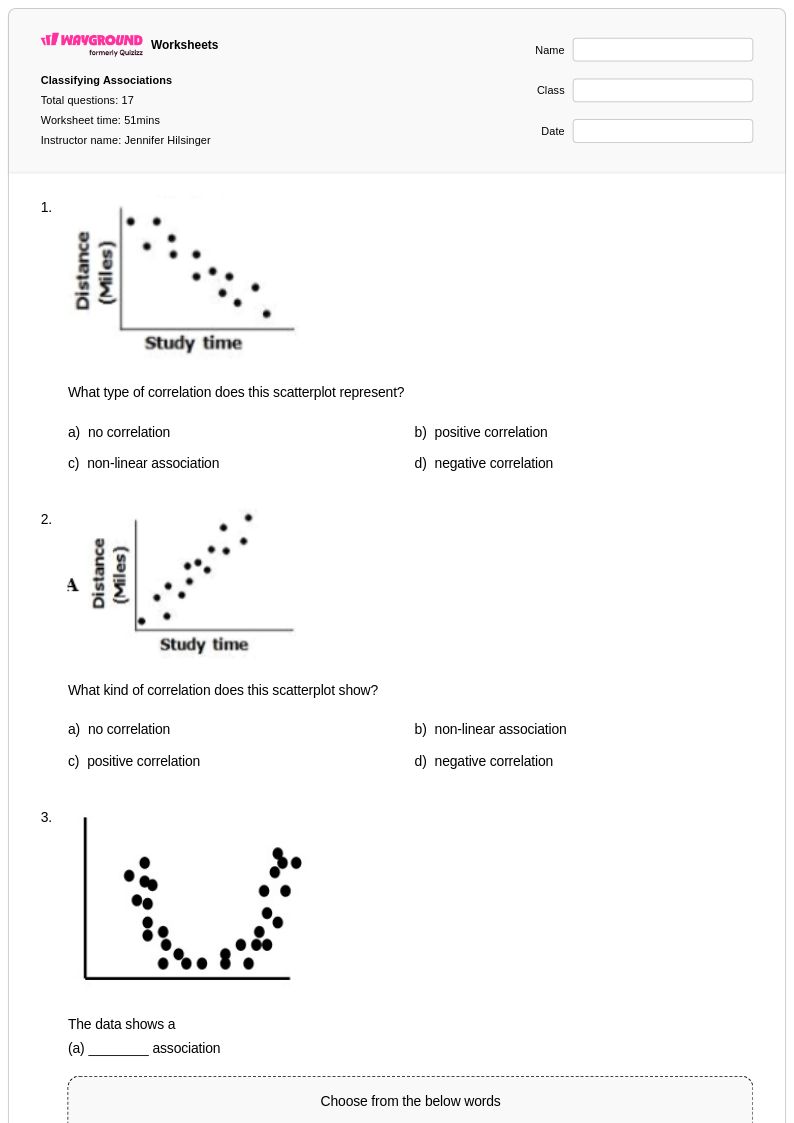
17Q
8th
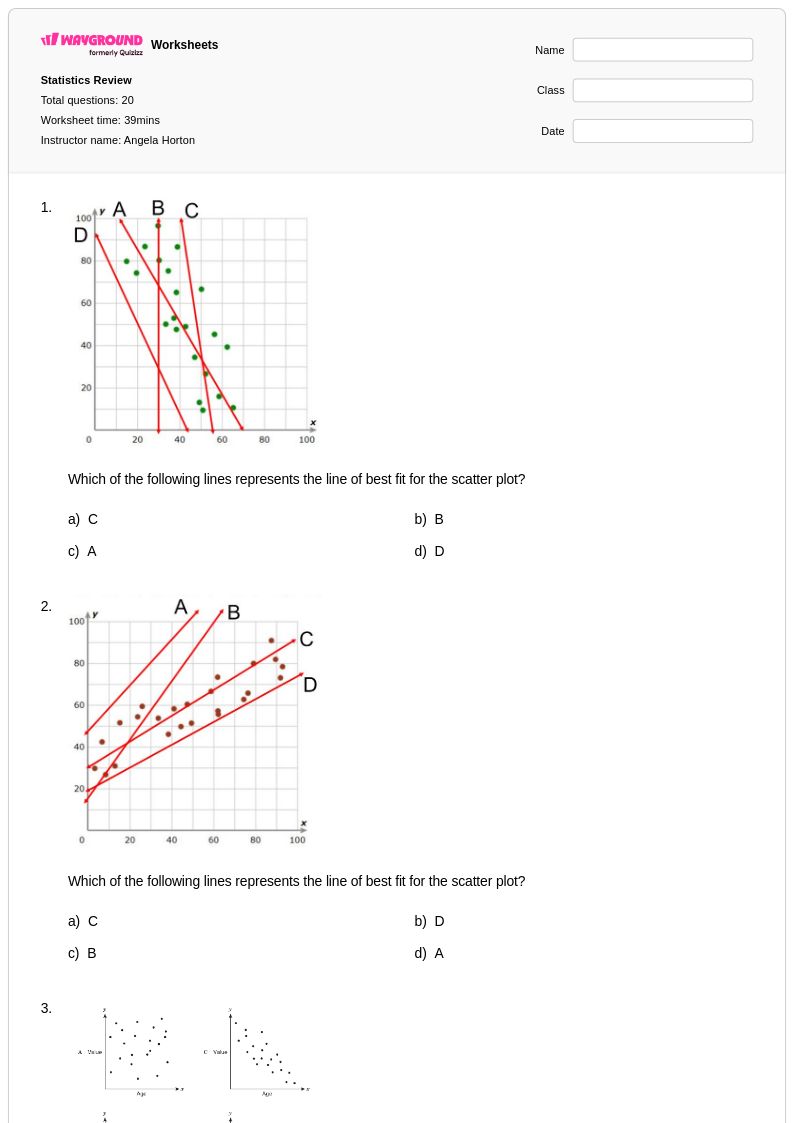
20Q
8th
13Q
8th
20Q
8th
21Q
8th
20Q
8th - Uni
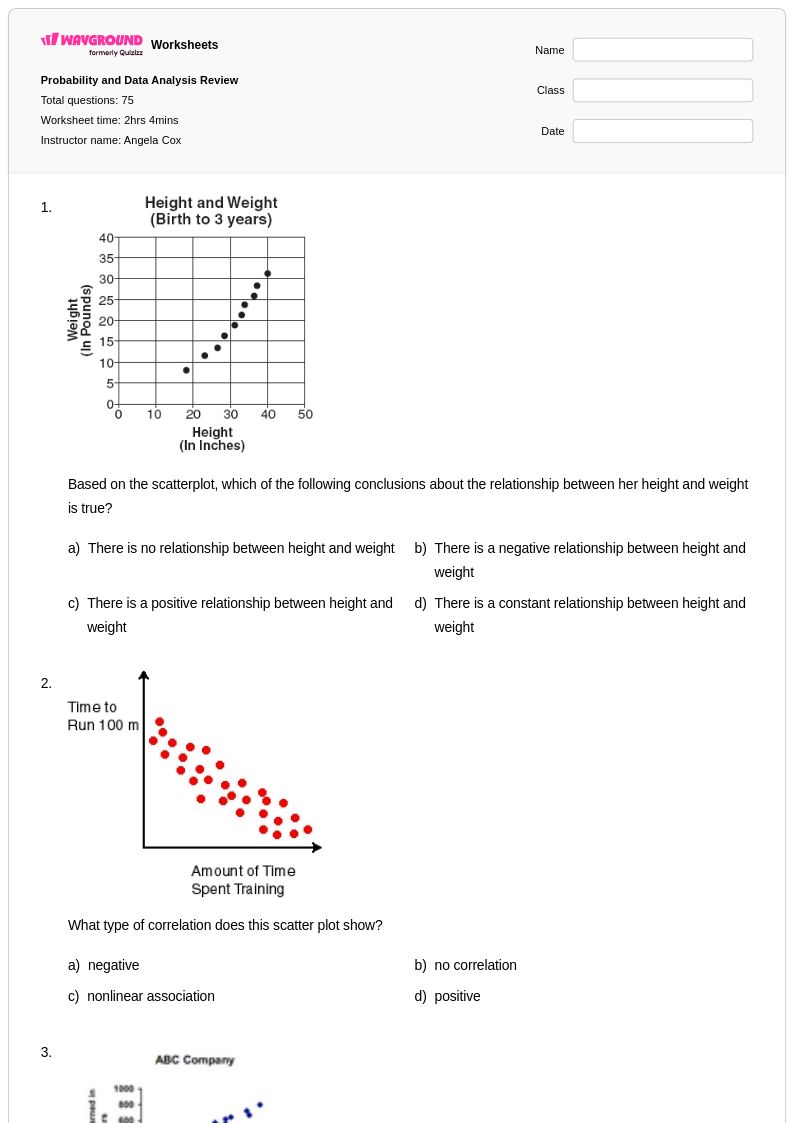
75Q
8th
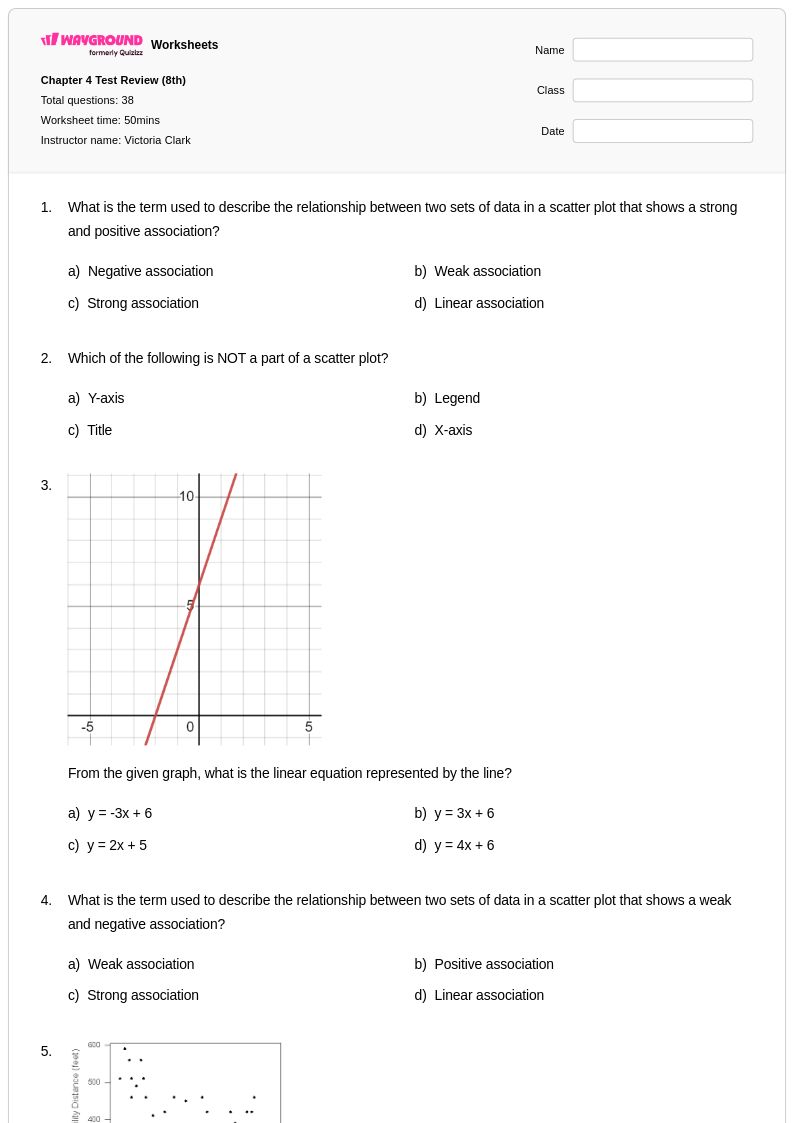
38Q
8th
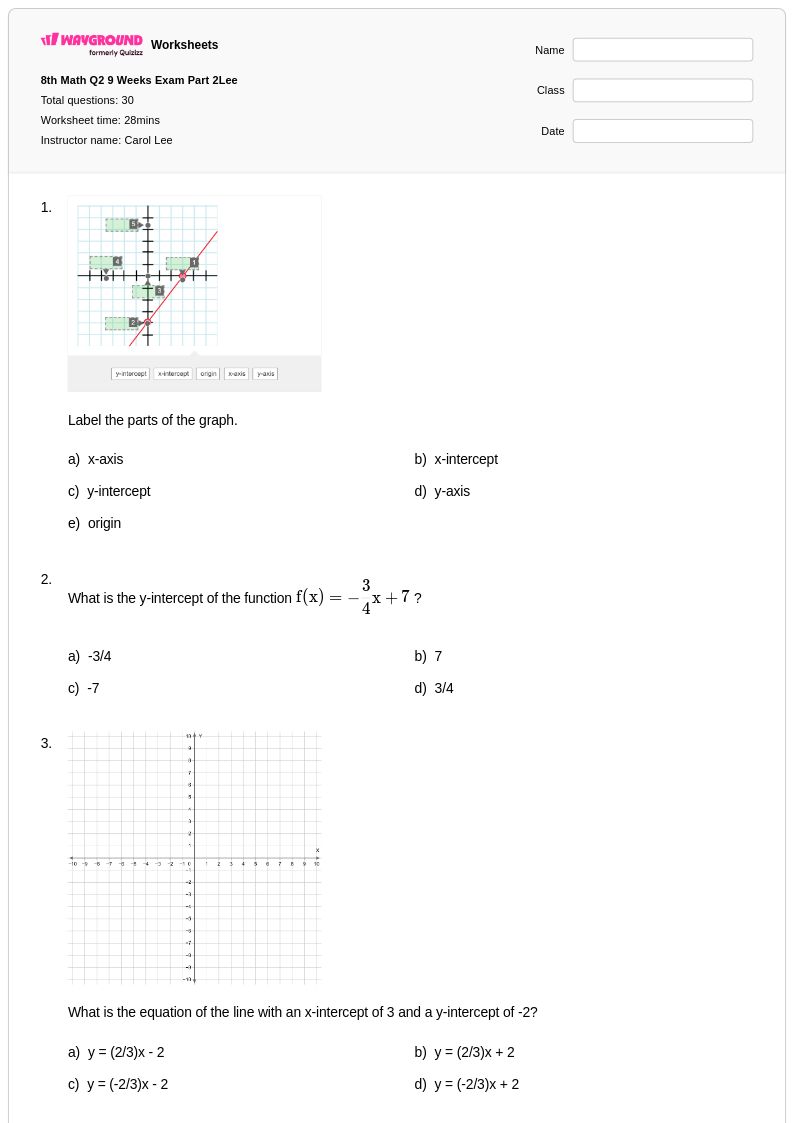
30Q
8th
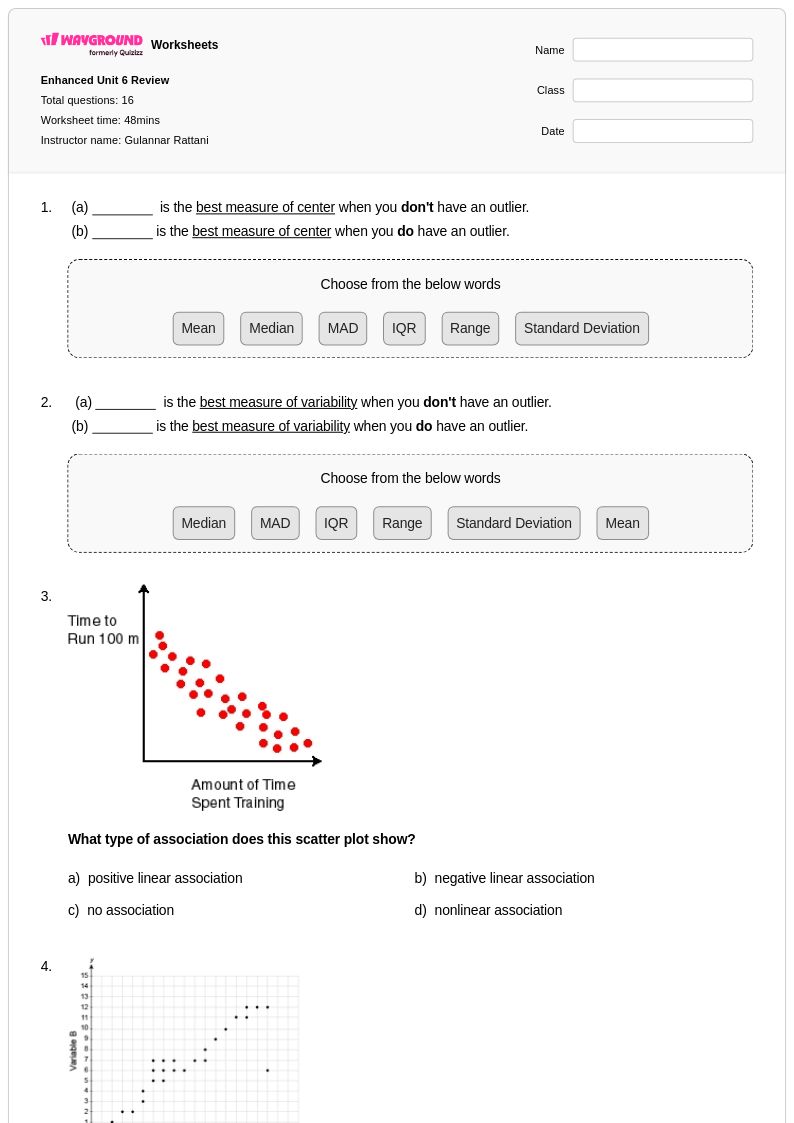
16Q
8th
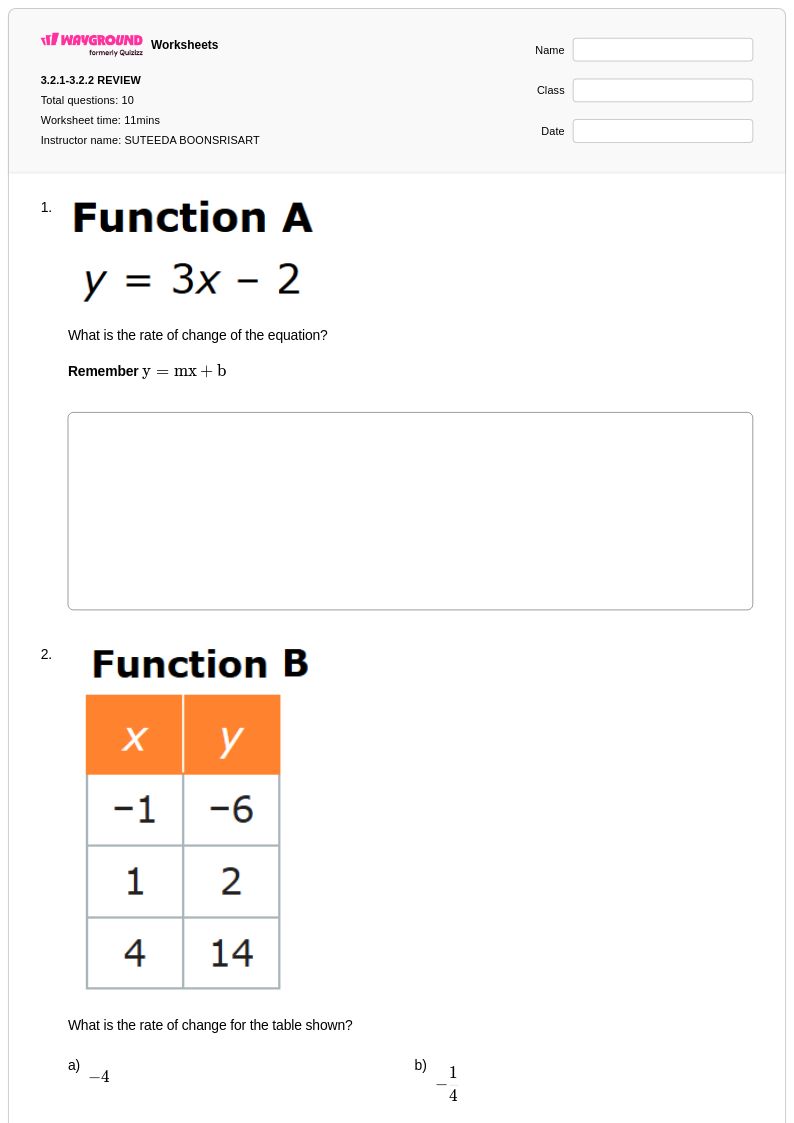
10Q
6th - 8th
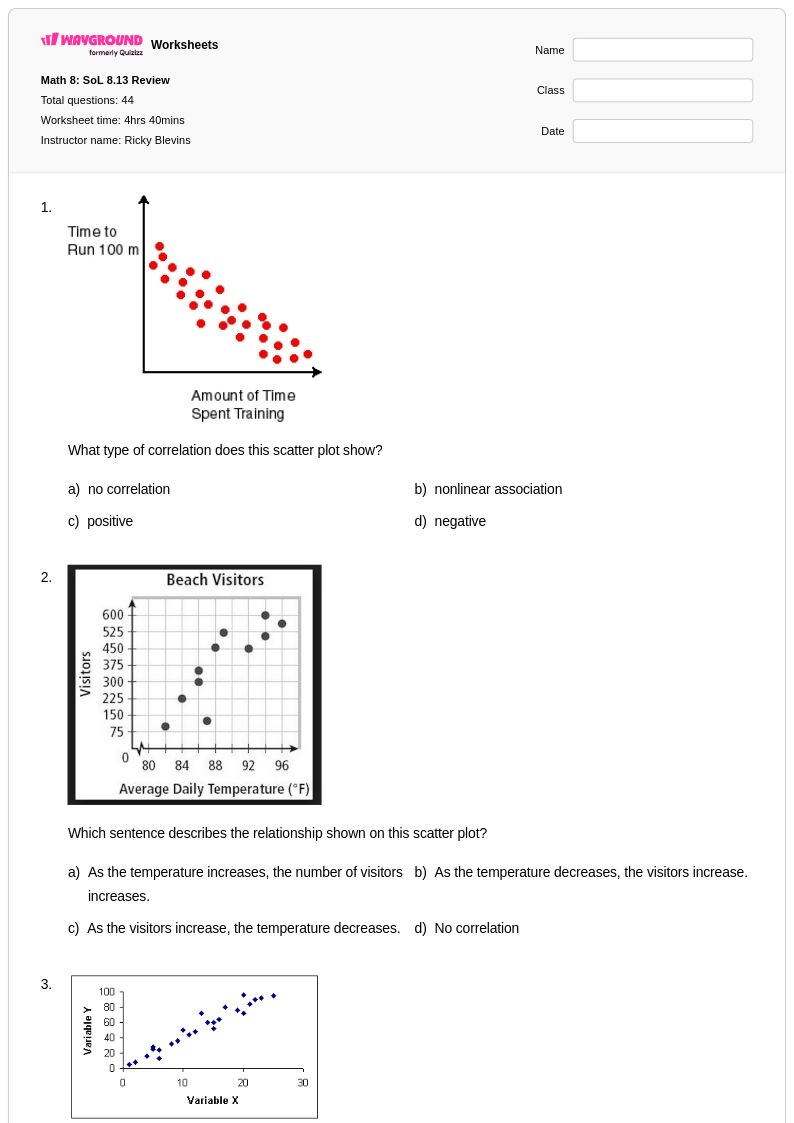
44Q
8th
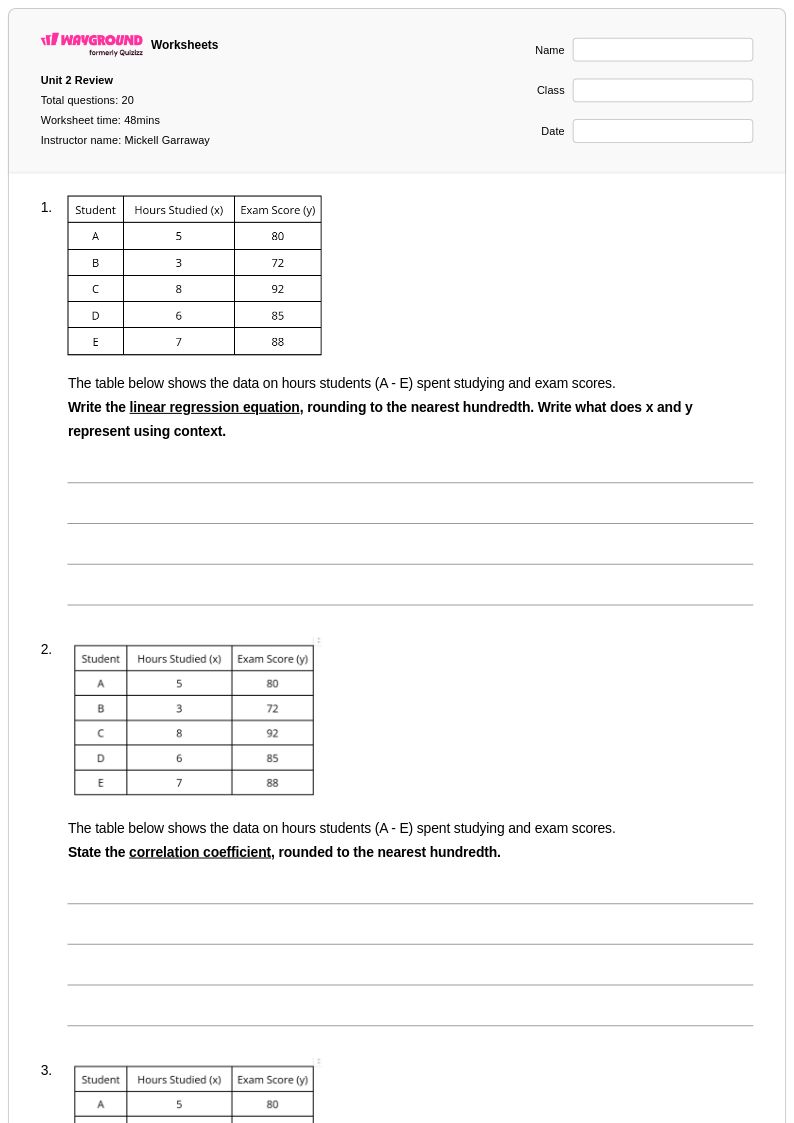
20Q
8th
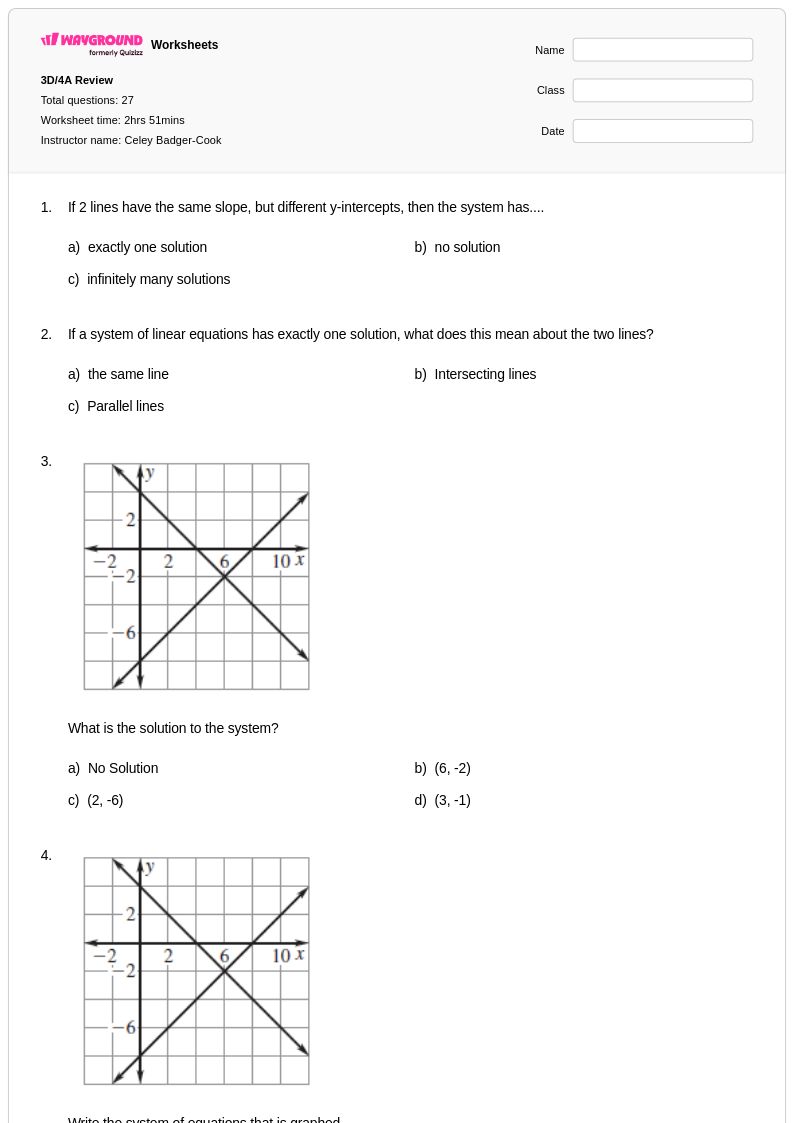
27Q
6th - 8th
Explore planilhas Scatter Plot Correlation por notas
Explore outras planilhas de assuntos para grade 8
Explore printable Scatter Plot Correlation worksheets for Grade 8
Scatter plot correlation worksheets for Grade 8 mathematics provide students with essential practice in analyzing relationships between two variables through visual data representation. These comprehensive resources help eighth-grade students develop critical skills in identifying positive, negative, and no correlation patterns while interpreting real-world data sets. Students work through practice problems that guide them in plotting coordinate pairs, drawing trend lines, and making predictions based on correlational strength. The worksheets include detailed answer keys that support independent learning and self-assessment, while printable pdf formats ensure easy classroom distribution and homework assignments. Free resources focus on building foundational understanding of correlation coefficients, outliers, and the distinction between correlation and causation.
Wayground, formerly Quizizz, supports mathematics educators with millions of teacher-created scatter plot correlation worksheets designed specifically for Grade 8 data and graphing instruction. The platform's robust search and filtering capabilities allow teachers to quickly locate resources aligned with state and national mathematics standards, ensuring content matches specific curriculum requirements. Differentiation tools enable educators to modify worksheets for varying skill levels, supporting both remediation for struggling students and enrichment opportunities for advanced learners. Teachers can access materials in both digital and printable formats, including downloadable pdf versions, making lesson planning flexible and efficient. These customizable resources streamline instruction while providing targeted skill practice that helps students master correlation analysis concepts essential for advanced statistical thinking.
FAQs
How do scatter plots align with 8th-grade math standards?
How should I introduce the concept of "correlation is not causation"?
What are common errors for 8th graders analyzing scatter plots?
What types of problems are in these 8th-grade worksheets?
How can I use this worksheet to assess my students' understanding?
How can I adapt this worksheet for diverse learners?