
20 Q
6th

20 Q
6th
10 Q
6th

20 Q
6th

21 Q
6th
19 Q
6th
20 Q
6th
16 Q
6th
12 Q
6th
15 Q
6th - 8th
15 Q
6th
10 Q
6th
10 Q
6th - Uni
21 Q
6th - 9th
20 Q
6th
16 Q
6th
20 Q
6th
15 Q
6th - 7th
16 Q
6th
16 Q
6th - 8th
11 Q
6th
20 Q
6th
11 Q
6th - 7th
20 Q
5th - Uni
Explore Shapes of Distributions Worksheets by Grades
Explore Other Subject Worksheets for grade 6
Explore printable Shapes of Distributions worksheets for Grade 6
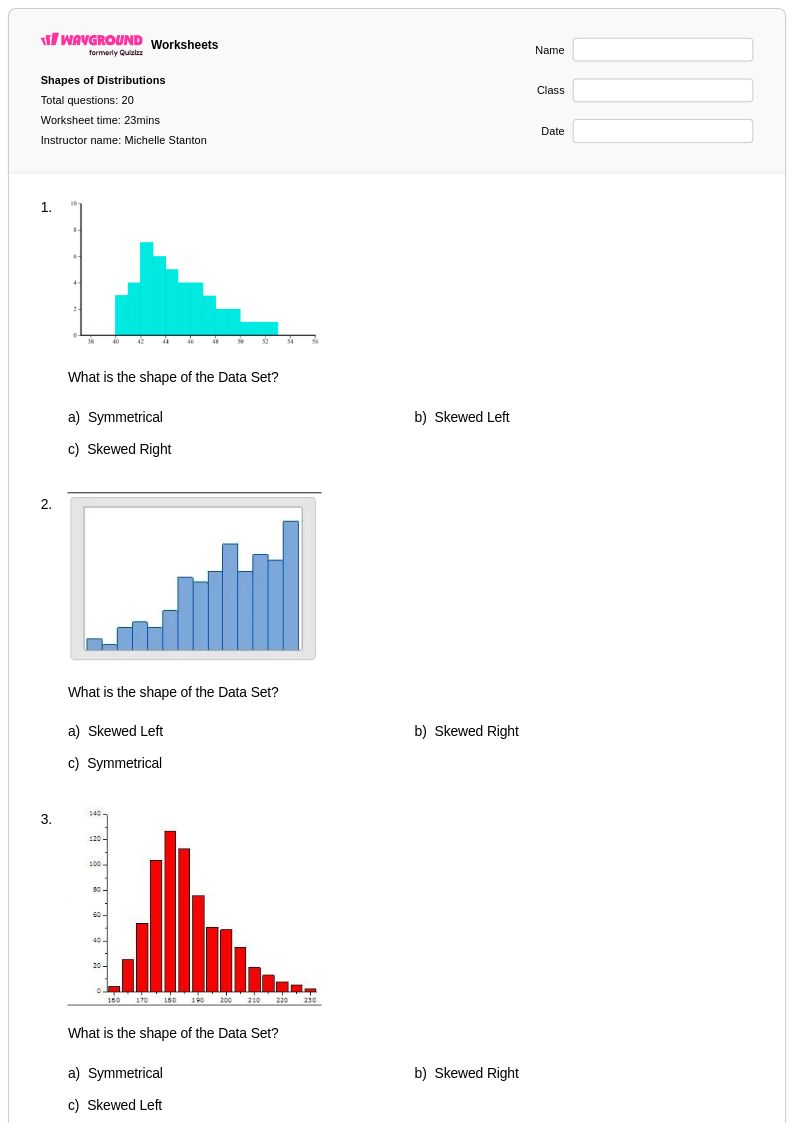
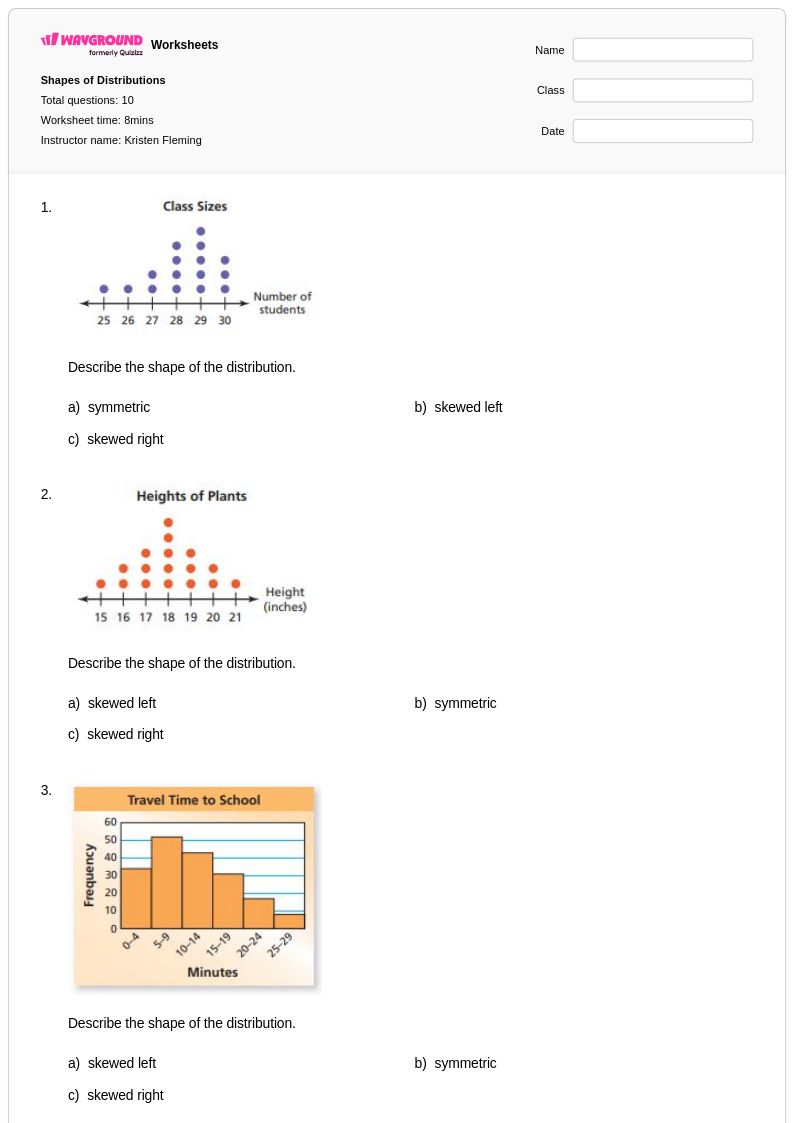
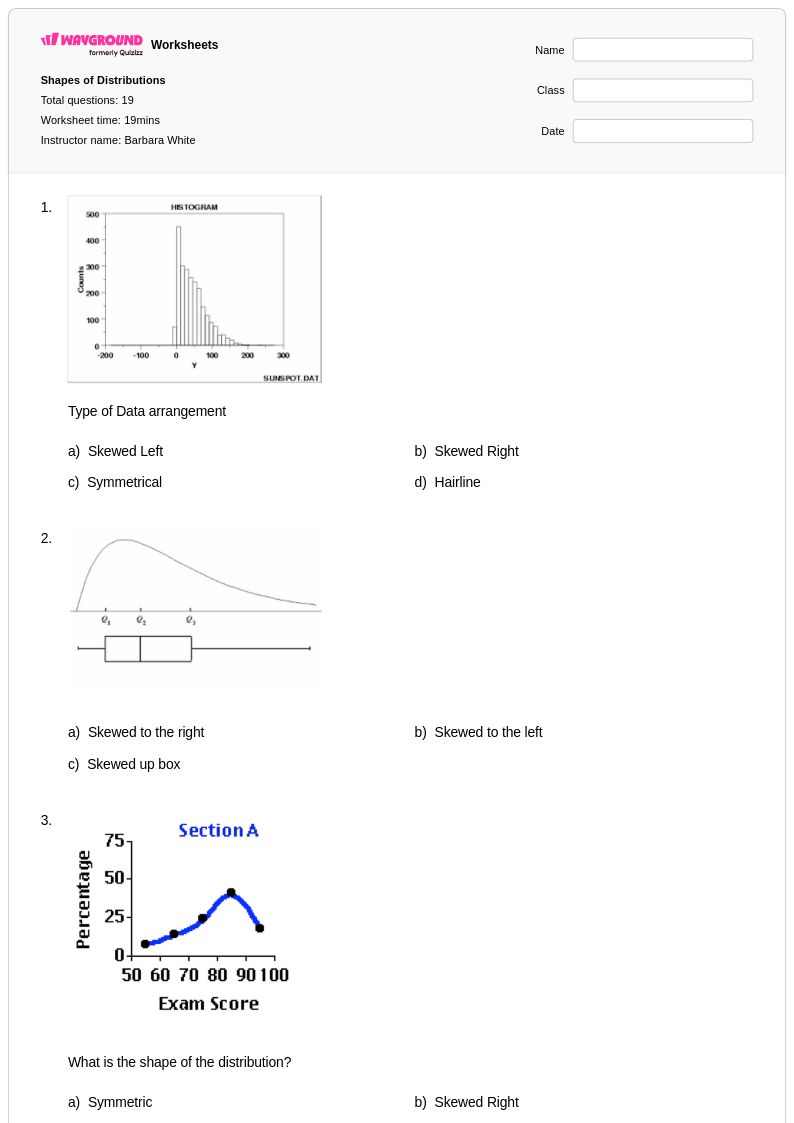
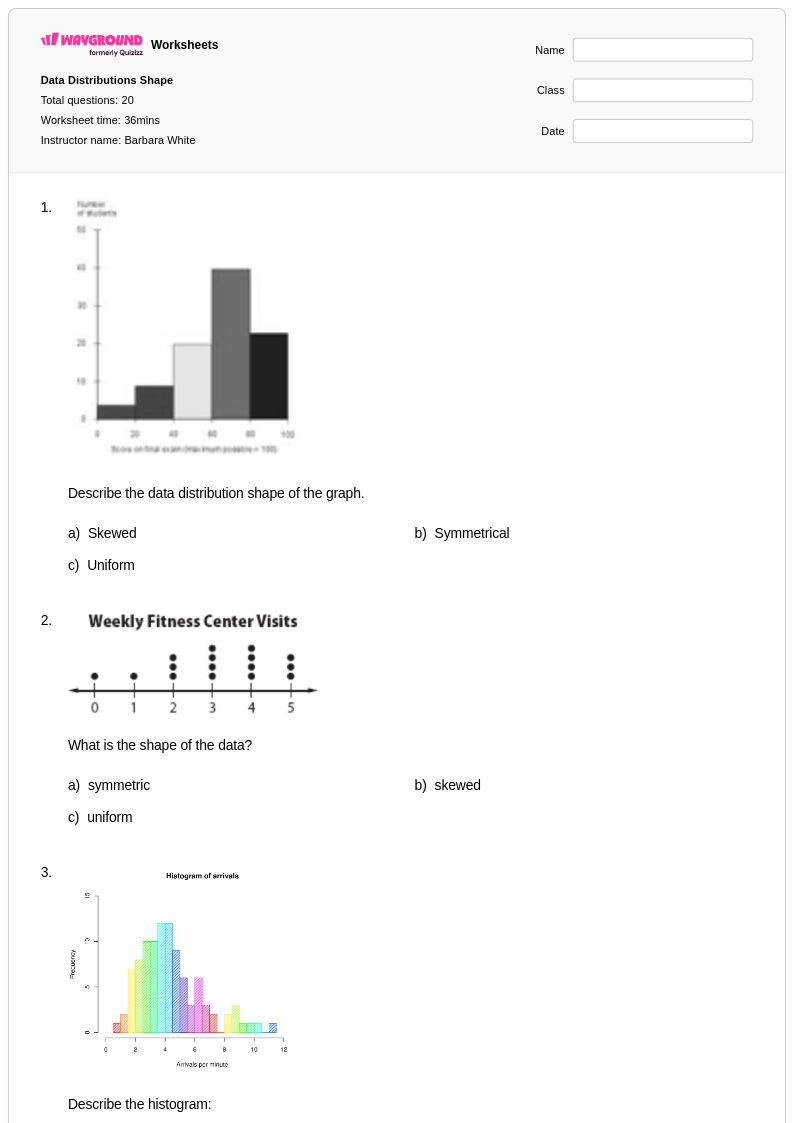
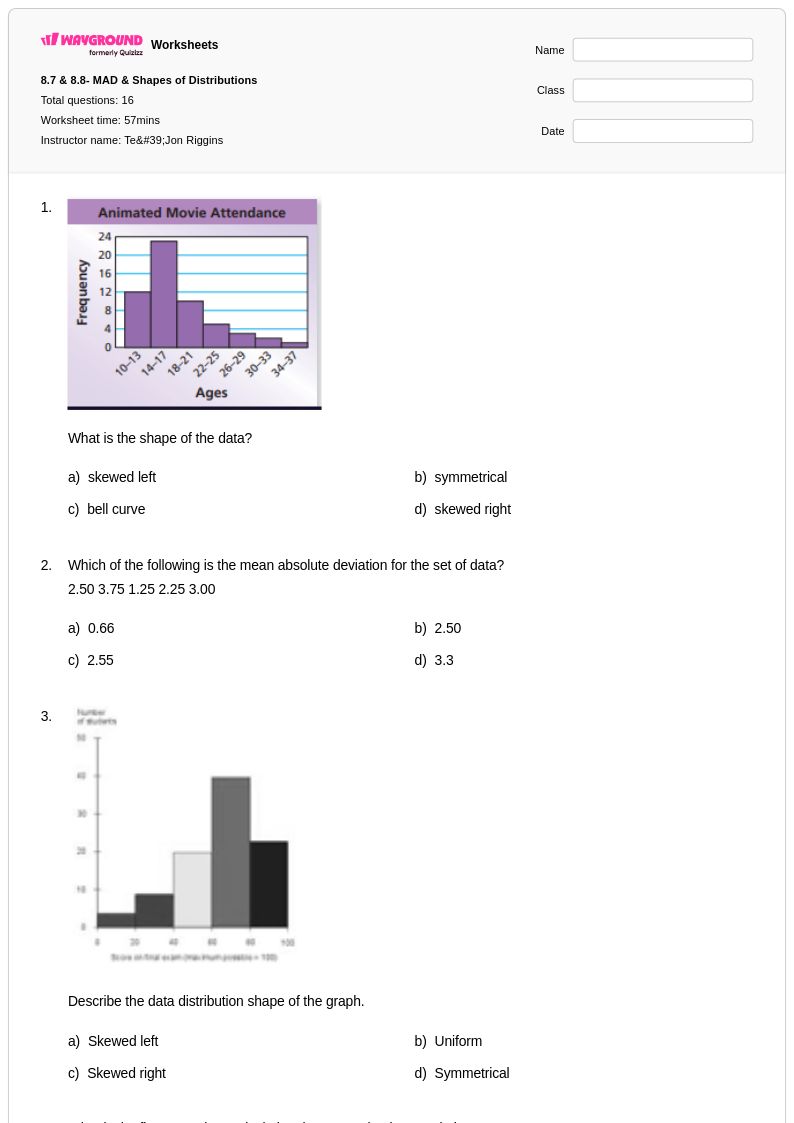
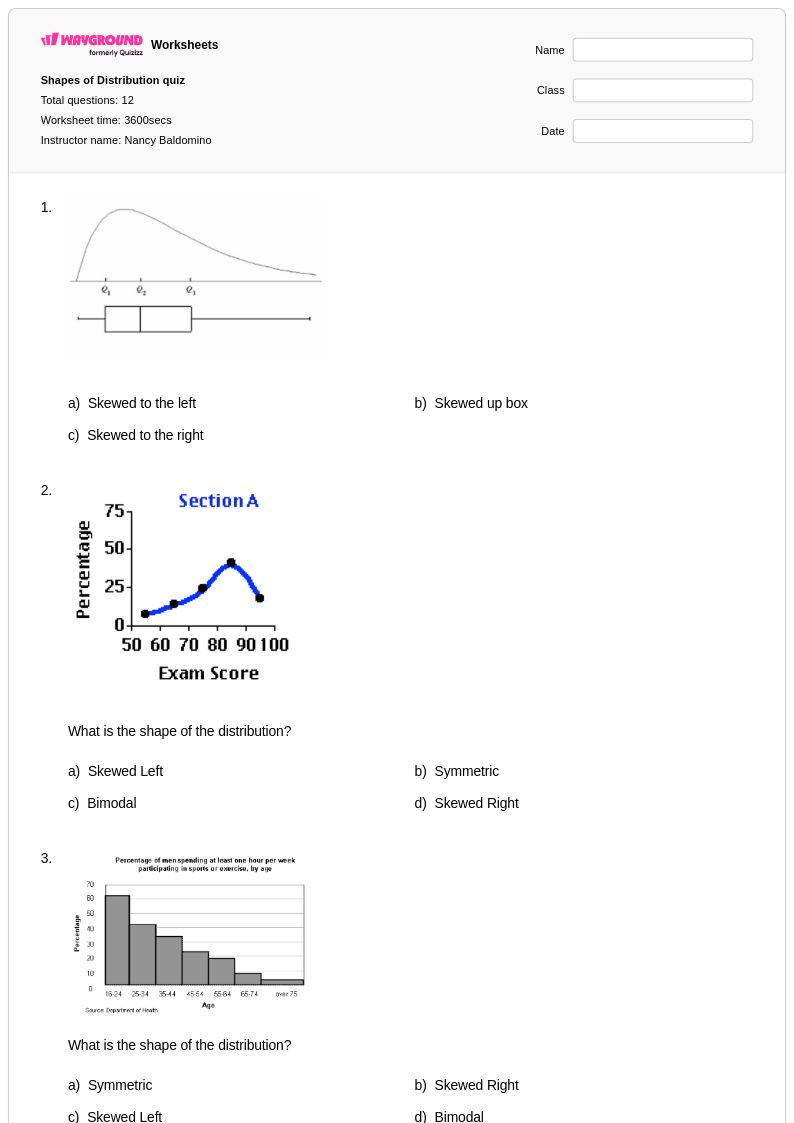
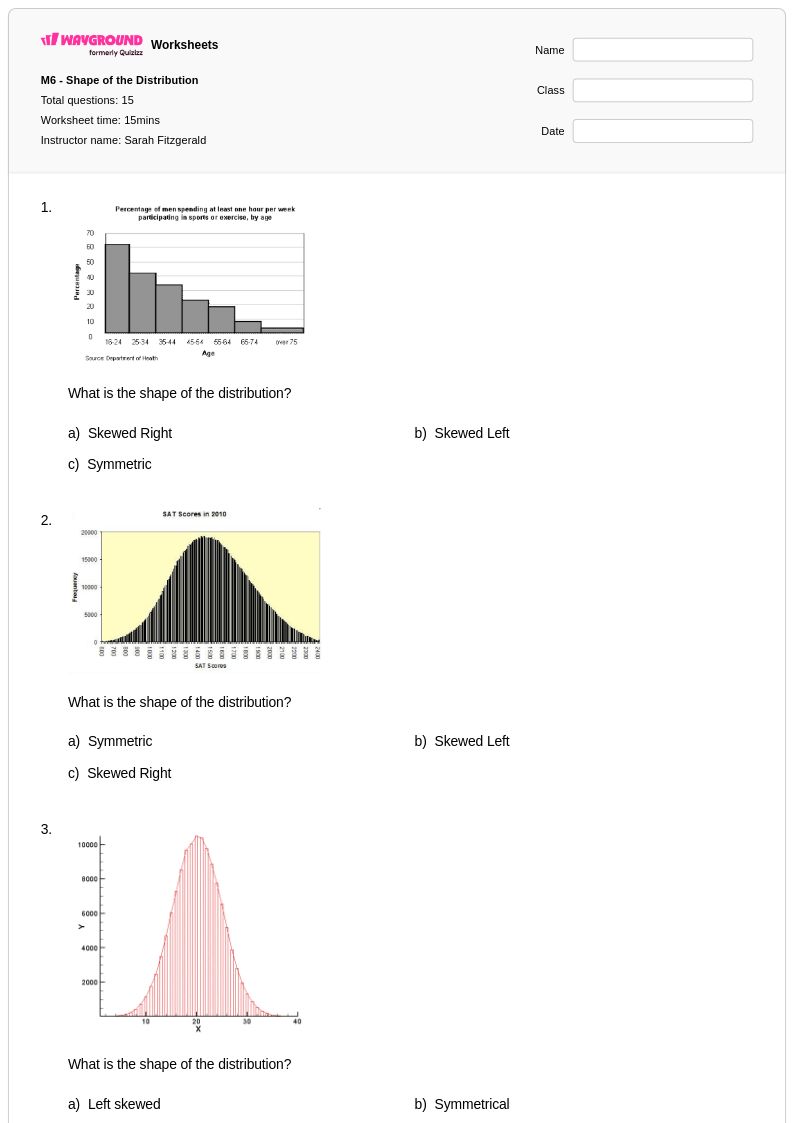
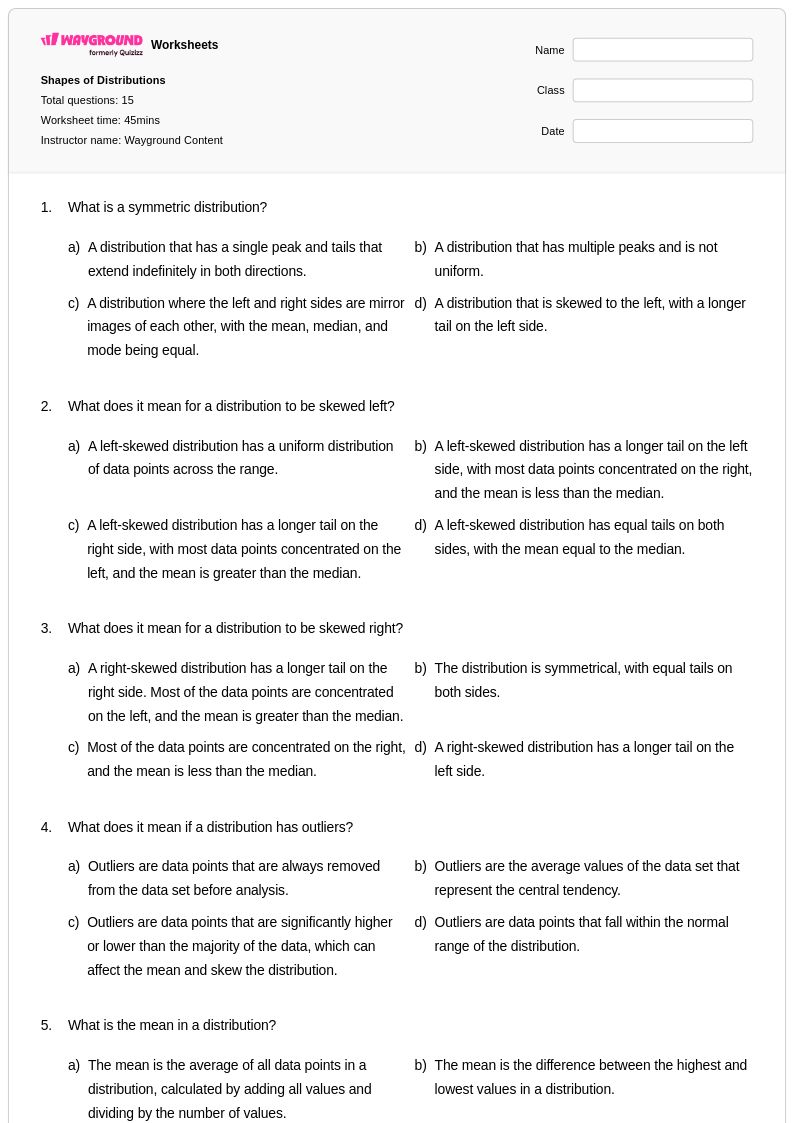
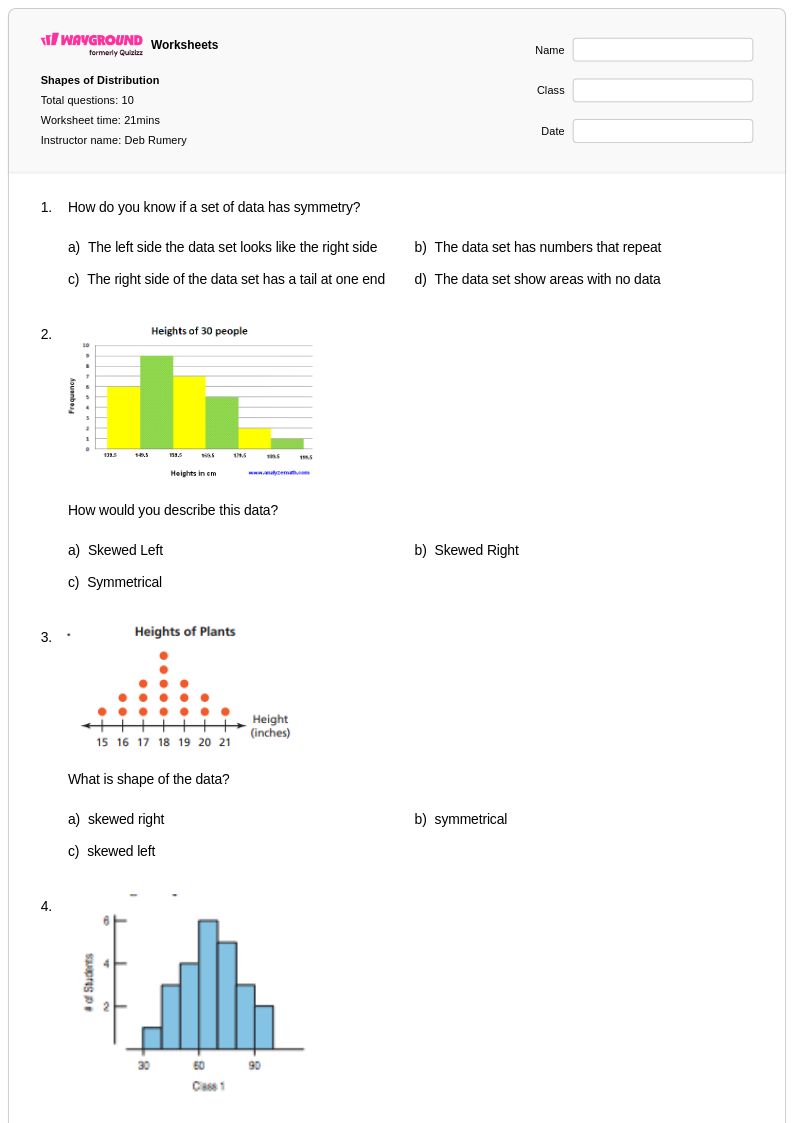
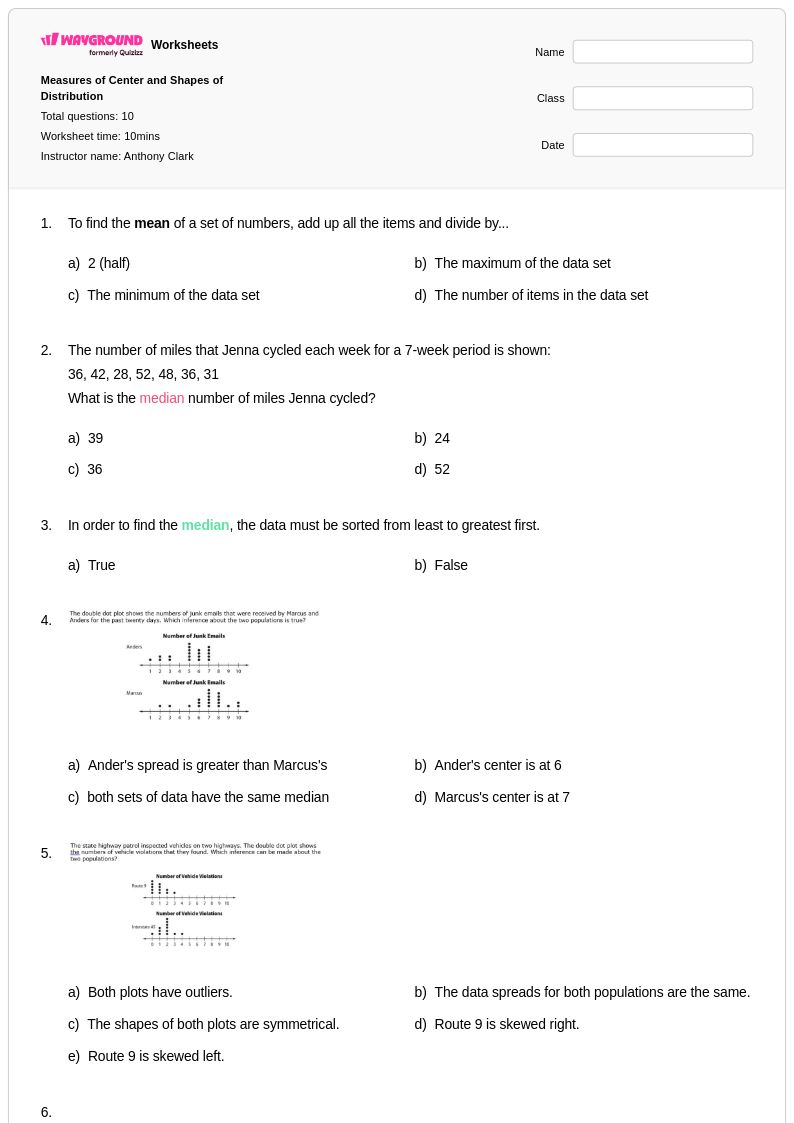
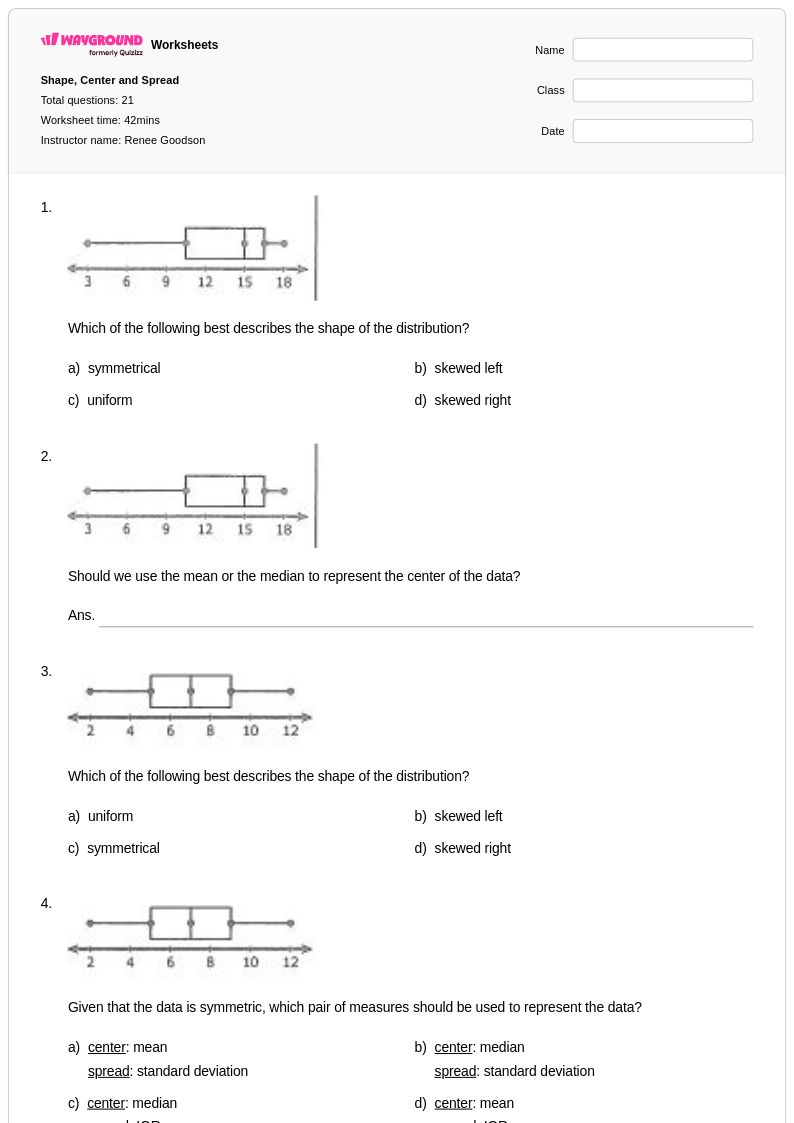
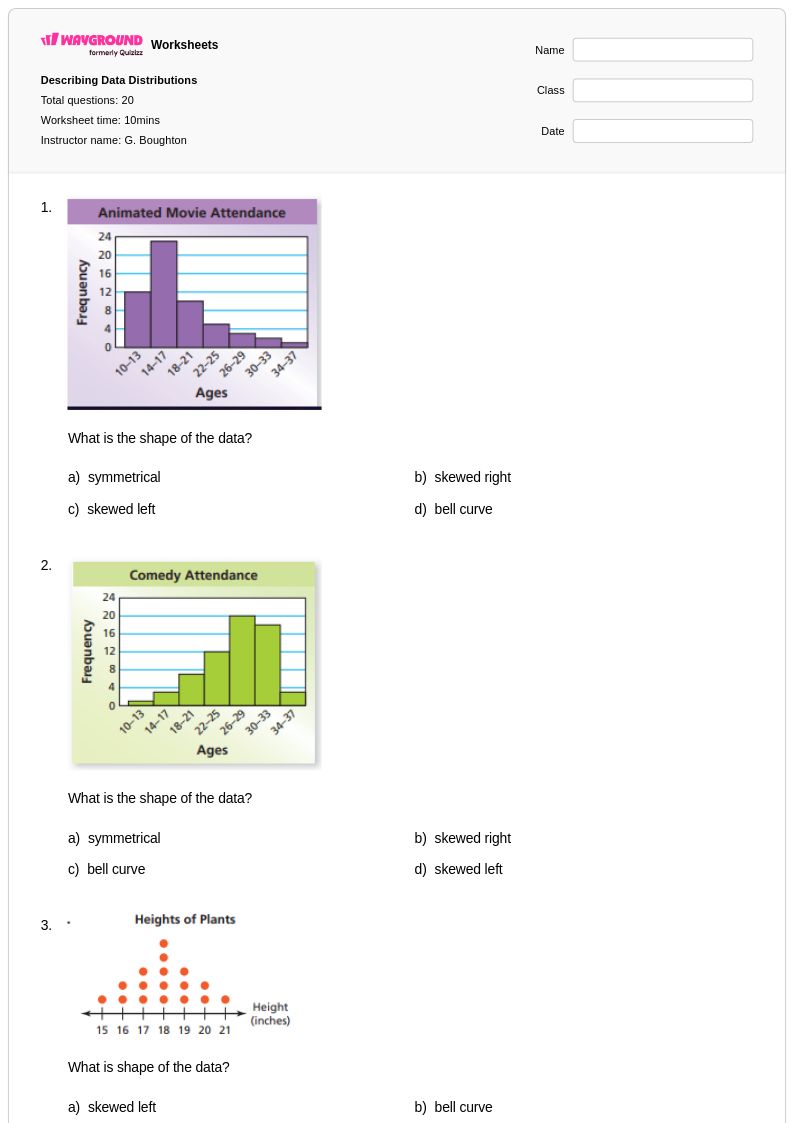
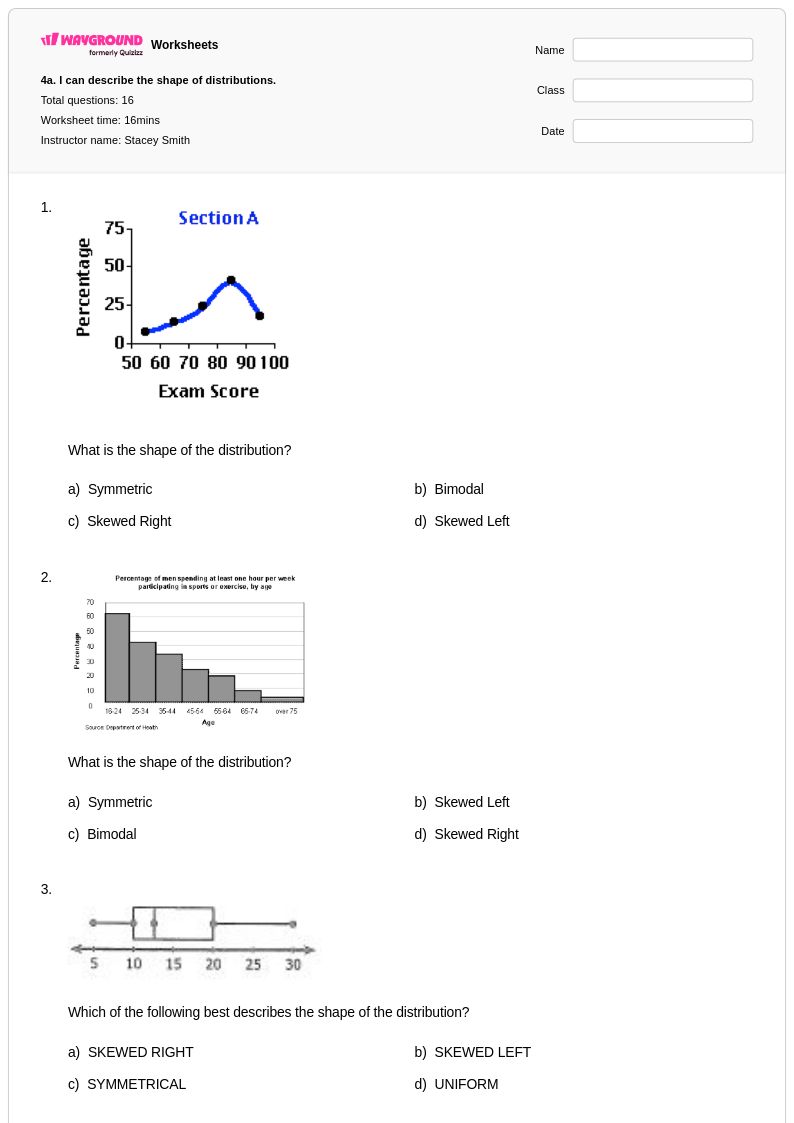
Shapes of Distributions worksheets for Grade 6 provide essential practice opportunities for students developing foundational statistical reasoning skills. These comprehensive printables guide sixth-grade learners through identifying and analyzing different distribution patterns, including symmetric, skewed, and uniform distributions using age-appropriate data sets and visual representations. Students strengthen their ability to describe data shape, recognize patterns in histograms and dot plots, and make connections between data characteristics and real-world contexts through carefully scaffolded practice problems. Each worksheet includes detailed answer keys that support both independent learning and guided instruction, while free pdf formats ensure accessibility across diverse classroom environments.
Wayground (formerly Quizizz) empowers educators with millions of teacher-created Shapes of Distributions resources that streamline lesson planning and differentiated instruction for Grade 6 mathematics classrooms. The platform's robust search and filtering capabilities allow teachers to quickly locate standards-aligned materials that match specific learning objectives and student readiness levels. Comprehensive customization tools enable educators to modify existing worksheets or create targeted practice sets for remediation and enrichment purposes, while seamless integration between printable and digital formats accommodates various instructional preferences and technology environments. These versatile resources support systematic skill development in statistical concepts, helping teachers provide consistent practice opportunities that build student confidence in analyzing and interpreting data distributions.