
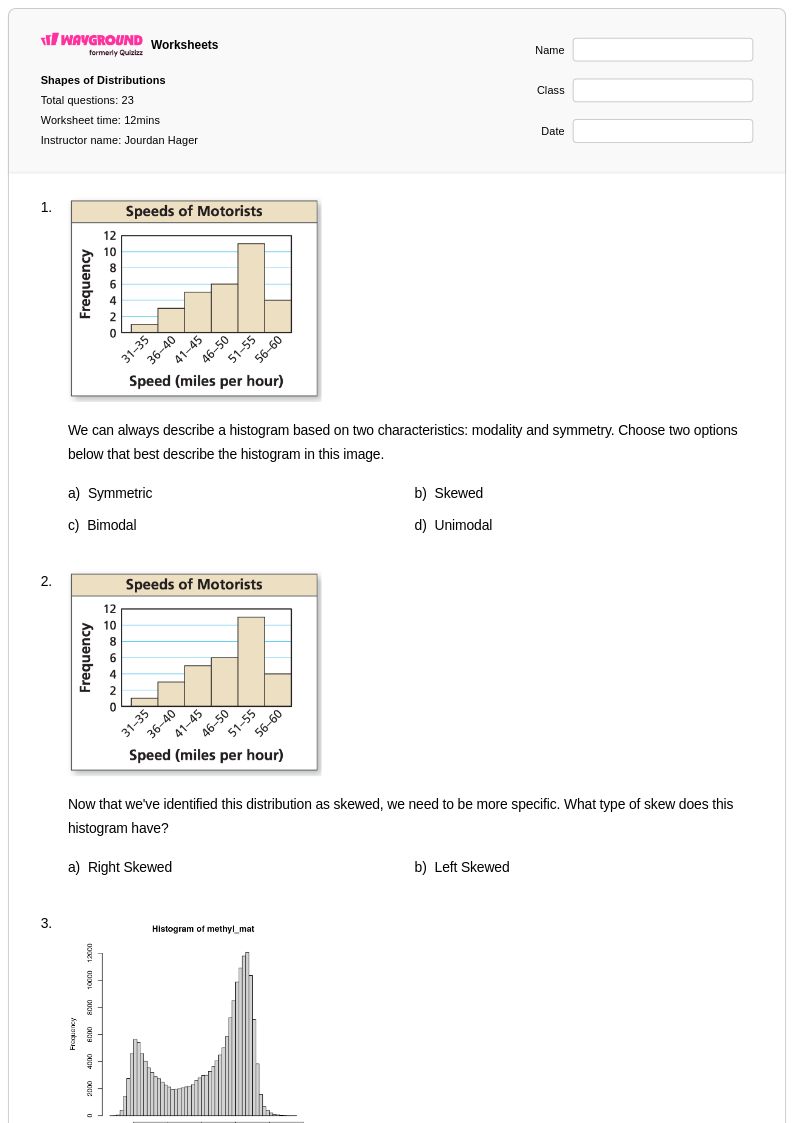
23 Hỏi
7th - 12th
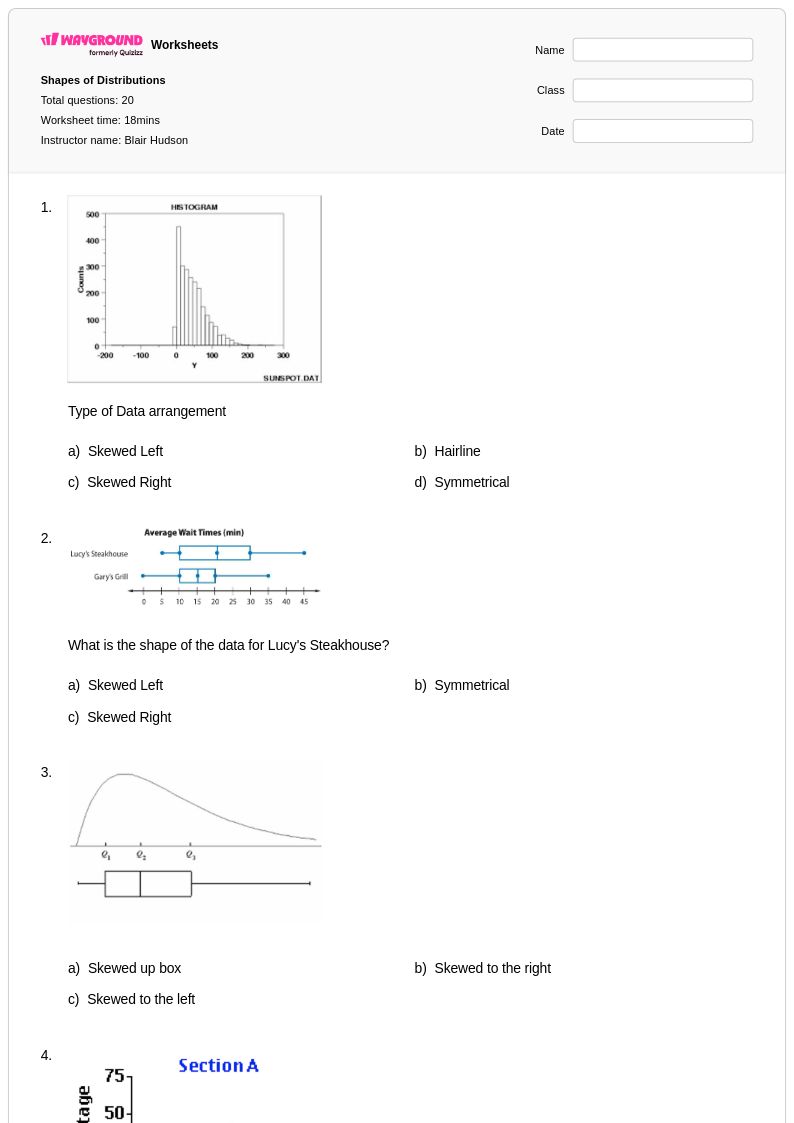
20 Hỏi
7th - 9th
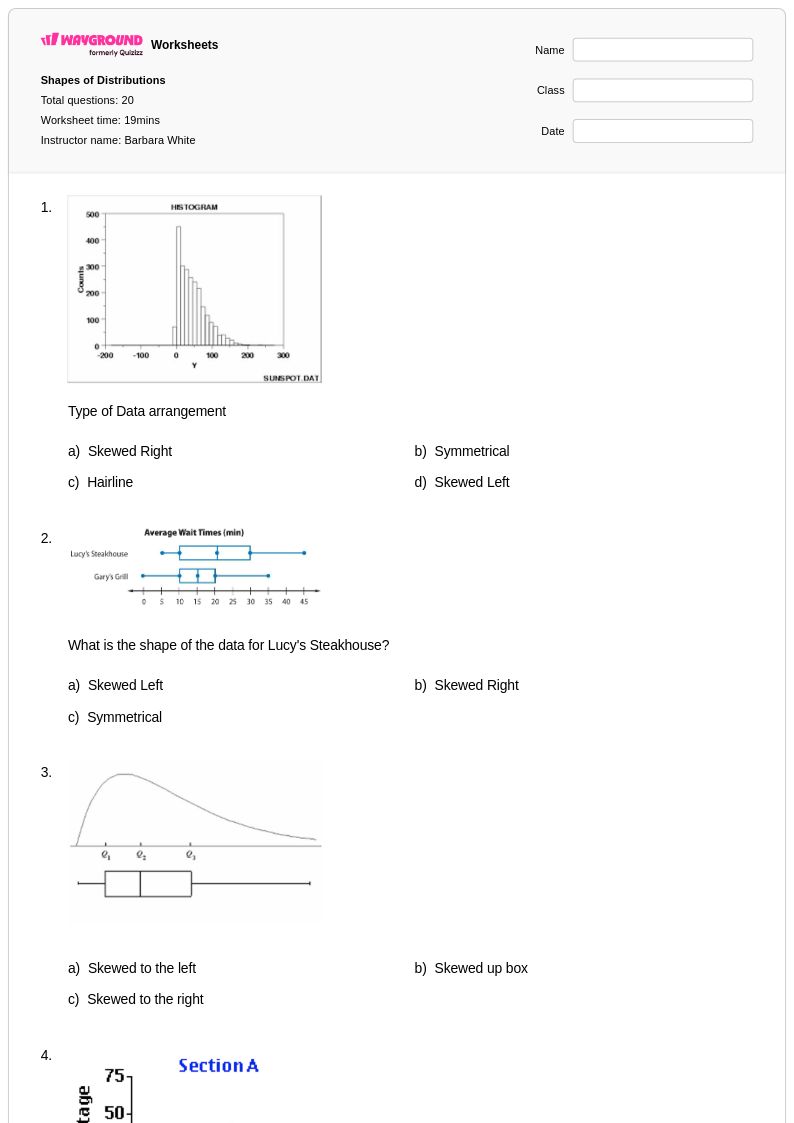
20 Hỏi
7th - 9th
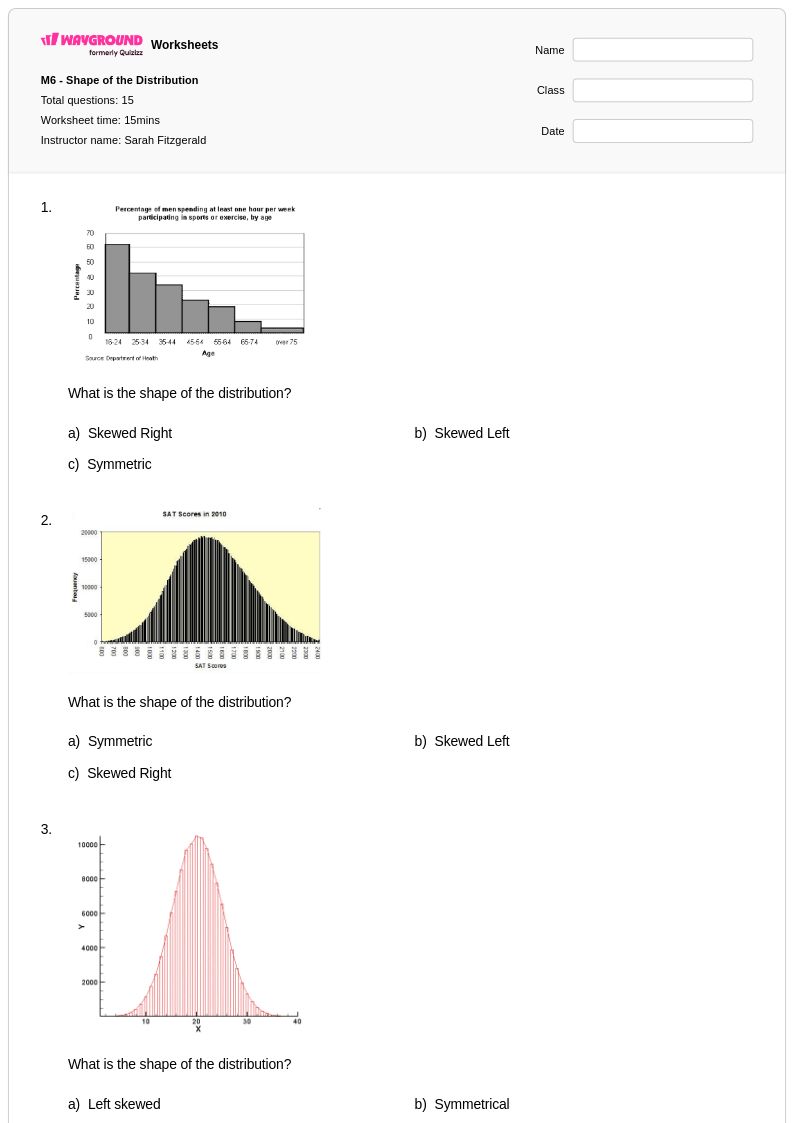
15 Hỏi
6th - 8th
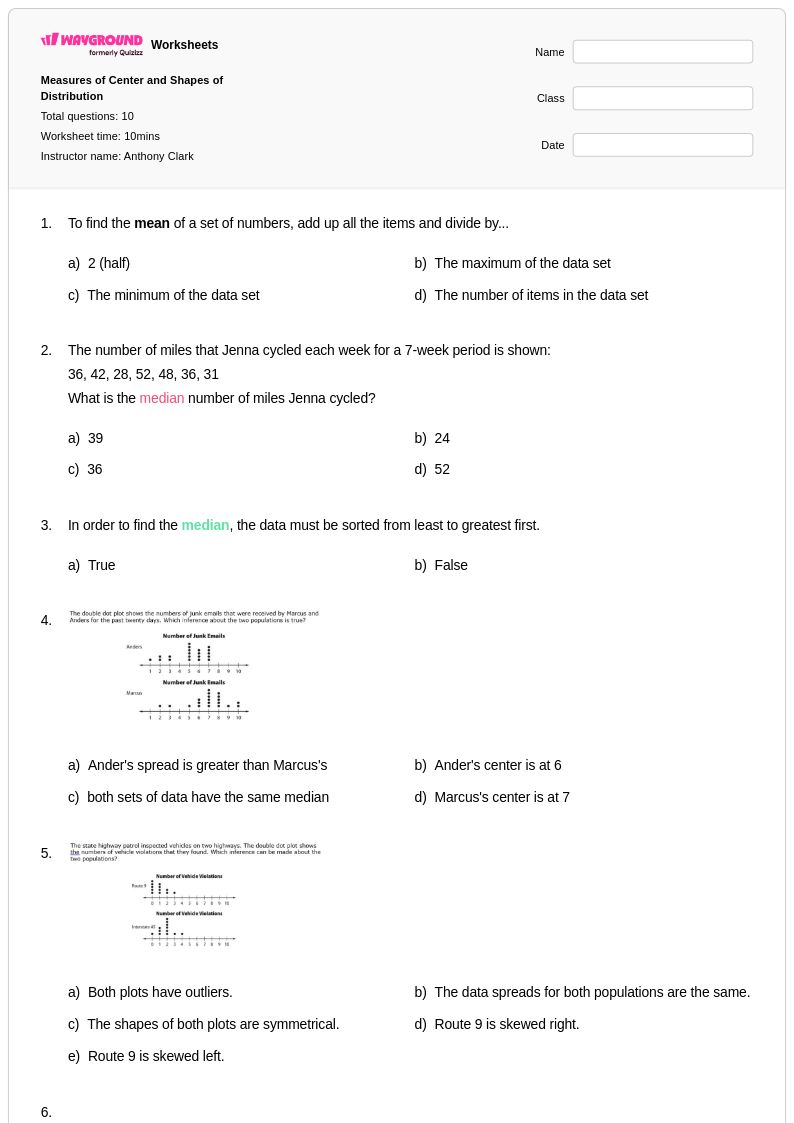
10 Hỏi
6th - Uni
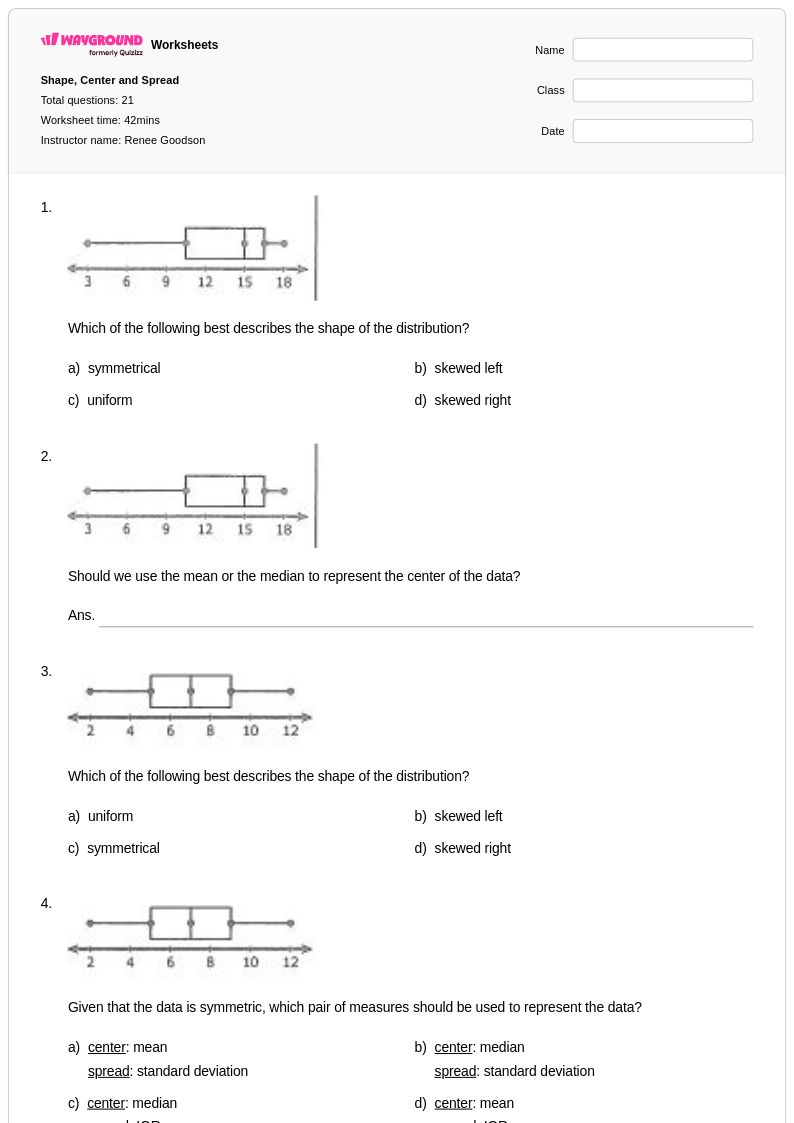
21 Hỏi
6th - 9th
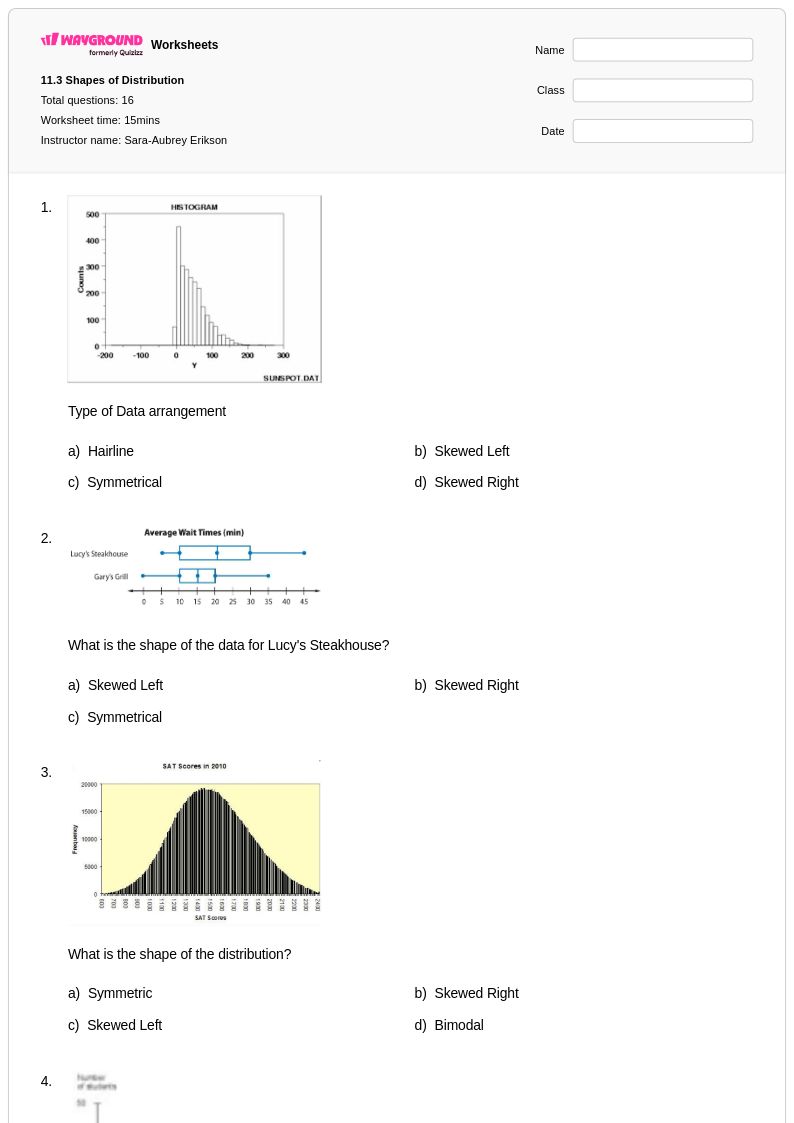
16 Hỏi
7th - 9th
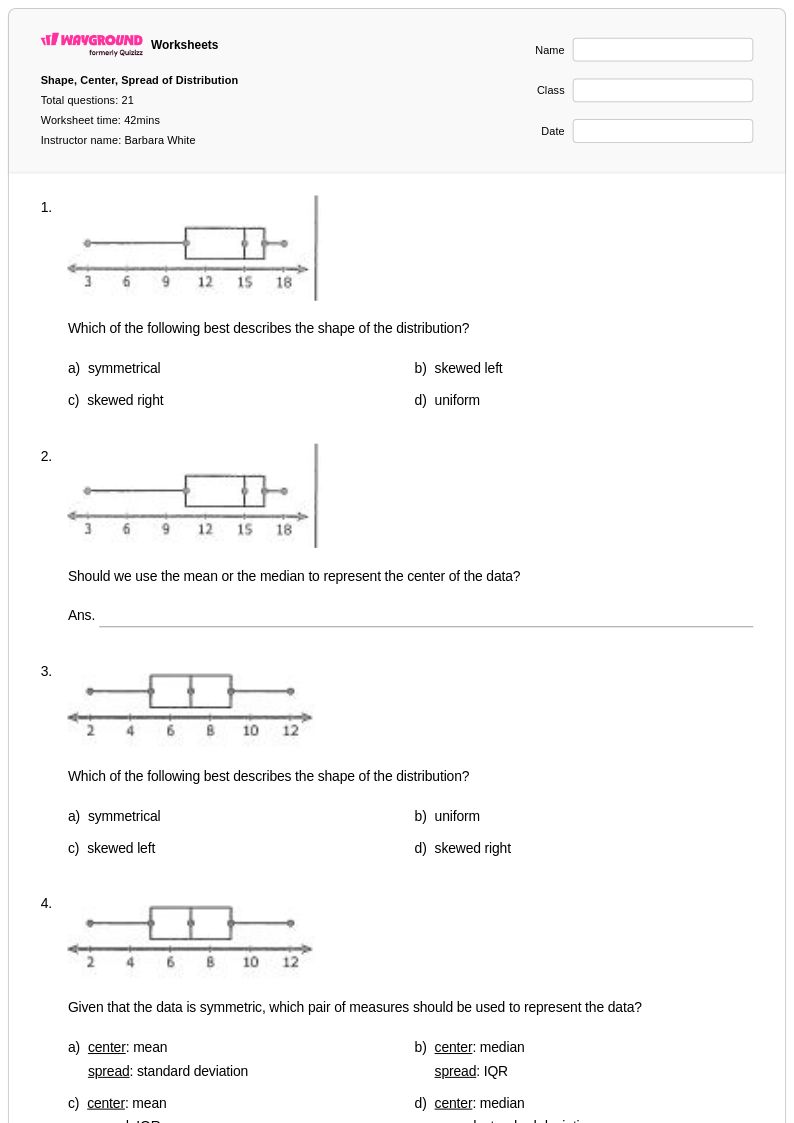
21 Hỏi
6th - 9th
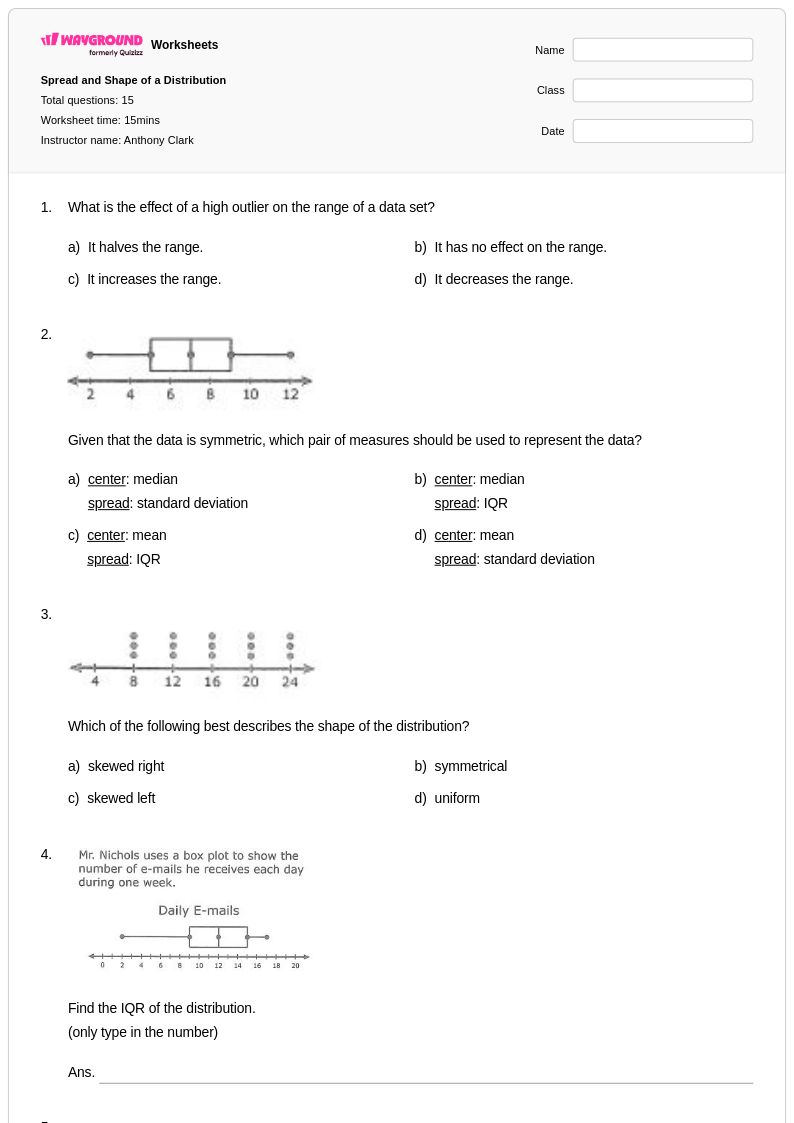
15 Hỏi
6th - Uni
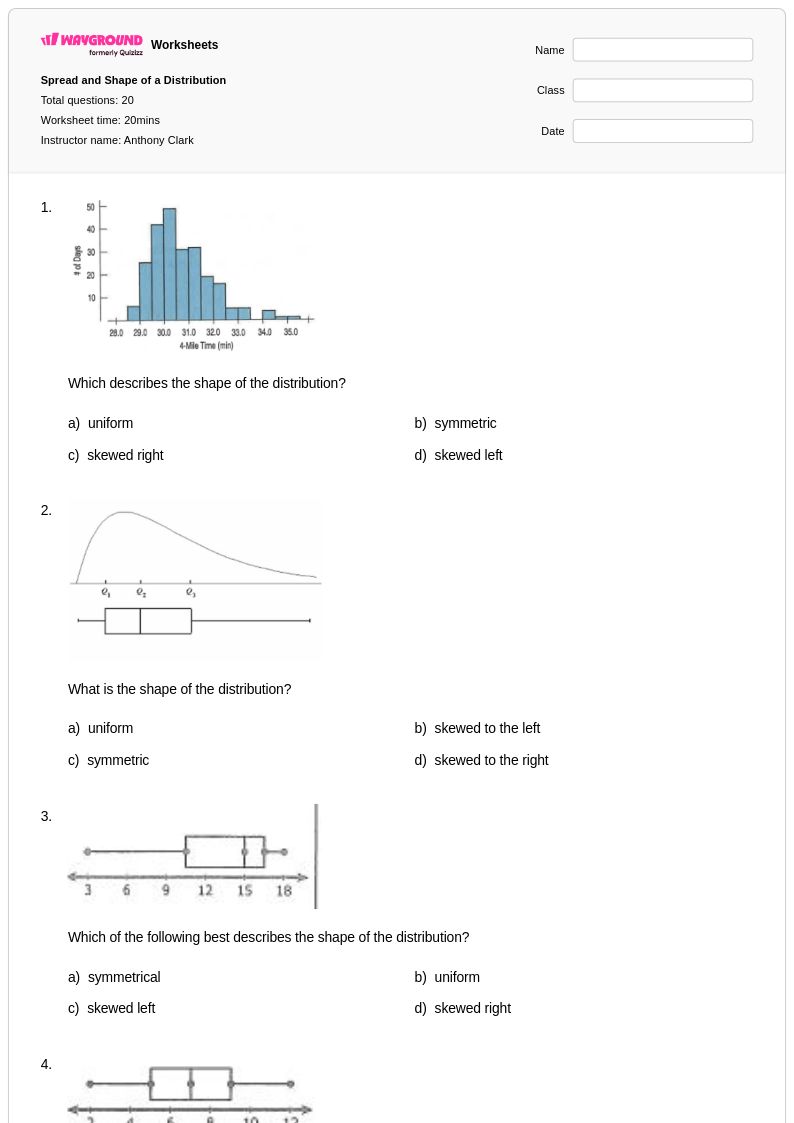
20 Hỏi
6th - Uni
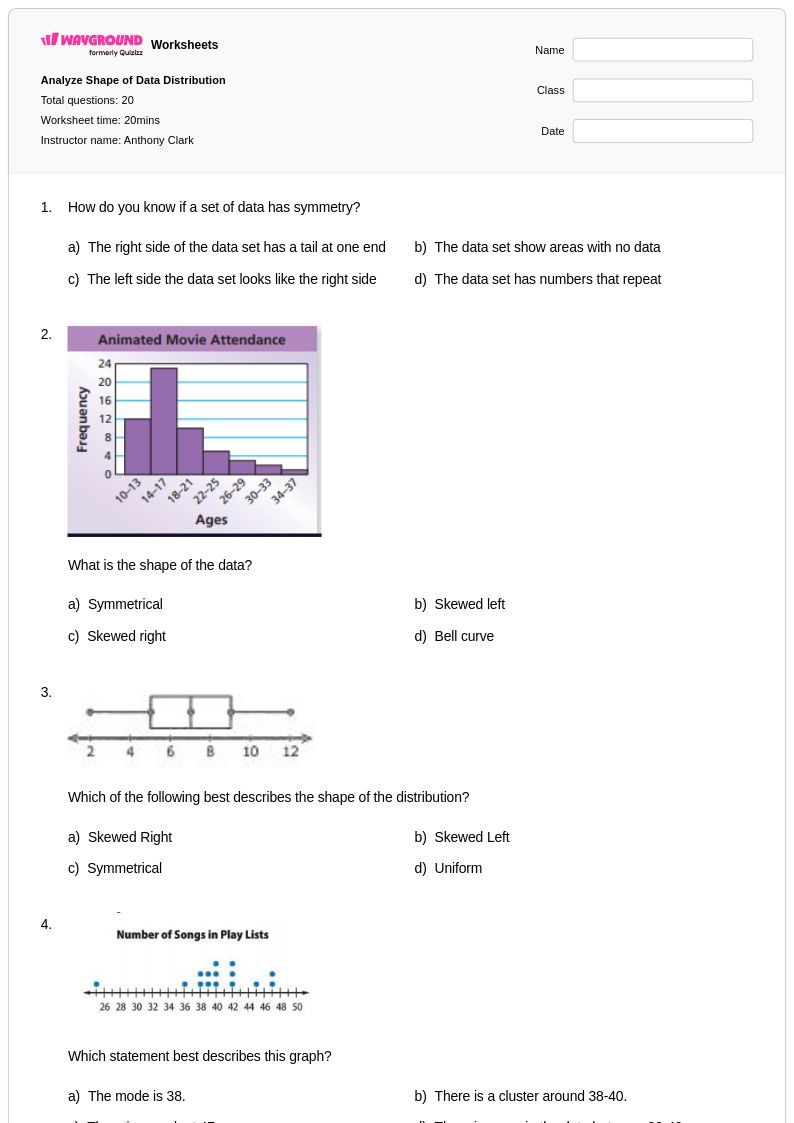
20 Hỏi
7th - Uni
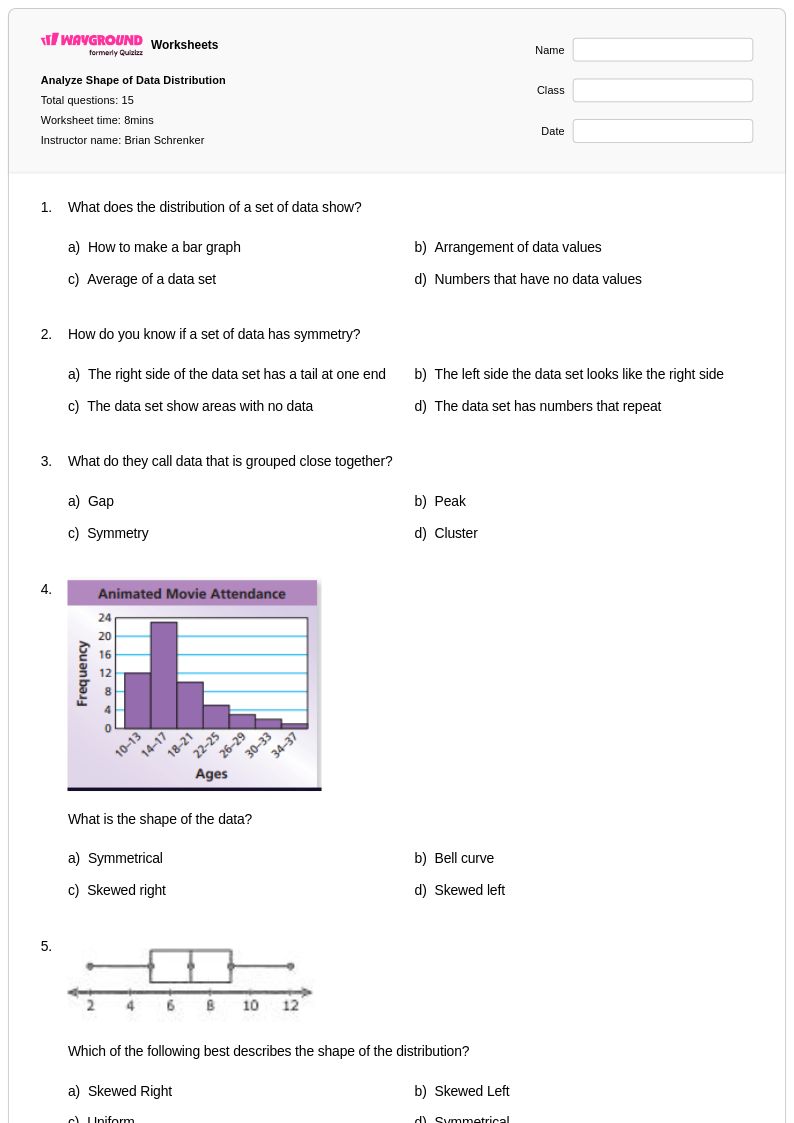
15 Hỏi
6th - 7th
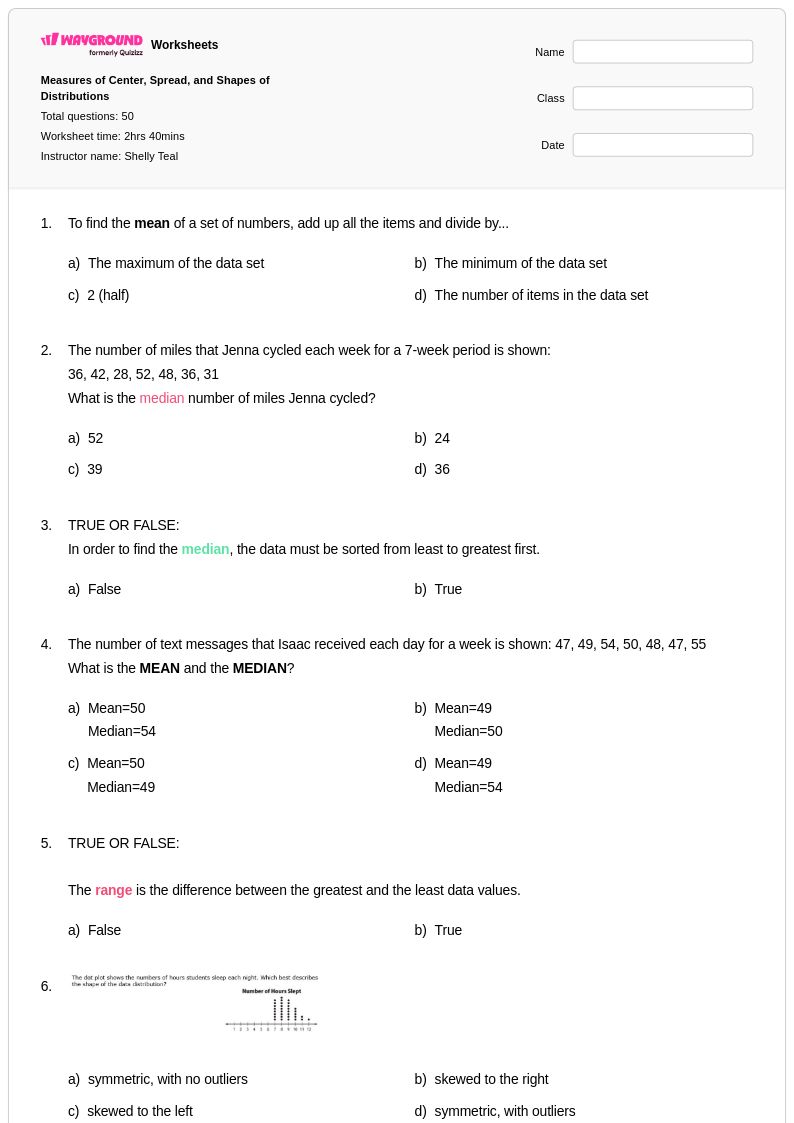
50 Hỏi
7th - 12th
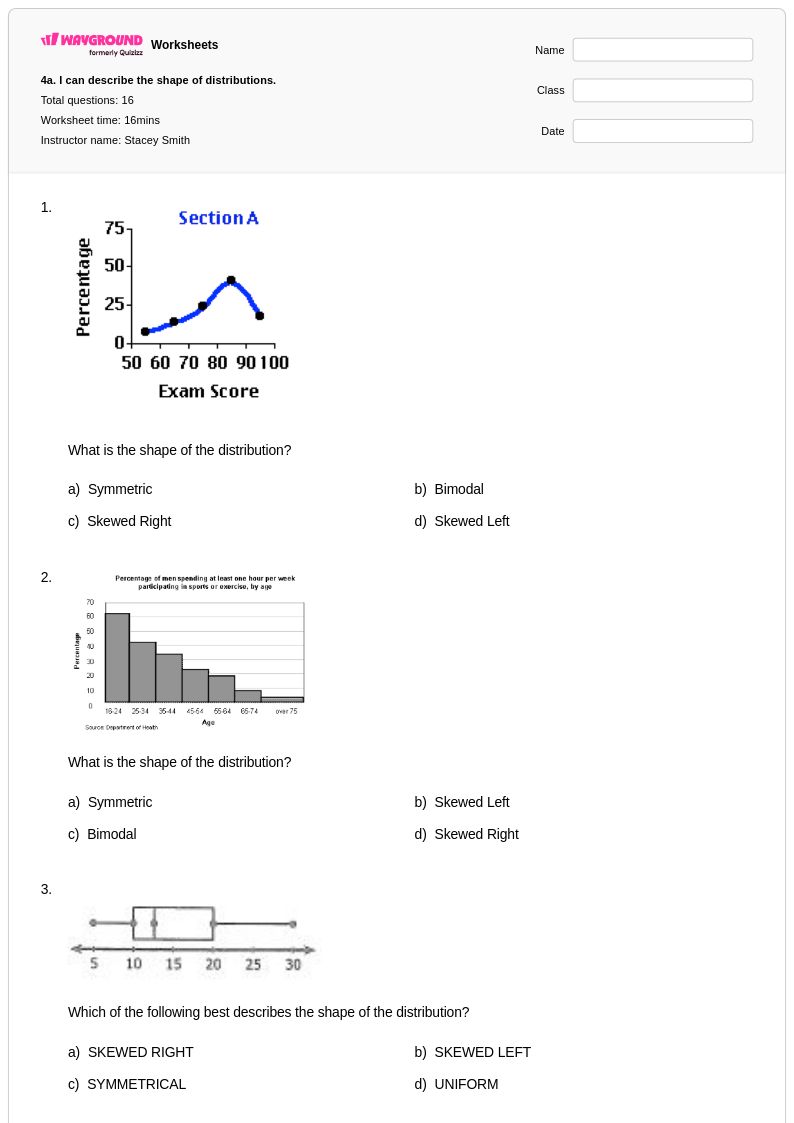
16 Hỏi
6th - 8th
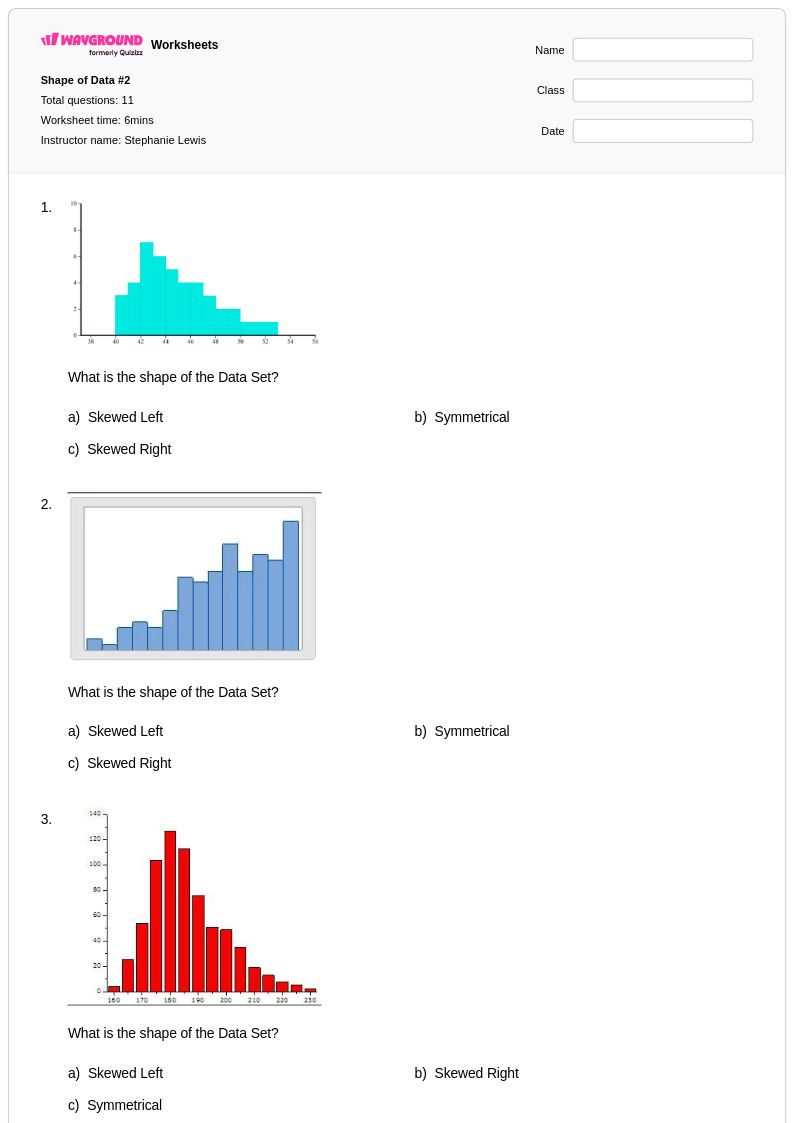
11 Hỏi
6th - 7th
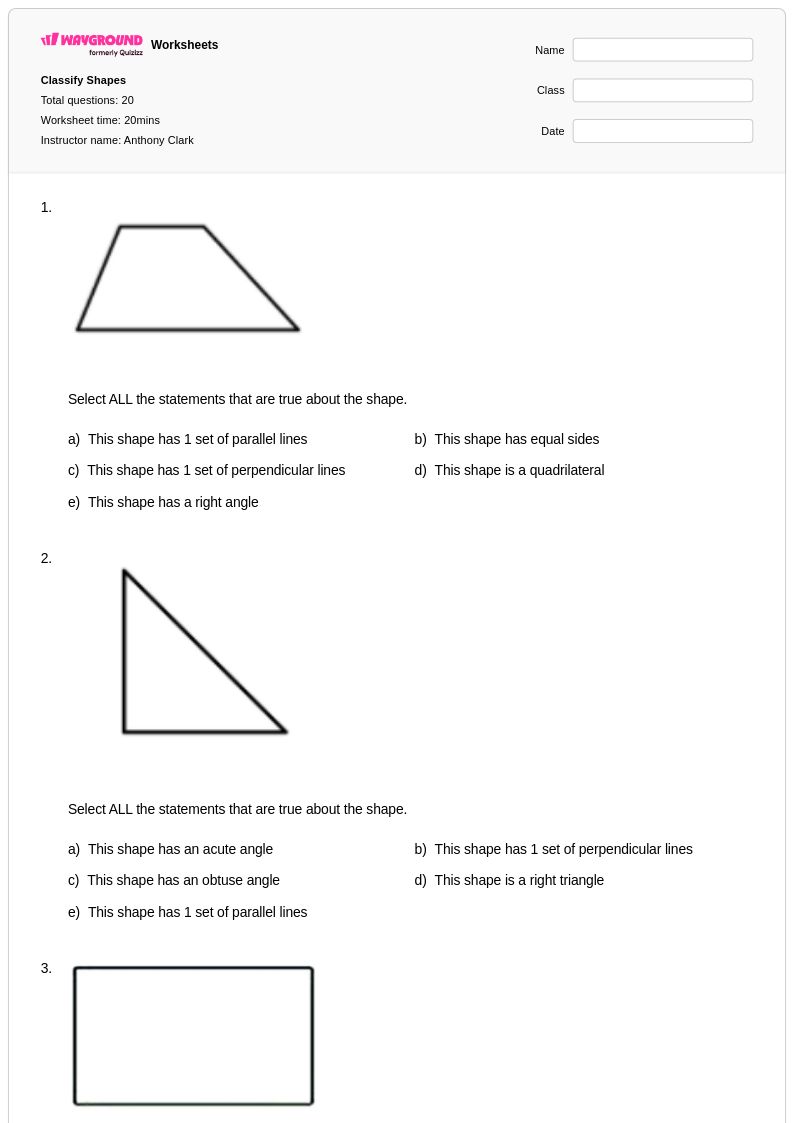
20 Hỏi
5th - Uni
20 Hỏi
6th - Uni
20 Hỏi
6th - Uni
20 Hỏi
7th
13 Hỏi
7th
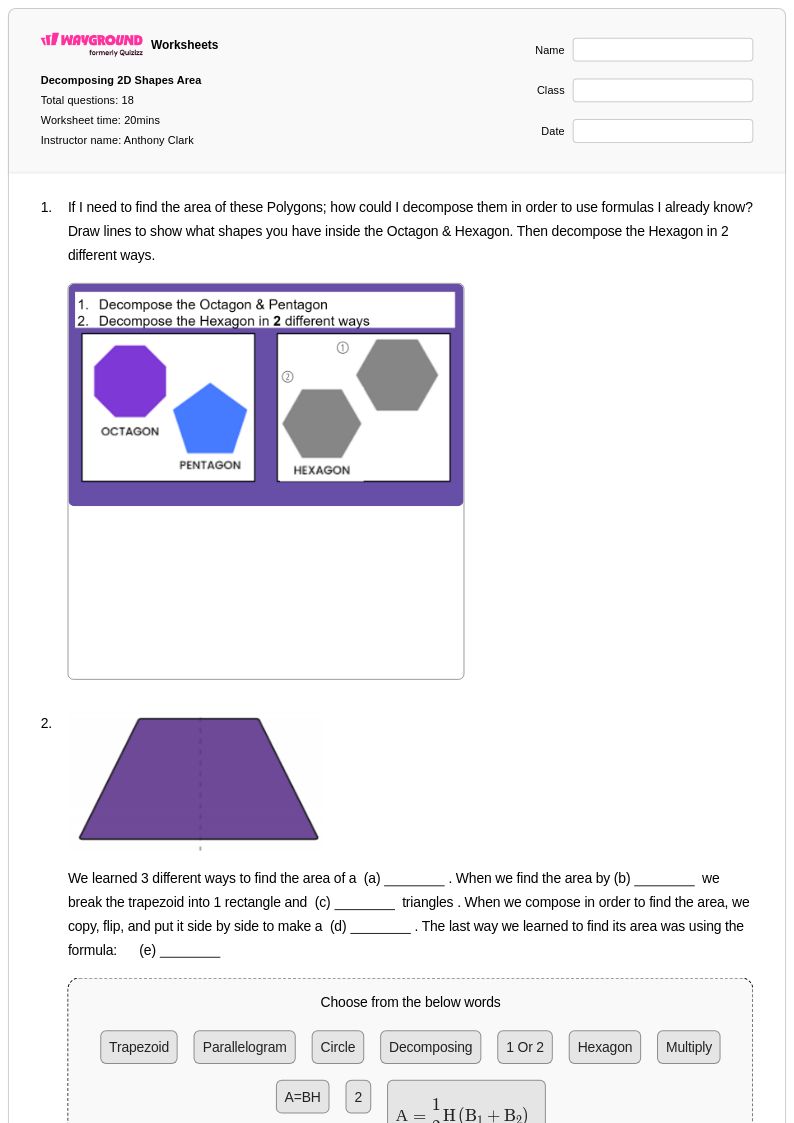
20 Hỏi
6th - Uni
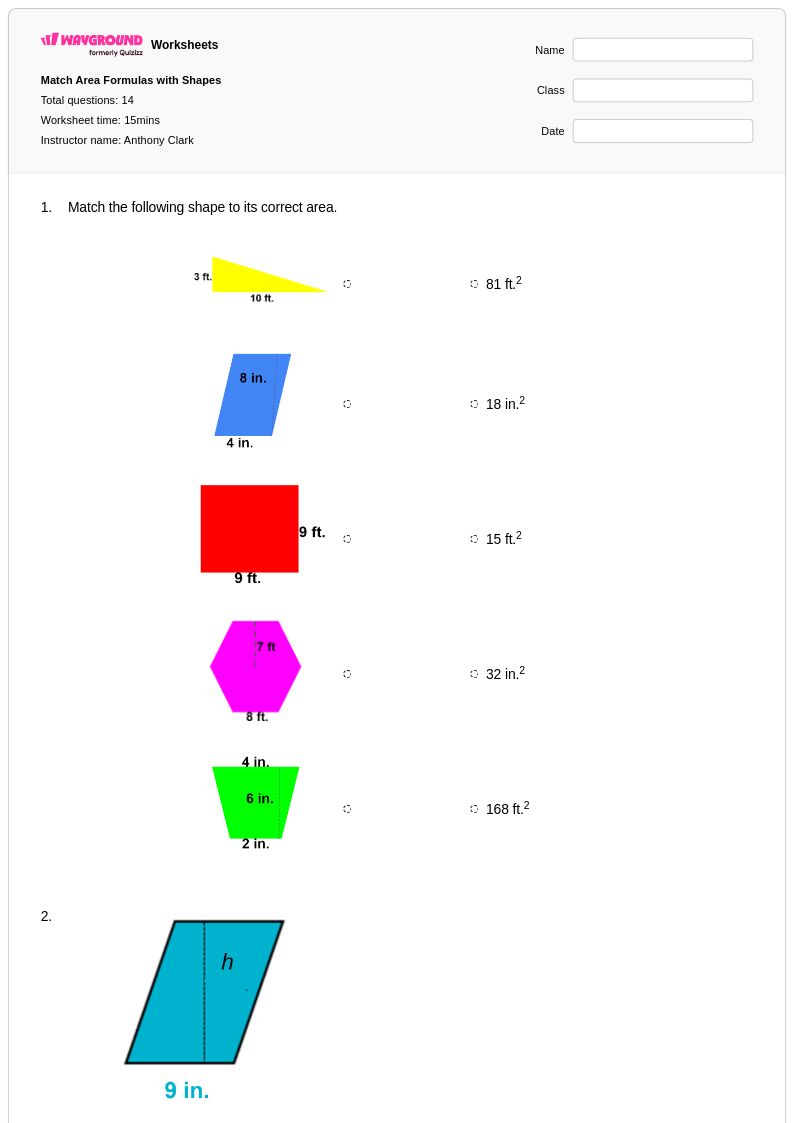
15 Hỏi
6th - Uni
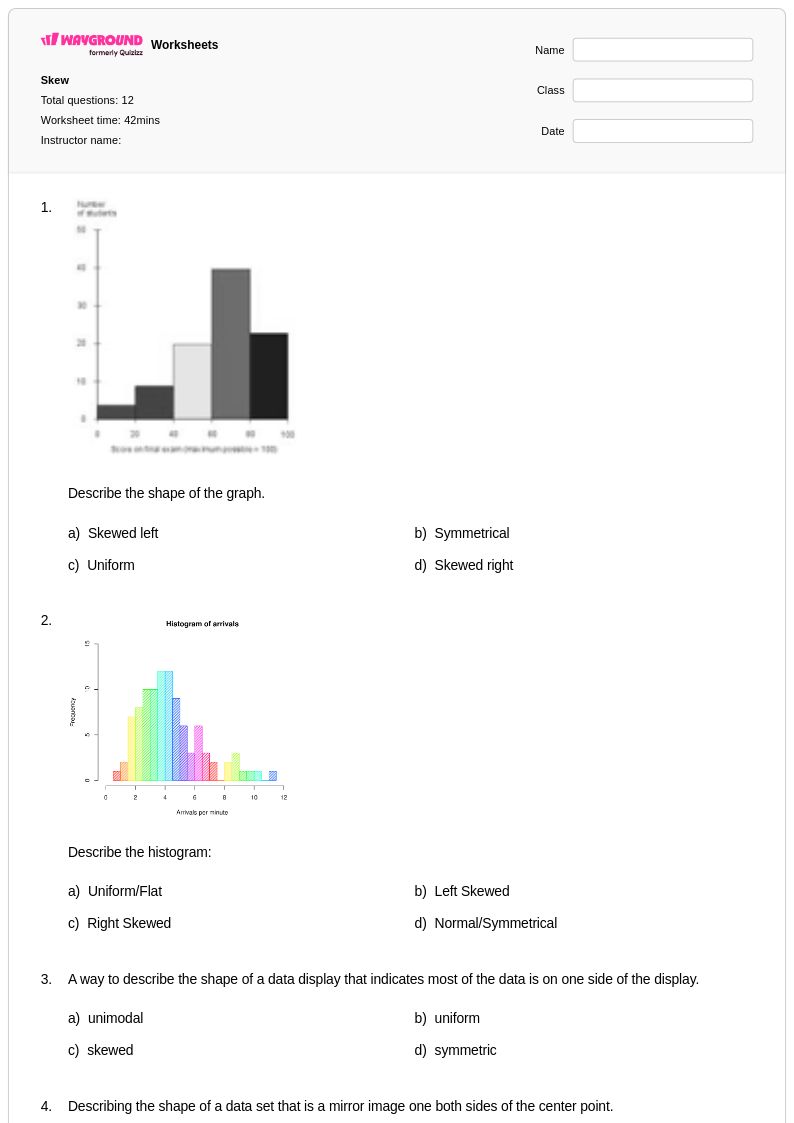
12 Hỏi
6th - 7th
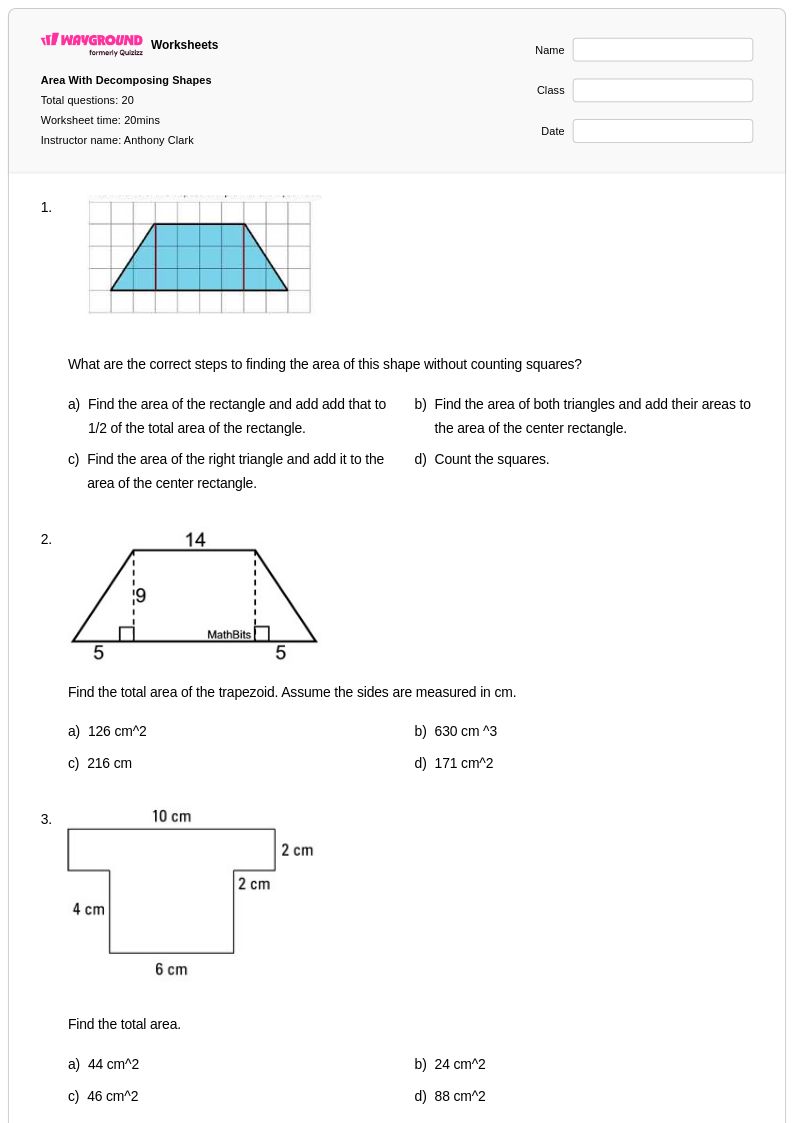
20 Hỏi
6th - Uni
Khám phá Shapes of Distributions Bảng tính theo cấp độ
Khám phá các bảng tính chủ đề khác cho grade 7
Explore printable Shapes of Distributions worksheets for Grade 7
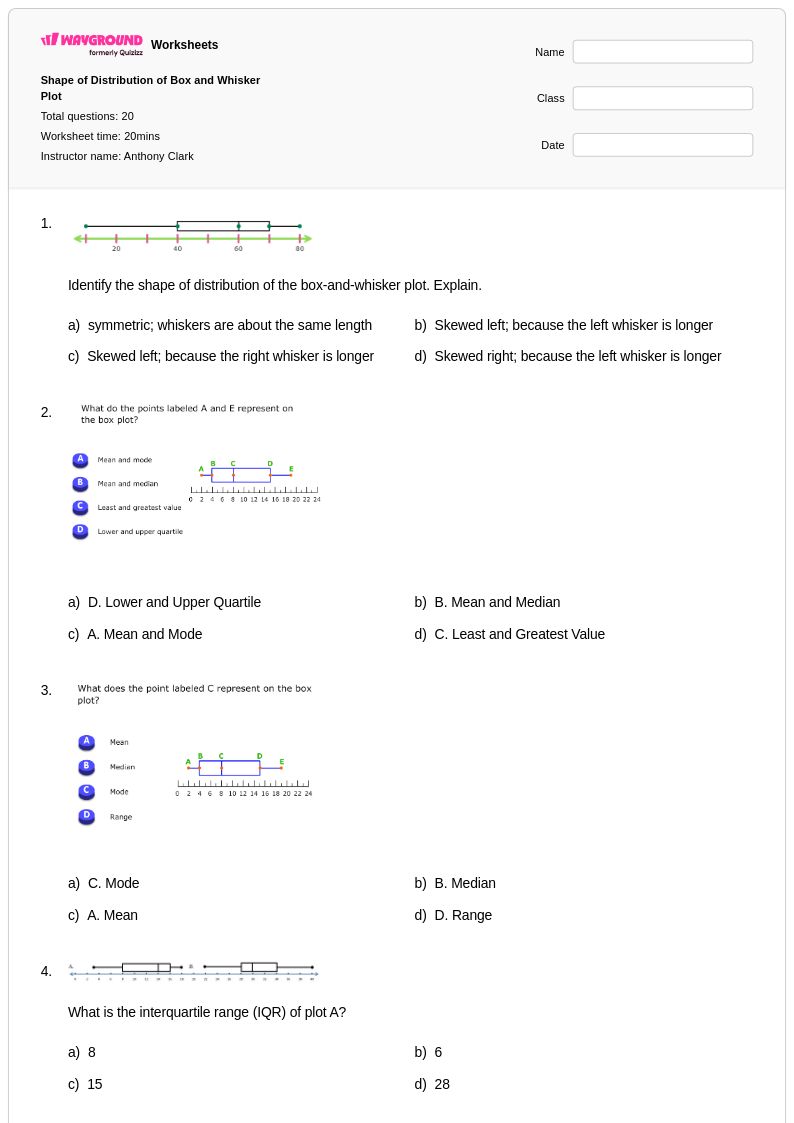
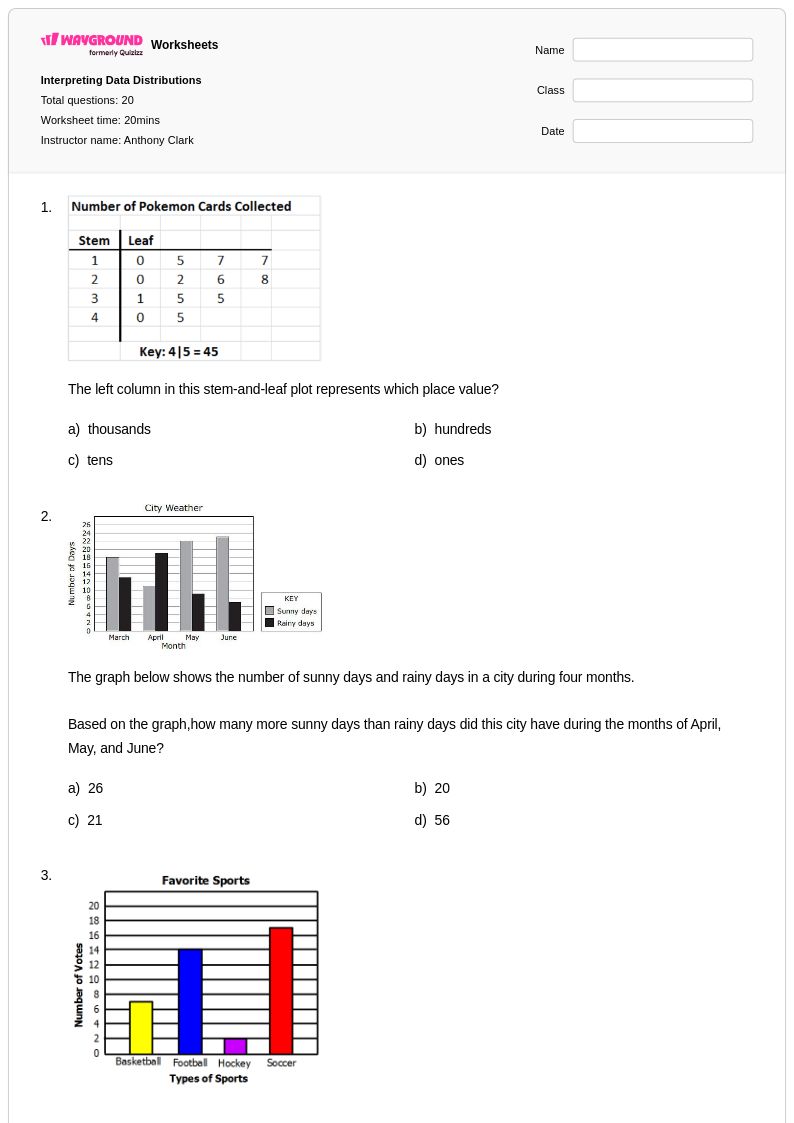
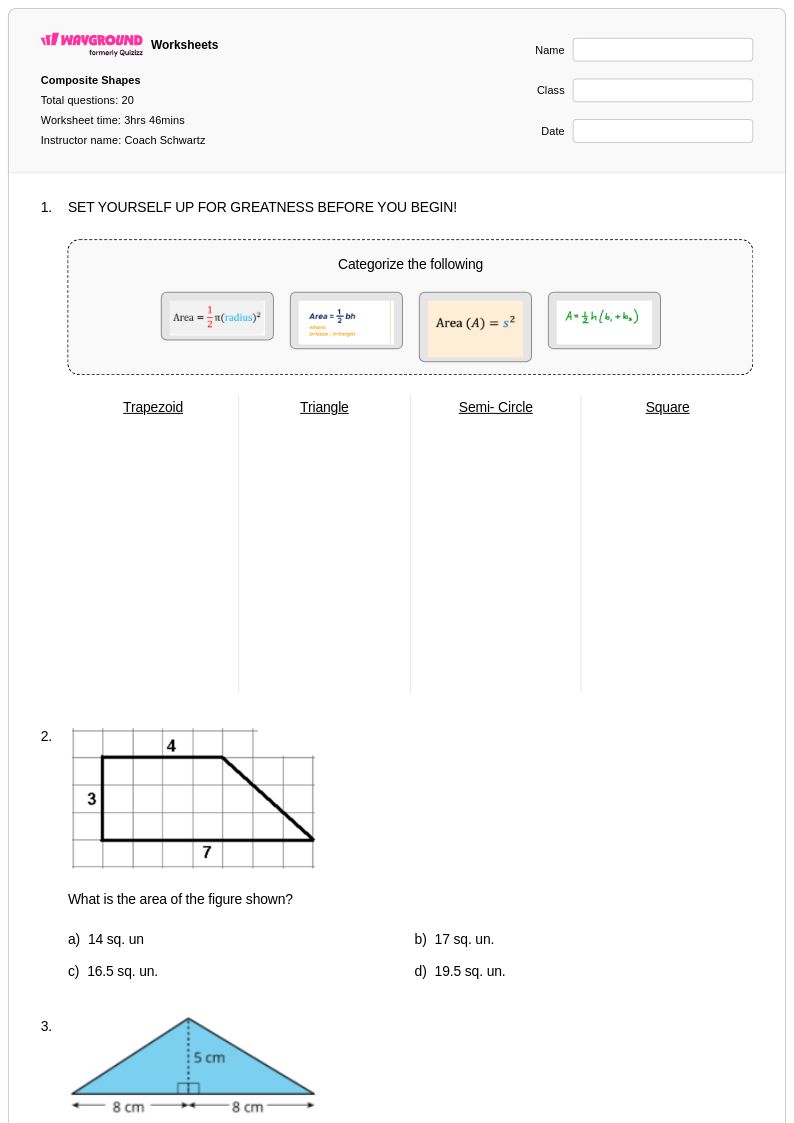
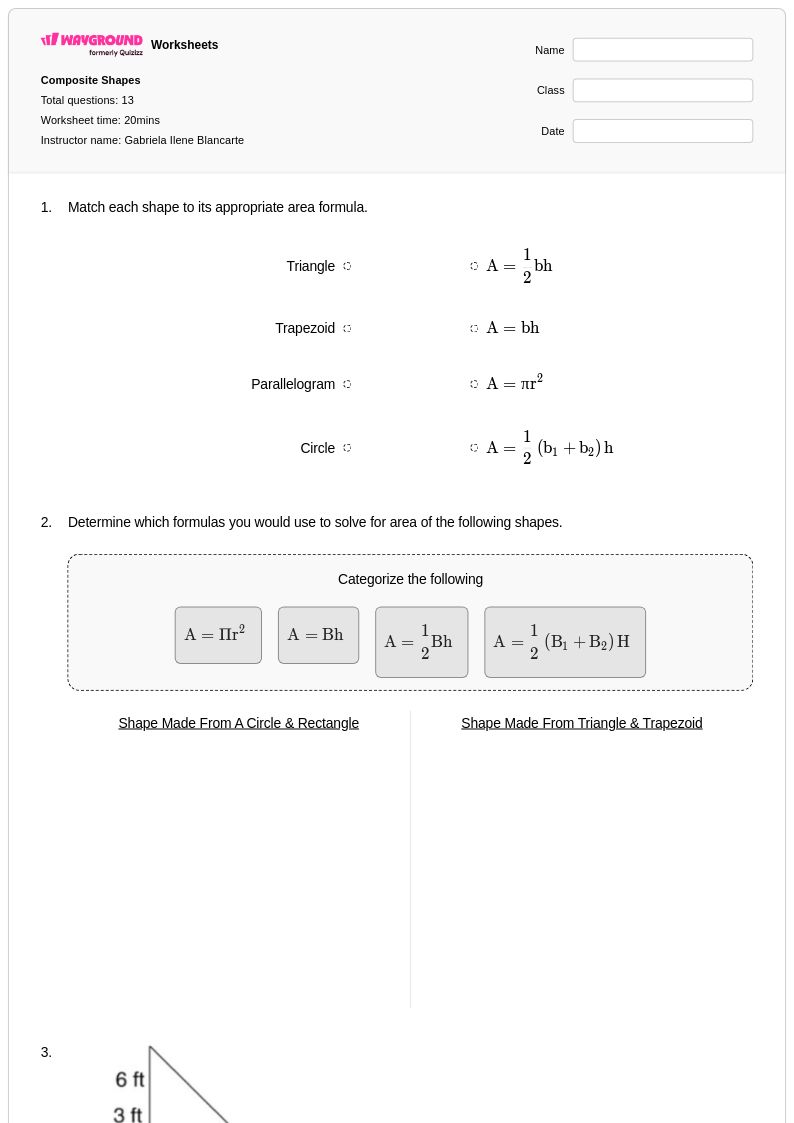
Shapes of distributions worksheets for Grade 7 students available through Wayground (formerly Quizizz) provide comprehensive practice opportunities for developing essential statistical literacy skills. These carefully crafted resources help seventh-grade students understand how data displays can reveal important patterns, including symmetric, skewed, and uniform distributions found in real-world scenarios. Students work through practice problems that require them to analyze histograms, dot plots, and box plots while identifying key characteristics such as peaks, gaps, clusters, and outliers. Each worksheet includes a detailed answer key that supports independent learning and enables students to check their understanding of distribution shapes, making these free printables valuable tools for both classroom instruction and homework assignments. The pdf format ensures easy access and consistent formatting across different devices and printing systems.
Wayground (formerly Quizizz) empowers educators with millions of teacher-created resources specifically designed to support Grade 7 probability and statistics instruction, including extensive collections focused on distribution analysis. Teachers can efficiently locate age-appropriate materials through robust search and filtering capabilities that align with curriculum standards and learning objectives. The platform's differentiation tools allow instructors to customize worksheets based on individual student needs, whether for remediation of fundamental concepts or enrichment activities that challenge advanced learners. These versatile resources are available in both printable and digital formats, including downloadable pdf files, enabling seamless integration into diverse teaching environments and learning management systems. This flexibility supports comprehensive lesson planning while providing targeted skill practice that helps students master the critical thinking required to interpret and analyze various shapes of statistical distributions.
FAQs
What grade level are these worksheets for?
What's the difference between teaching distribution shapes in Grade 6 vs. Grade 7?
How do I teach students to identify distribution shapes from a box plot?
What are common misconceptions for 7th graders analyzing distributions?
How can I use this Grade 7 worksheet with my students?
How can I differentiate this statistics practice for a mixed-ability 7th-grade class?