Enhance Class 10 physics learning with Wayground's comprehensive collection of free graph worksheets and printables, featuring practice problems and answer keys to help students master data visualization and interpretation skills.
Class 10 physics graphs worksheets available through Wayground (formerly Quizizz) provide students with comprehensive practice in interpreting, analyzing, and creating various types of scientific graphs essential for physics understanding. These carefully designed worksheets strengthen critical skills including reading data from position-time graphs, velocity-time graphs, and acceleration-time graphs, while helping students master concepts like slope interpretation, area calculations, and motion analysis. Students engage with practice problems that cover graphical representation of kinematic equations, force diagrams, and energy transformations, with each worksheet including detailed answer keys to support independent learning and self-assessment. The collection offers free printables in convenient pdf format, allowing educators to seamlessly integrate graphing practice into classroom instruction and homework assignments.
Wayground's extensive library of teacher-created physics graphing resources serves educators with millions of expertly developed worksheets that align with curriculum standards and support diverse learning needs in Class 10 physics classrooms. The platform's robust search and filtering capabilities enable teachers to quickly locate specific graph types, difficulty levels, and concept focuses, while built-in differentiation tools allow for customized assignments that meet individual student requirements. These versatile resources are available in both printable pdf format for traditional classroom use and digital formats for technology-enhanced learning environments, providing flexibility for lesson planning, targeted remediation, and skill enrichment activities. Teachers can efficiently modify existing worksheets or combine multiple resources to create comprehensive practice sets that reinforce graphical analysis skills and deepen students' conceptual understanding of physics principles through visual representation.
FAQs
How do I teach students to read and interpret physics graphs?
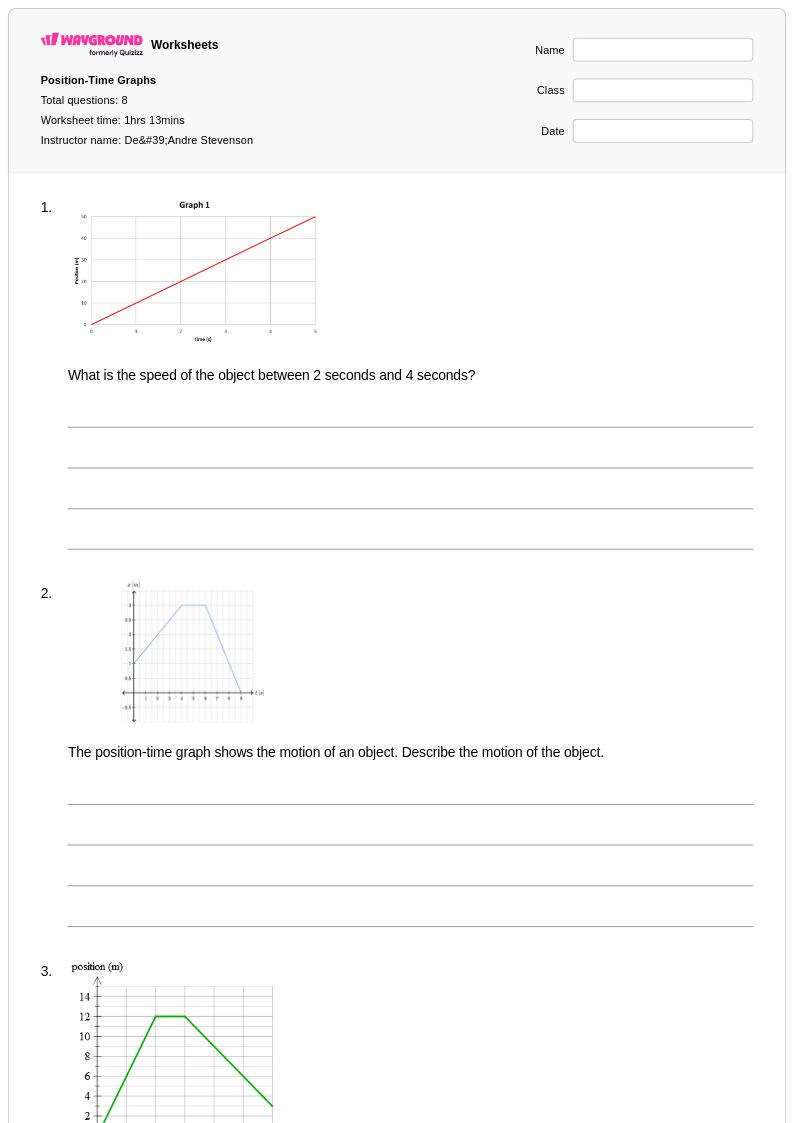
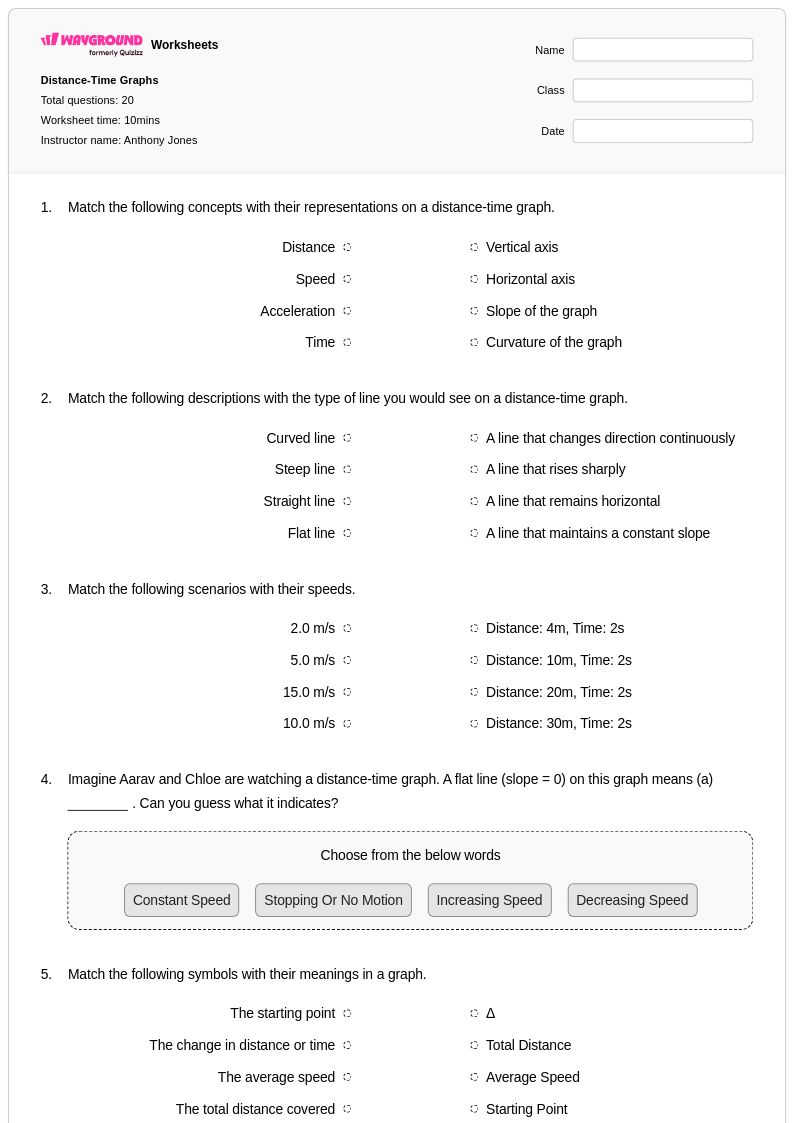
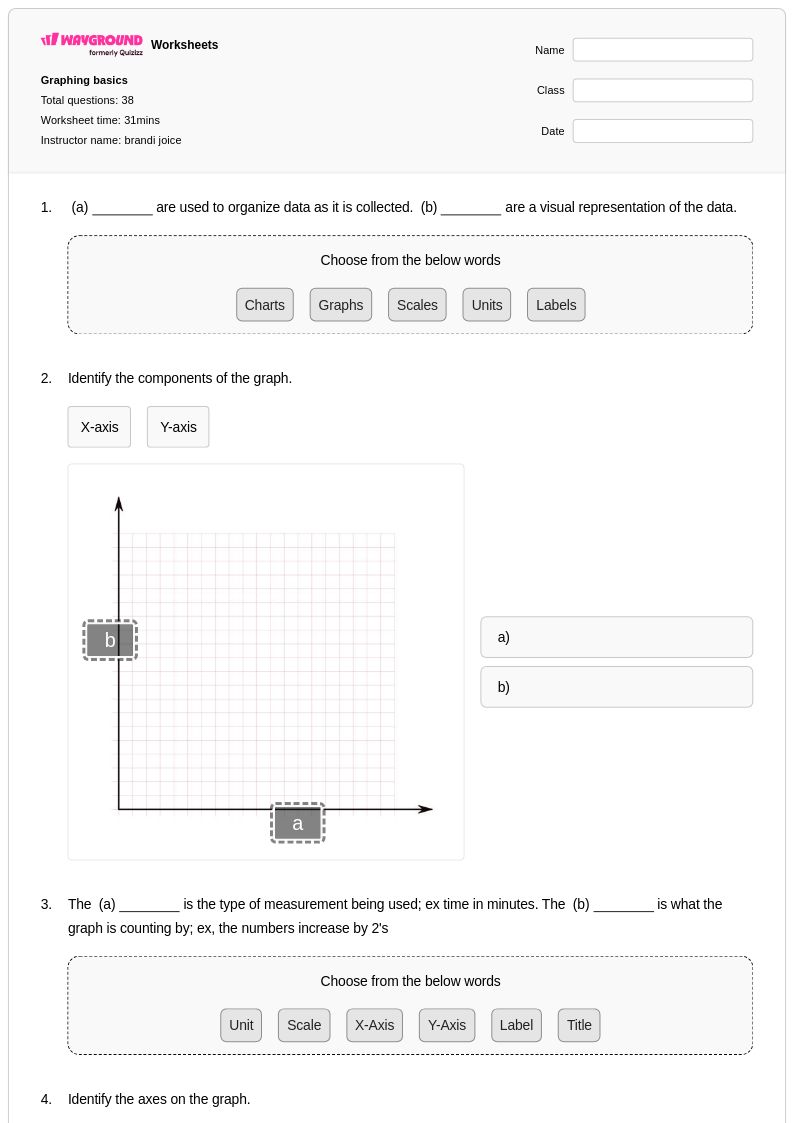
Start by teaching students to identify and label all graph components: axes, units, scale, and title. Then guide students through extracting specific values by reading coordinates, calculating slope as a rate of change, and identifying patterns such as linear, curved, or flat regions. Worked examples using position-time and velocity-time graphs are especially effective because they connect abstract motion concepts to visible trends students can reason through step by step.
What types of graphs do students need to master in physics?
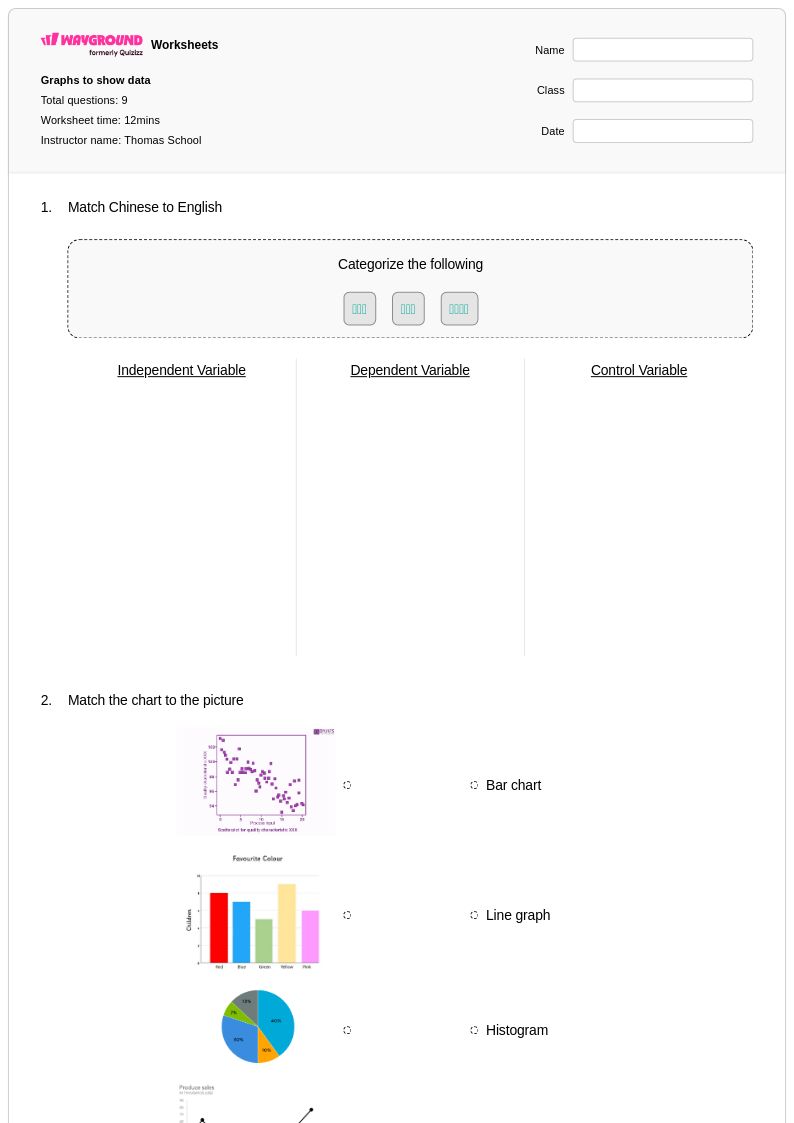
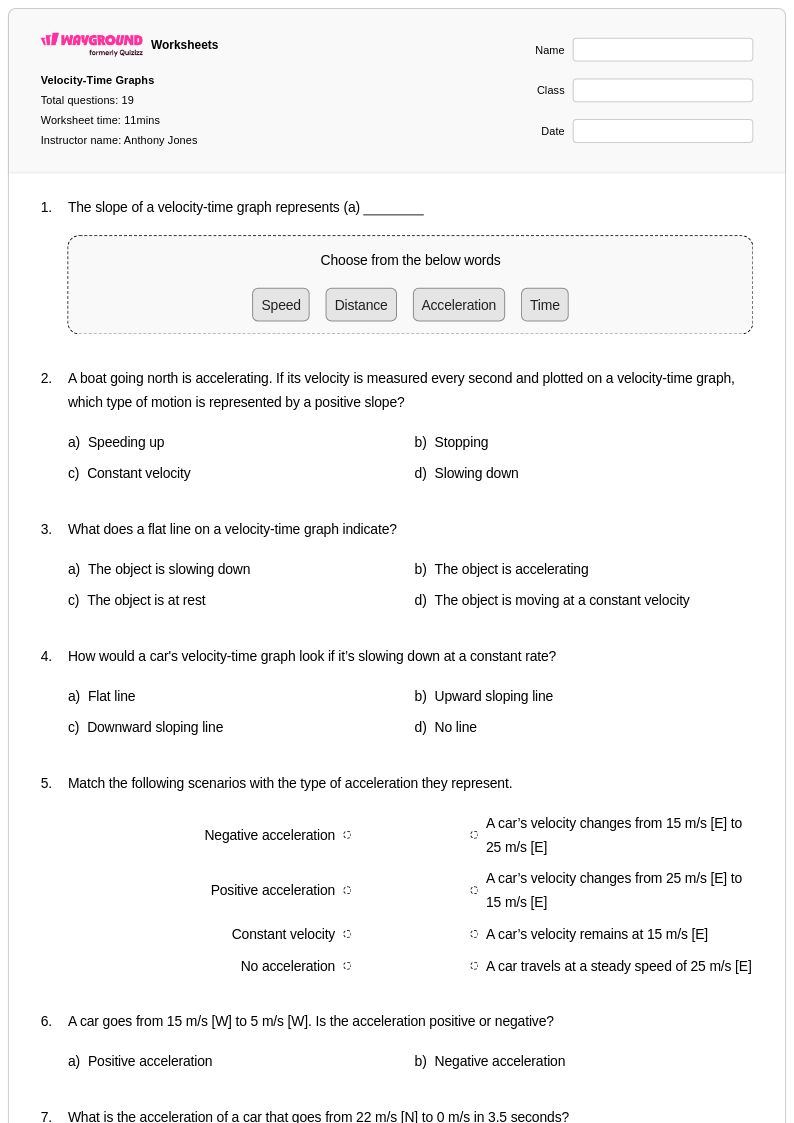
Physics students need to work fluently with position-time graphs, velocity-time graphs, acceleration-time diagrams, and force versus displacement plots. Each graph type encodes different physical relationships, so students must learn not only how to read values but also how to interpret slope and area under the curve as meaningful physical quantities. Building familiarity across all four types ensures students can navigate graphical data in mechanics, waves, and other core physics domains.
What practice exercises help students get better at analyzing physics graphs?
Effective practice exercises include reading specific coordinate values, calculating slope between two points, sketching a matching graph from a written description of motion, and translating between a graph and its corresponding equation. Multi-step problems that ask students to connect two graph types, such as deriving a velocity-time graph from a position-time graph, build the deeper analytical skills assessed on physics exams. Varied problem formats prevent rote memorization and push students toward genuine understanding.
What mistakes do students commonly make when interpreting physics graphs?
The most persistent misconception is treating the shape of a graph as a literal picture of motion, for example assuming a curved position-time graph means the object moved in a curved path. Students also frequently confuse slope with the value of a point, misread scales when intervals are not labeled on every gridline, and ignore units when calculating rates. Explicitly addressing these errors before independent practice significantly reduces persistent misunderstandings.
How can I use Wayground's graphs worksheets in my classroom?
Wayground's physics graphs worksheets are available as printable PDFs for traditional classroom use and in digital formats for technology-integrated learning environments, giving teachers flexibility across instructional settings. Teachers can assign them as direct instruction support, independent practice, homework, or review, and can host any worksheet as a live quiz on Wayground for real-time student participation. Complete answer keys are included with every worksheet, making formative assessment and self-correction straightforward without additional preparation time.
How do I differentiate physics graph instruction for students at different skill levels?
For struggling learners, begin with single-variable graphs that have clearly labeled scales and guide students through a structured reading protocol before introducing calculation tasks. Advanced students benefit from open-ended problems that require them to construct graphs from raw data, identify anomalies, or compare two graph types representing the same physical event. On Wayground, teachers can apply individual accommodations such as read aloud, reduced answer choices, and extended time to specific students, ensuring each learner engages with graphical content at an appropriate level of challenge.