
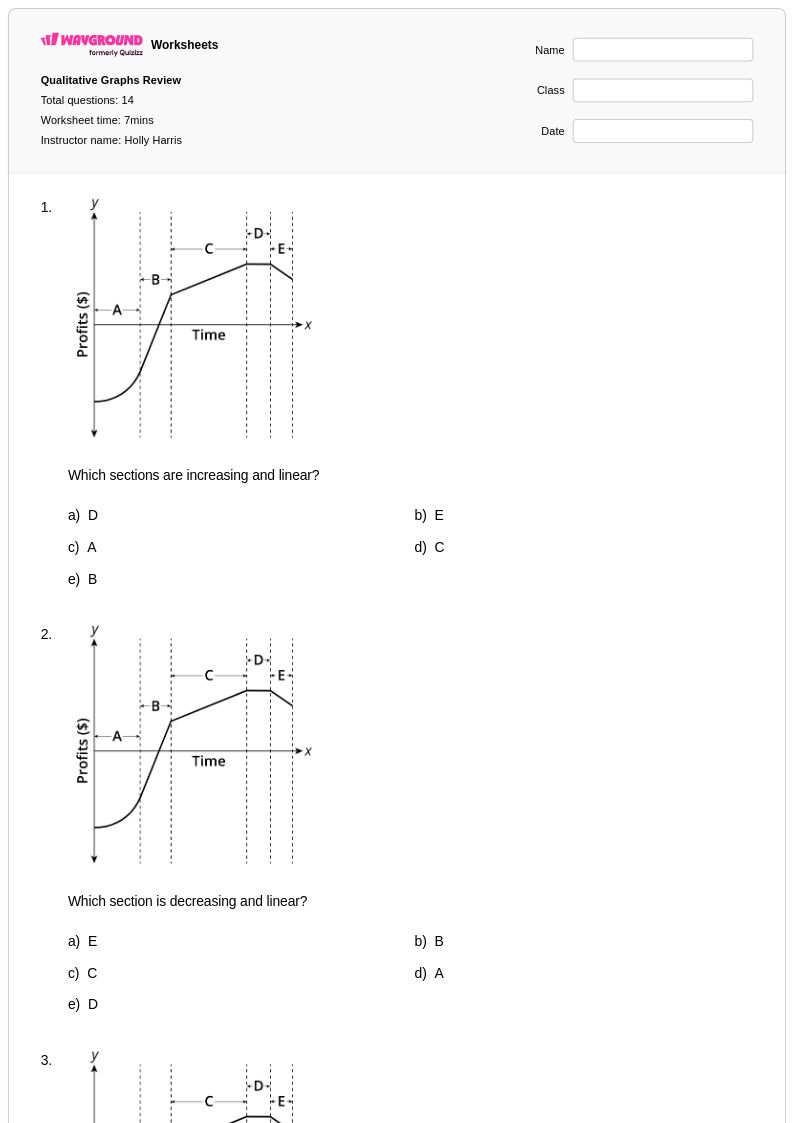
14 Q
8th
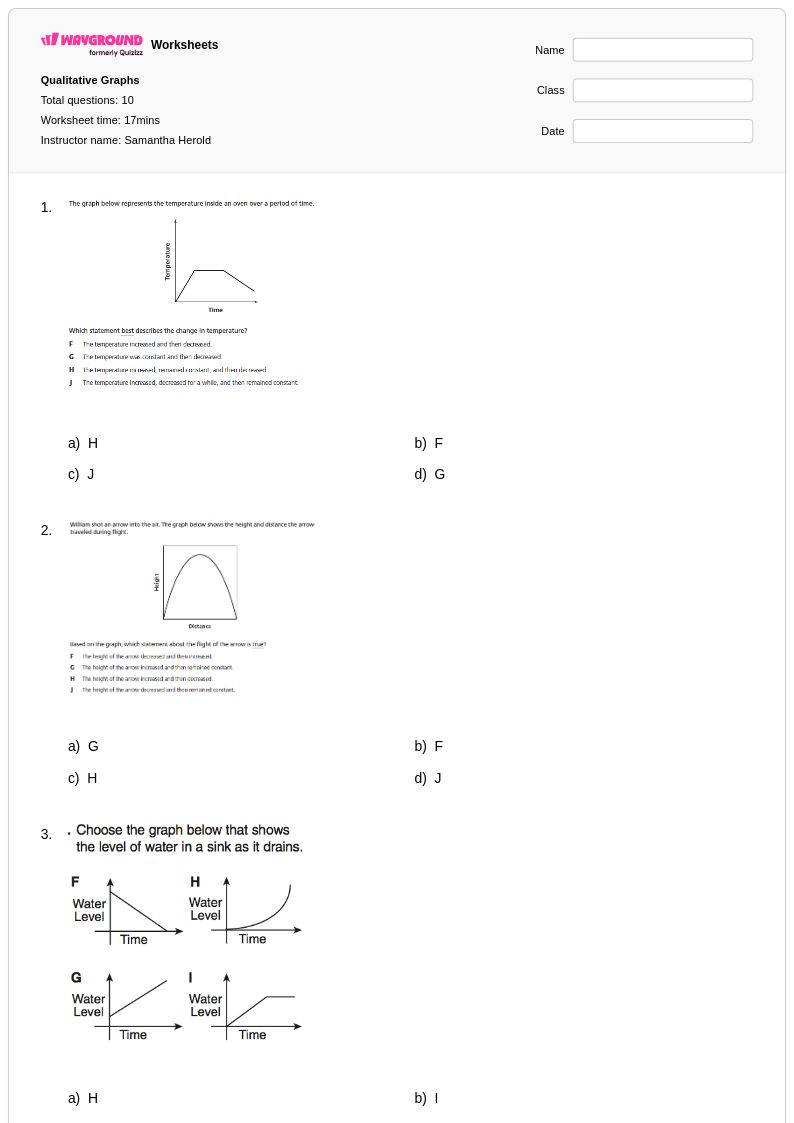
10 Q
8th
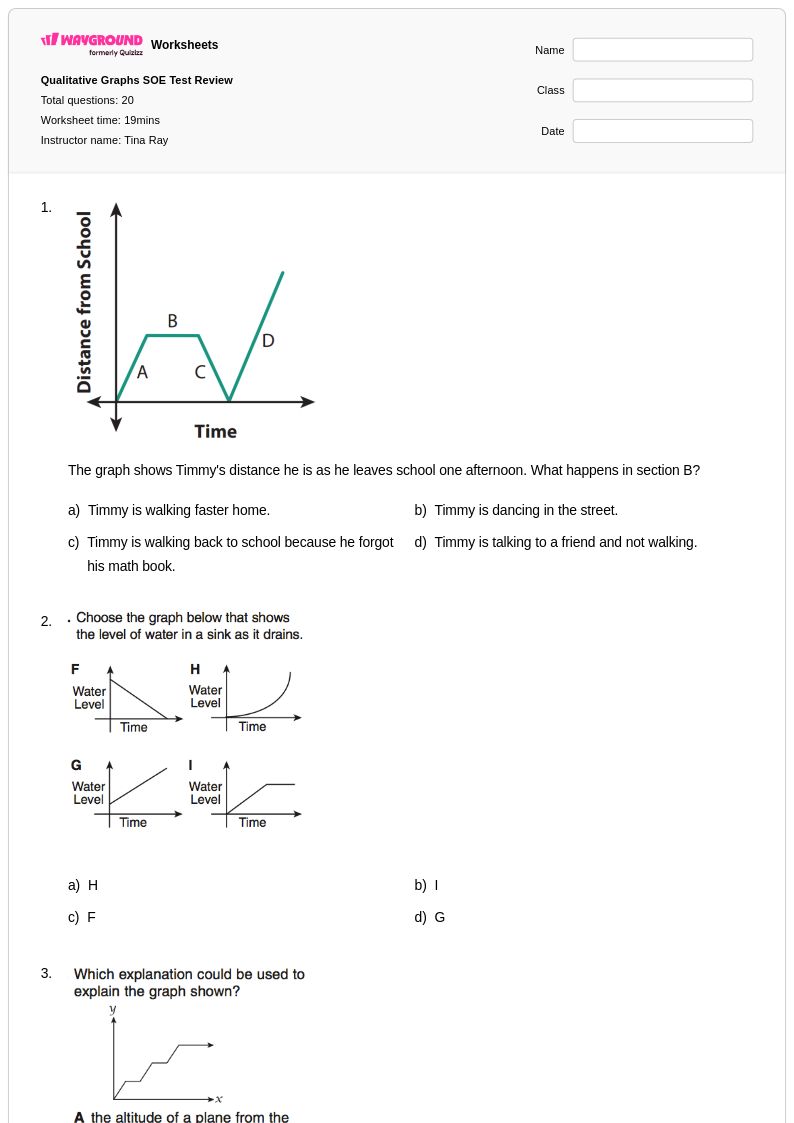
20 Q
8th
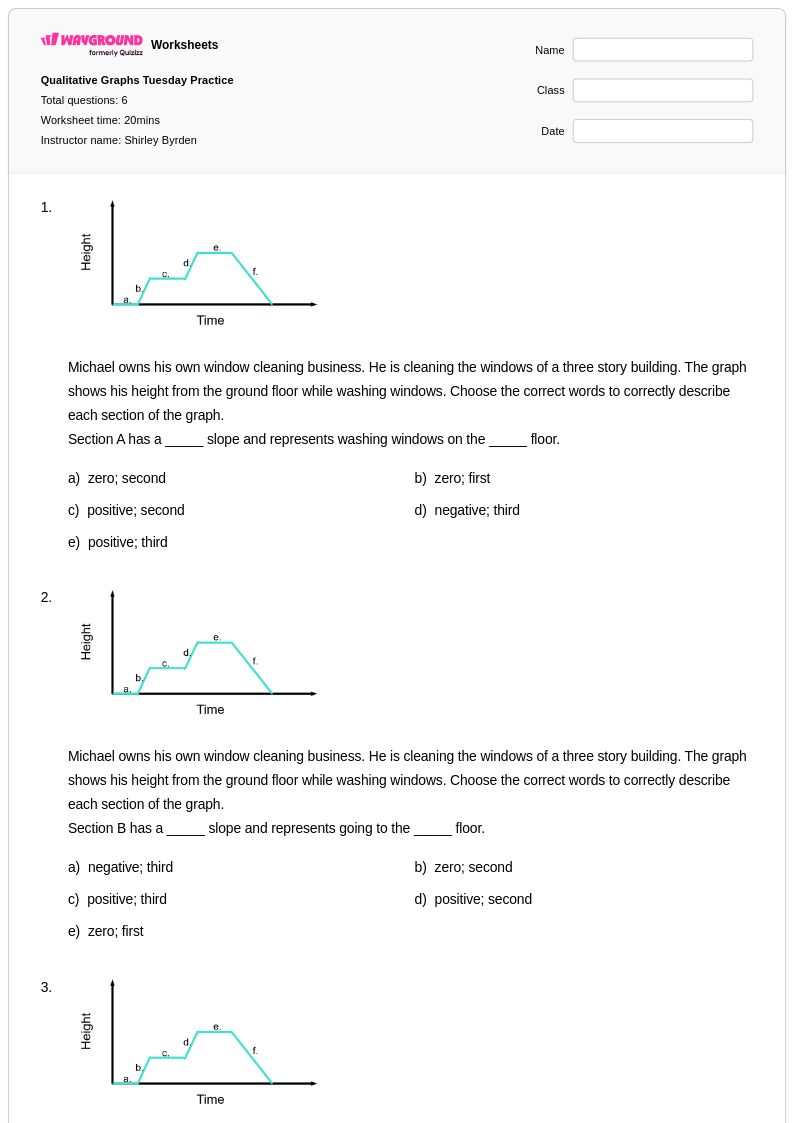
6 Q
8th
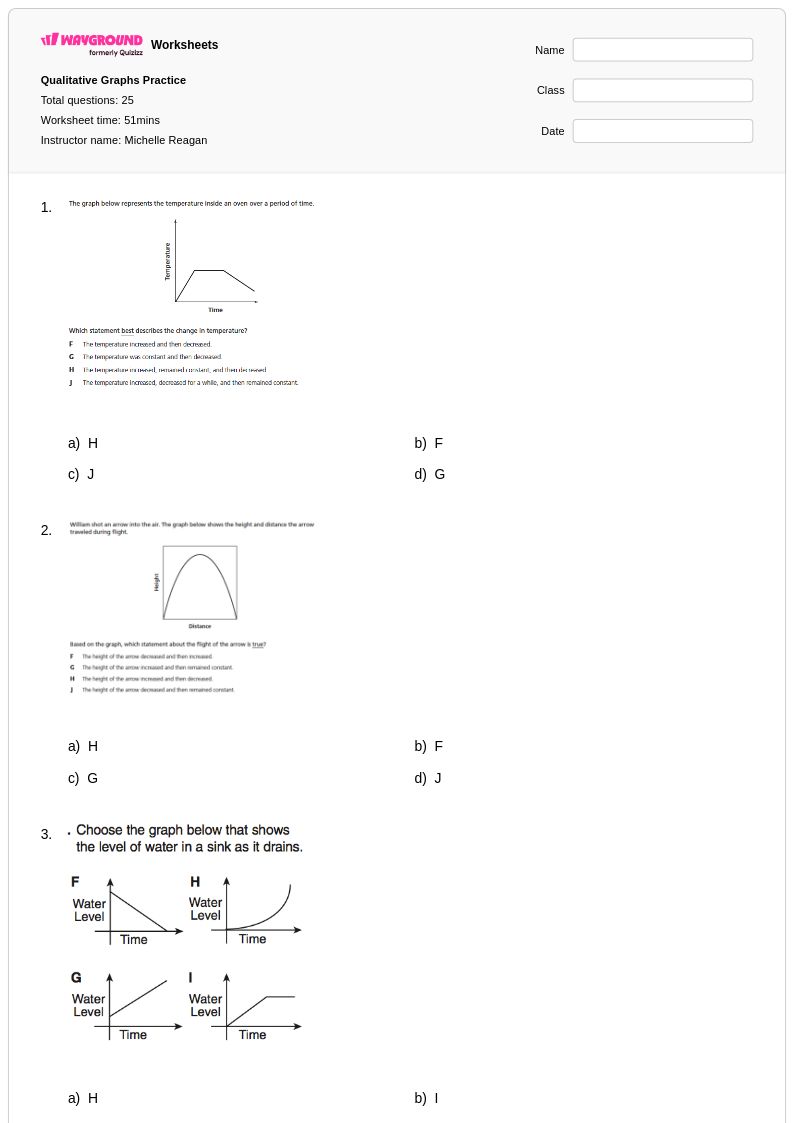
25 Q
8th - 9th
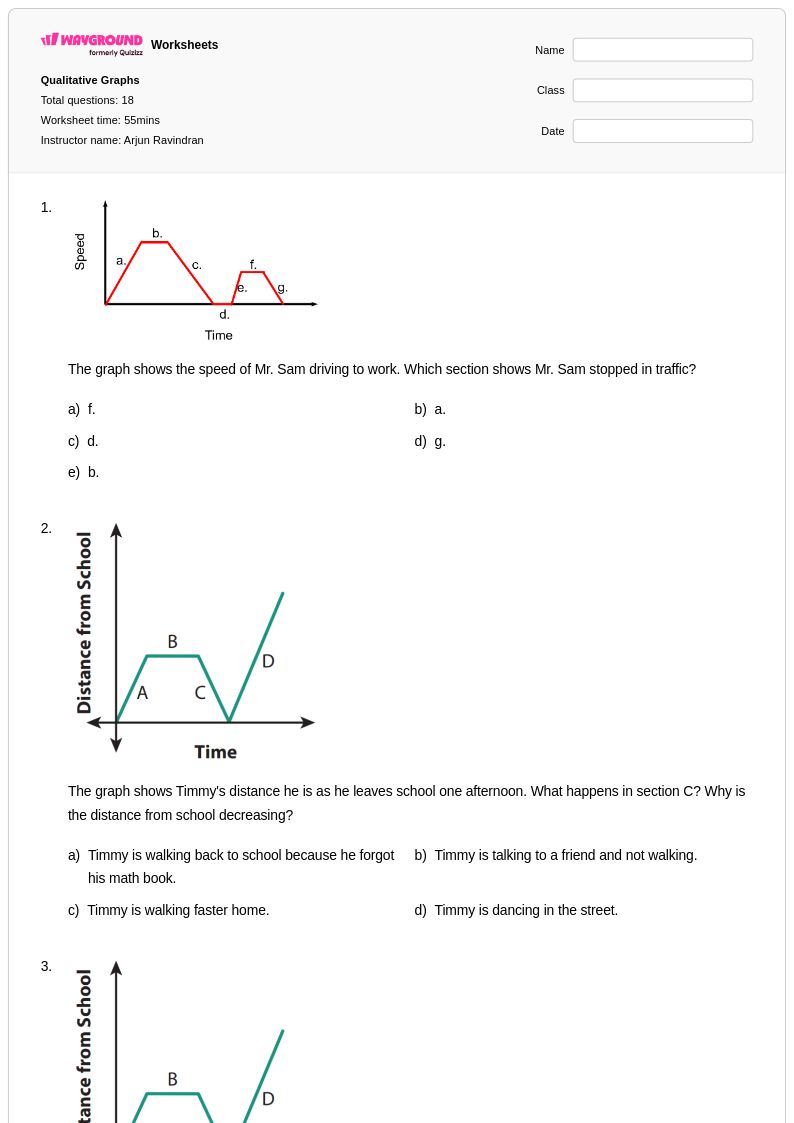
18 Q
8th
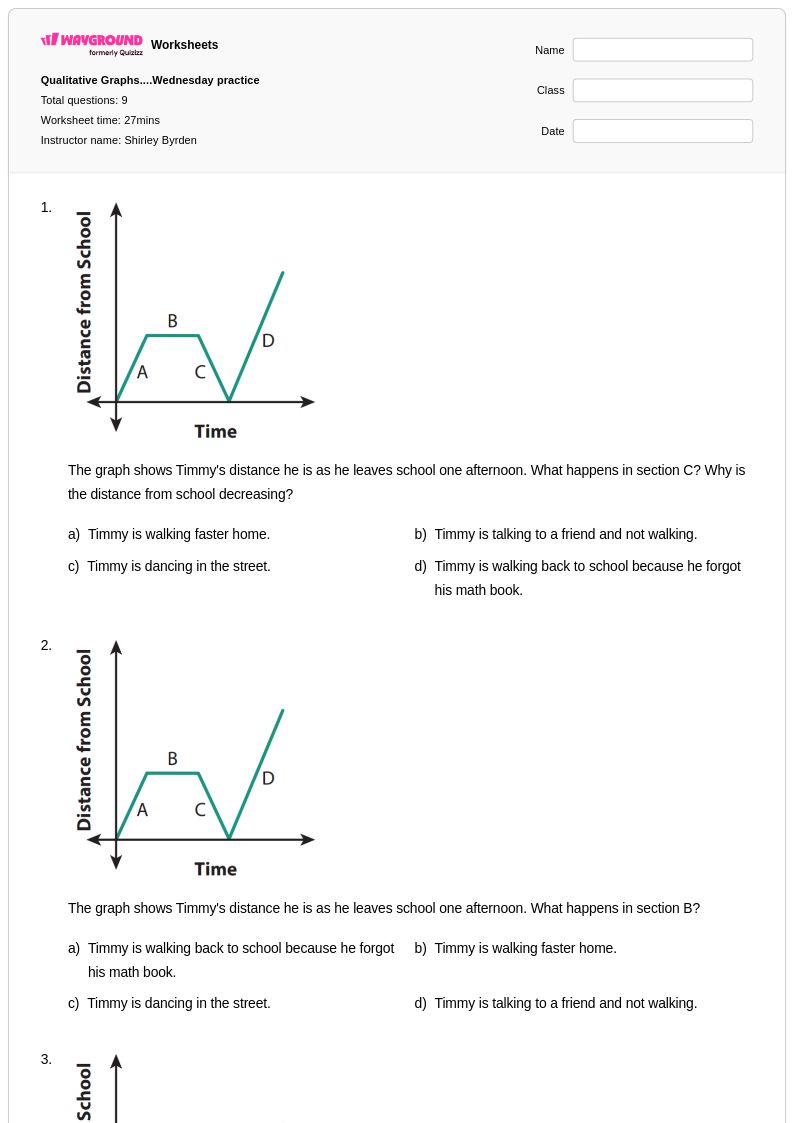
9 Q
8th
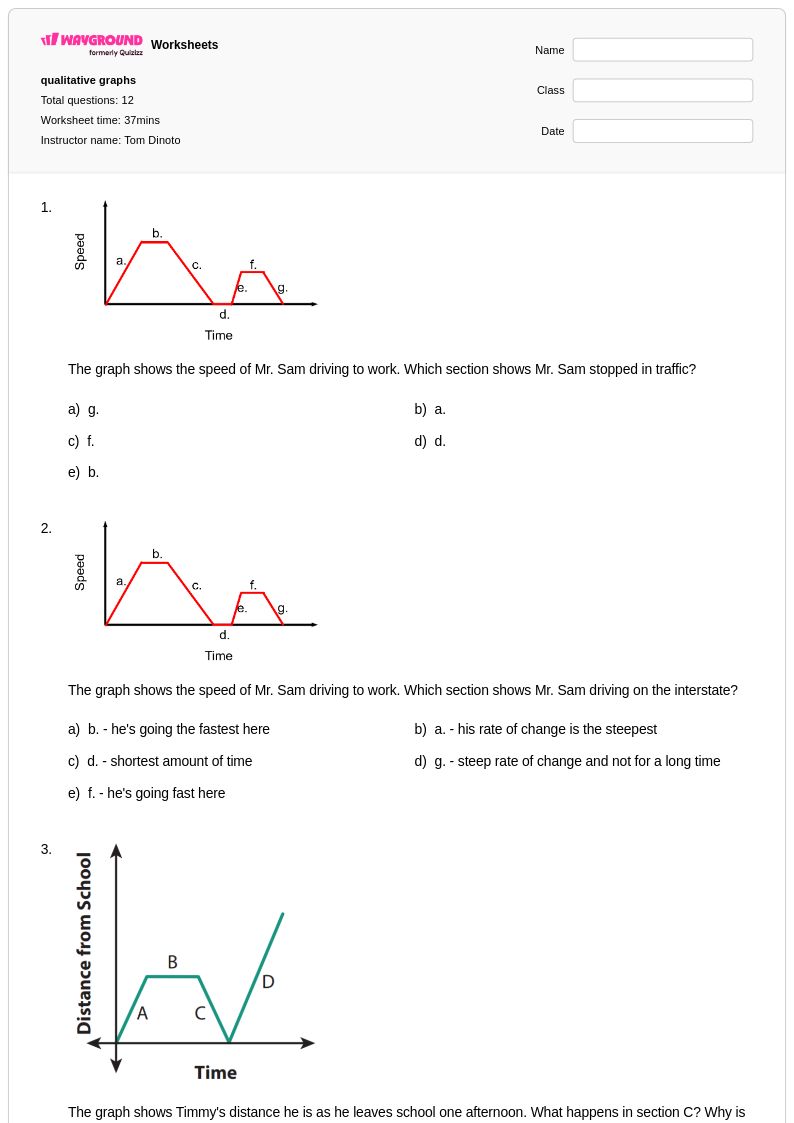
12 Q
8th
19 Q
8th
10 Q
8th
10 Q
8th
23 Q
9th
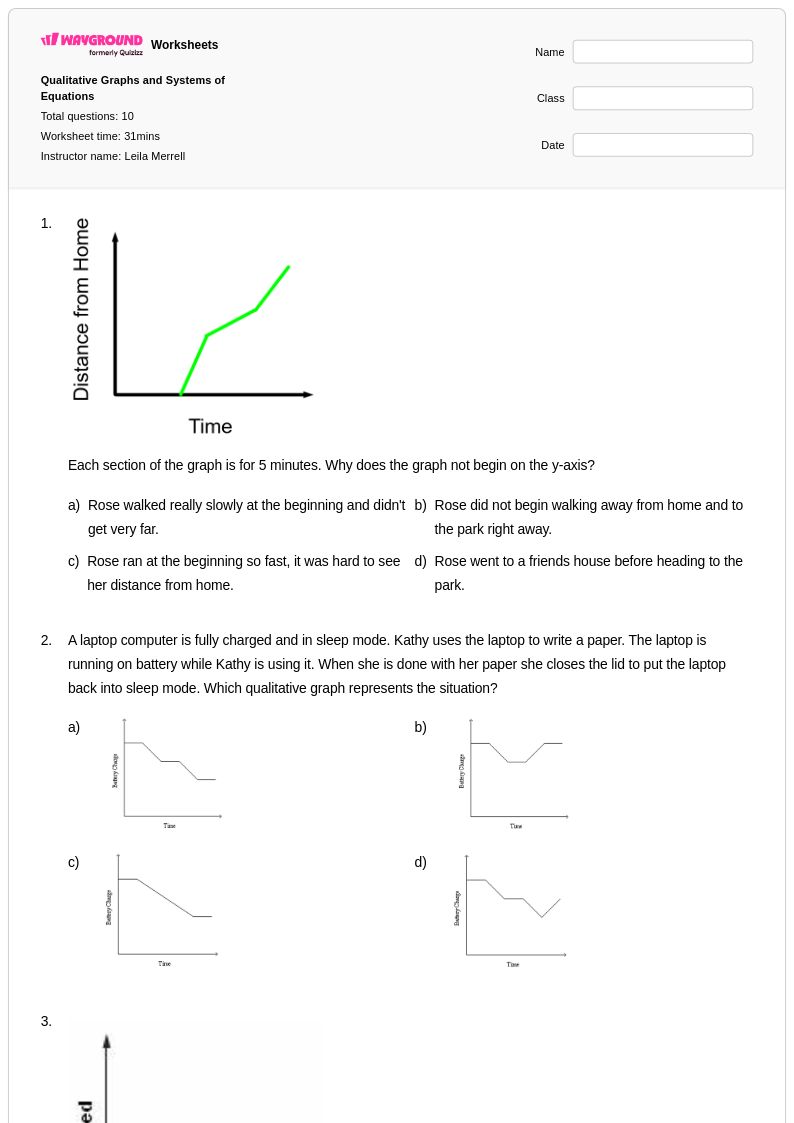
10 Q
8th
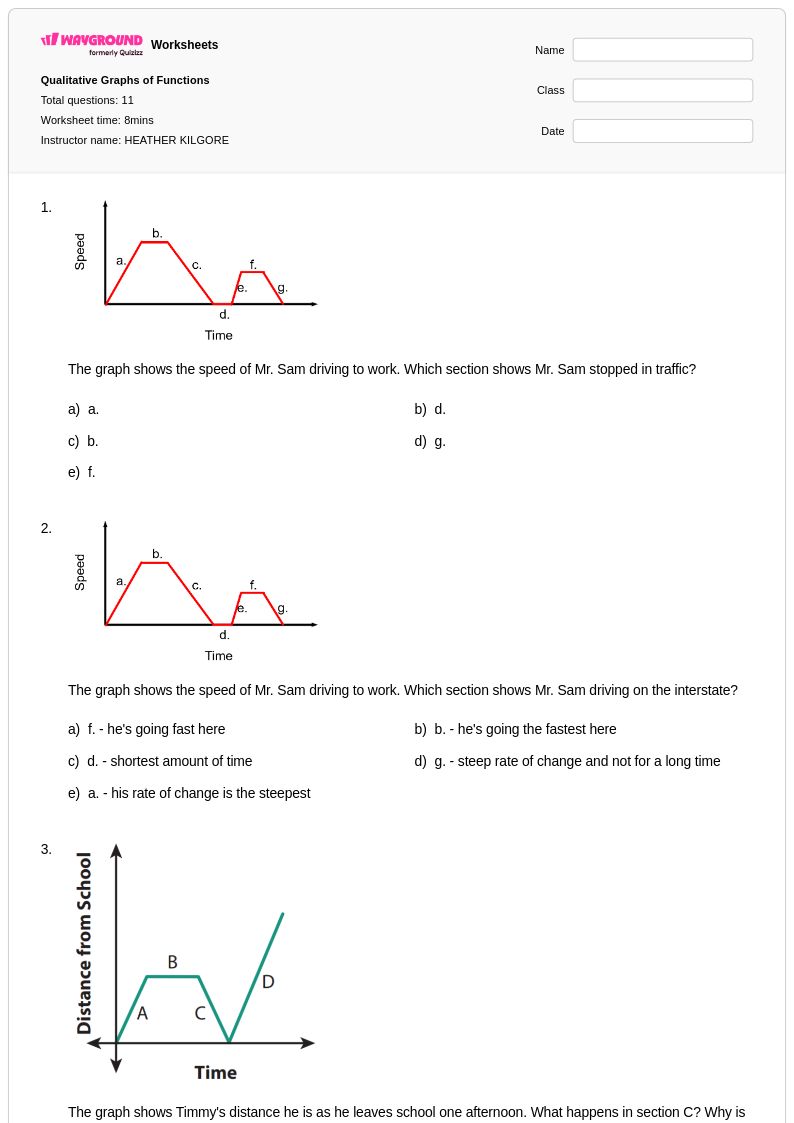
11 Q
8th
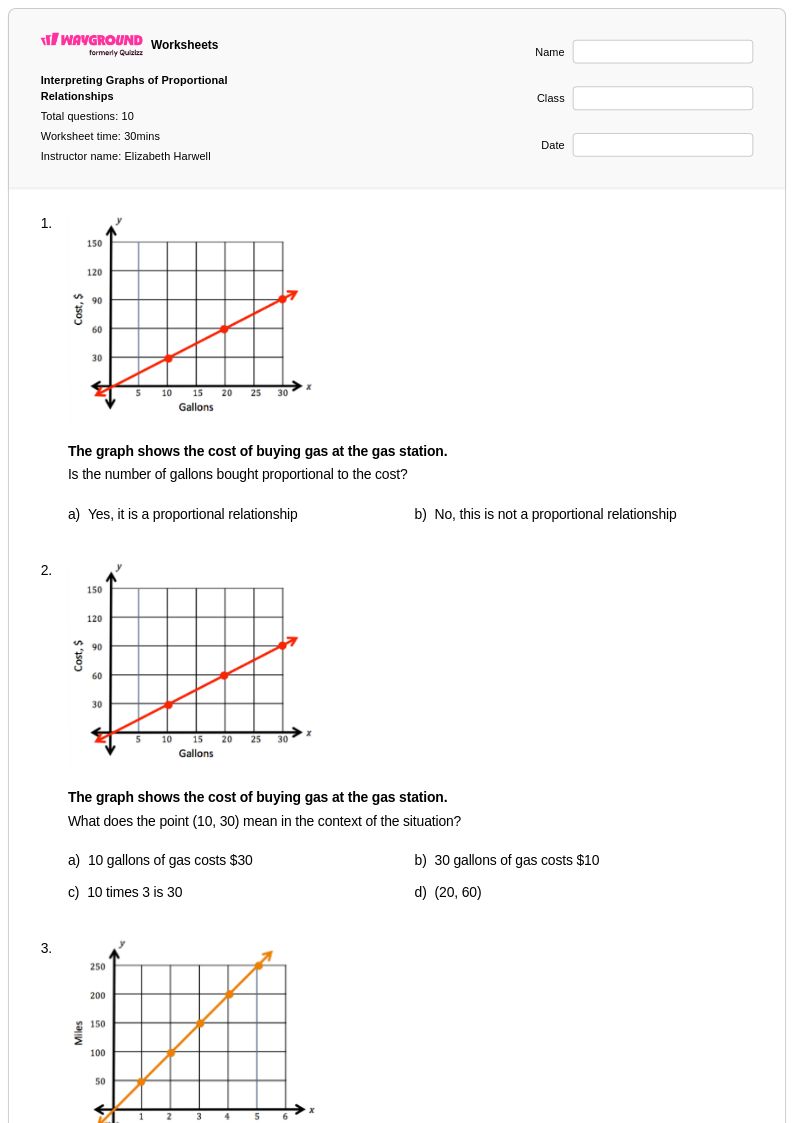
10 Q
7th
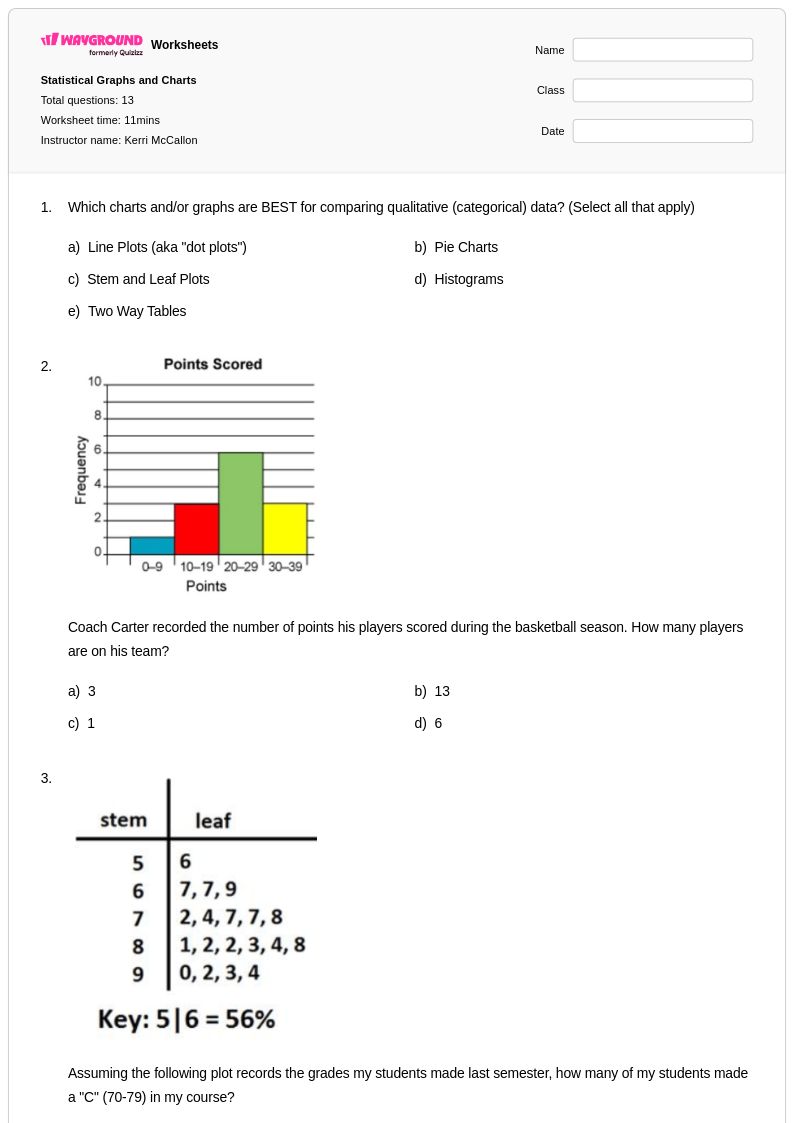
13 Q
10th - 12th
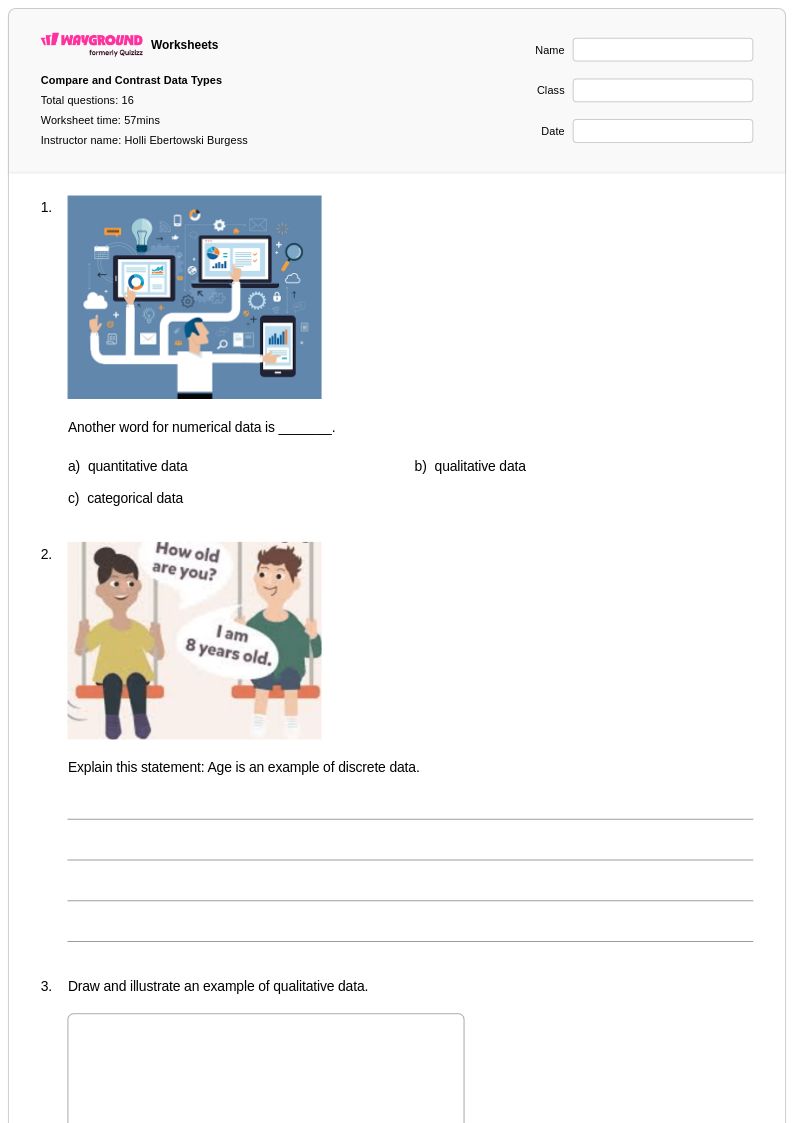
16 Q
3rd - 5th
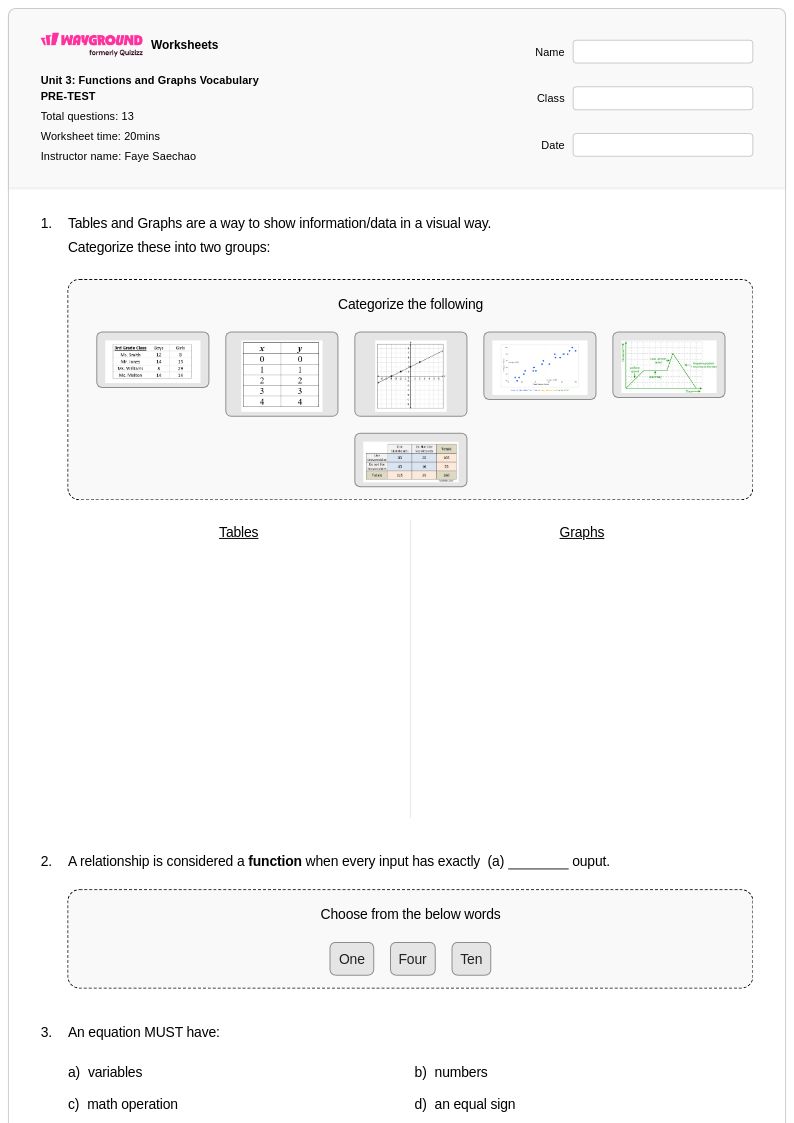
13 Q
8th
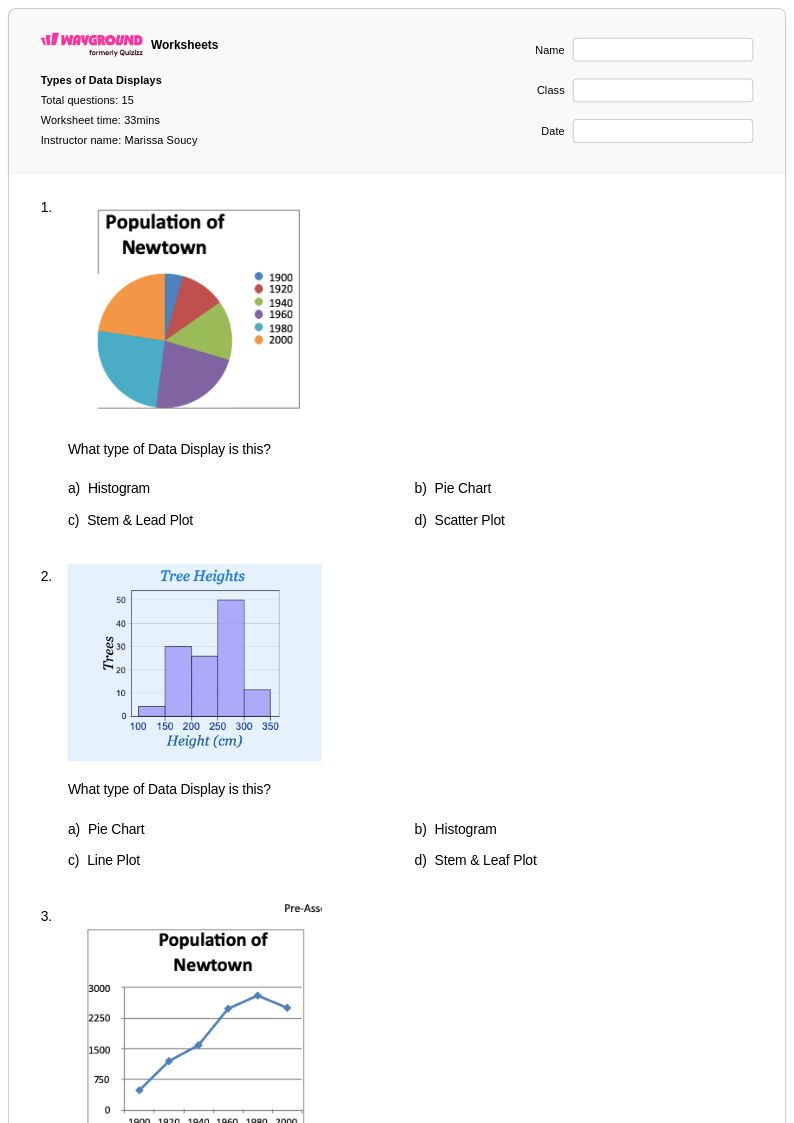
15 Q
9th - 10th
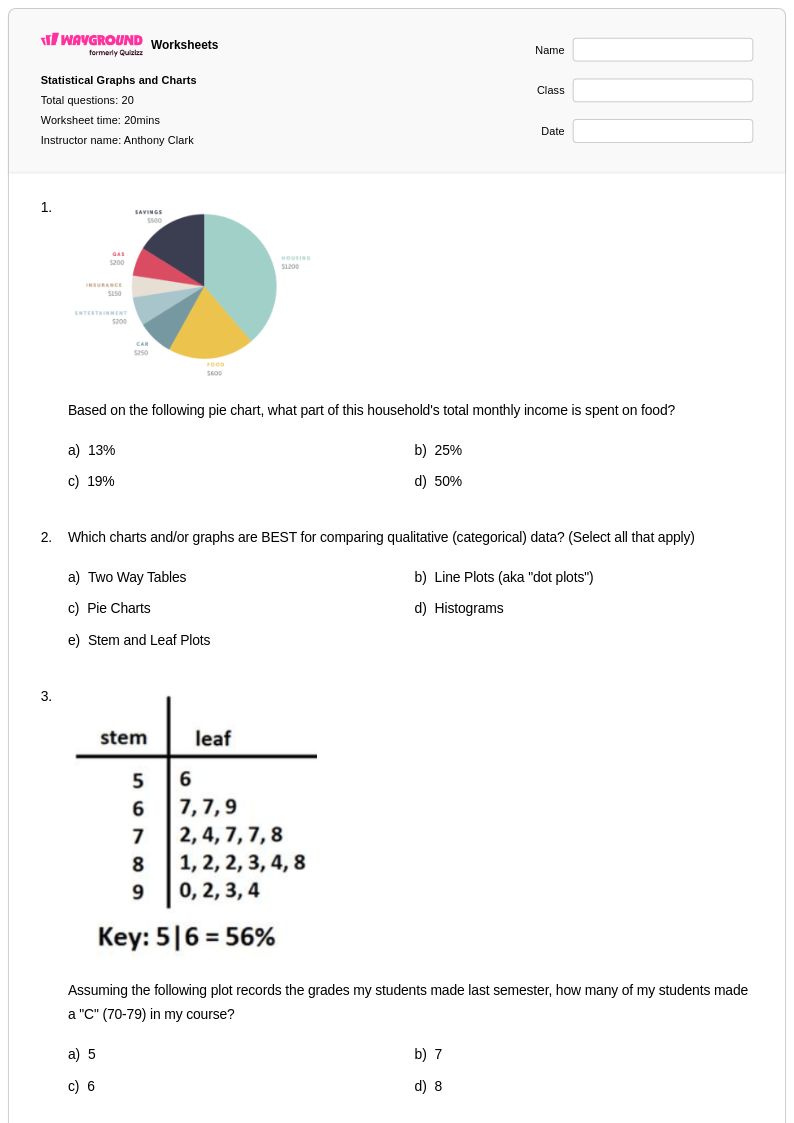
20 Q
12th - Uni
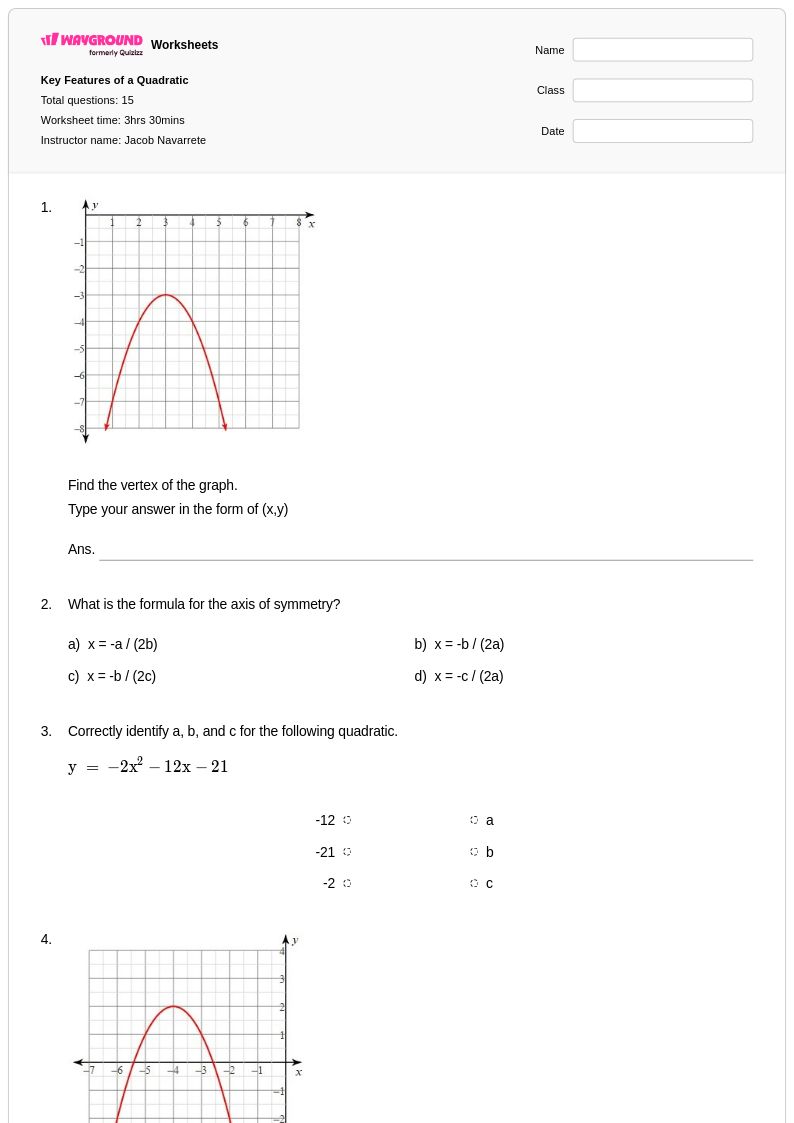
15 Q
9th - 12th
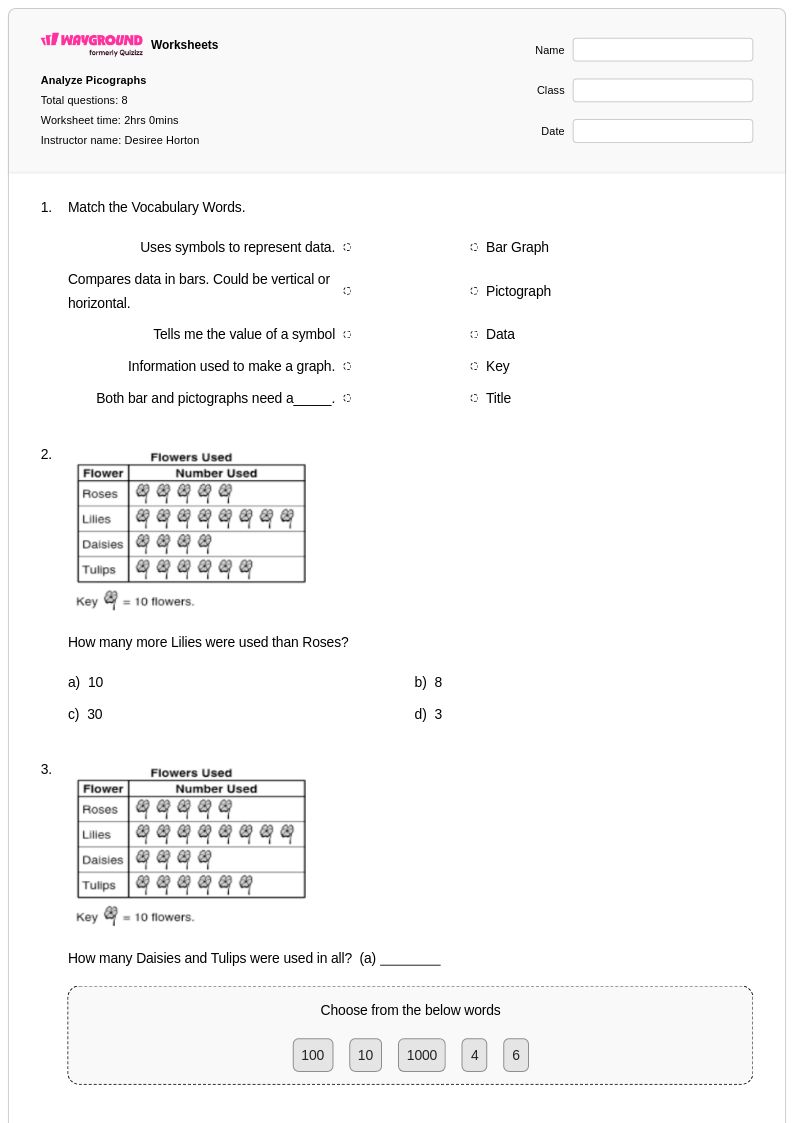
8 Q
3rd
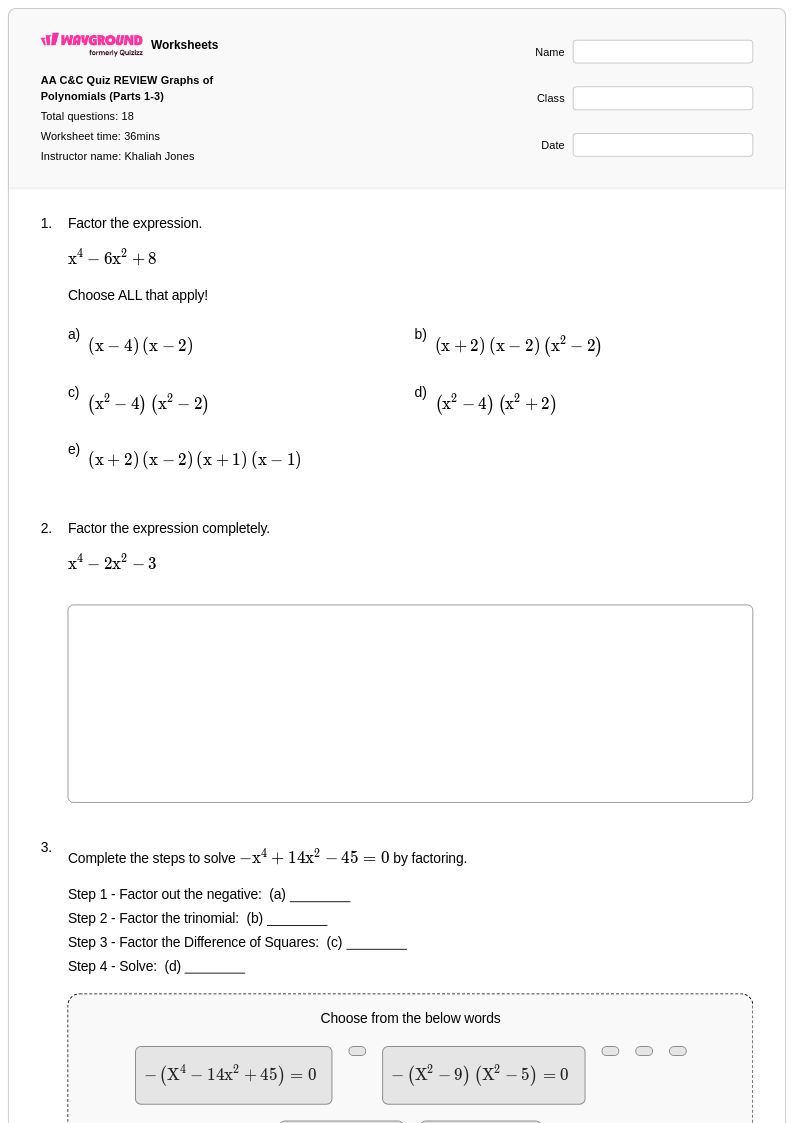
18 Q
11th
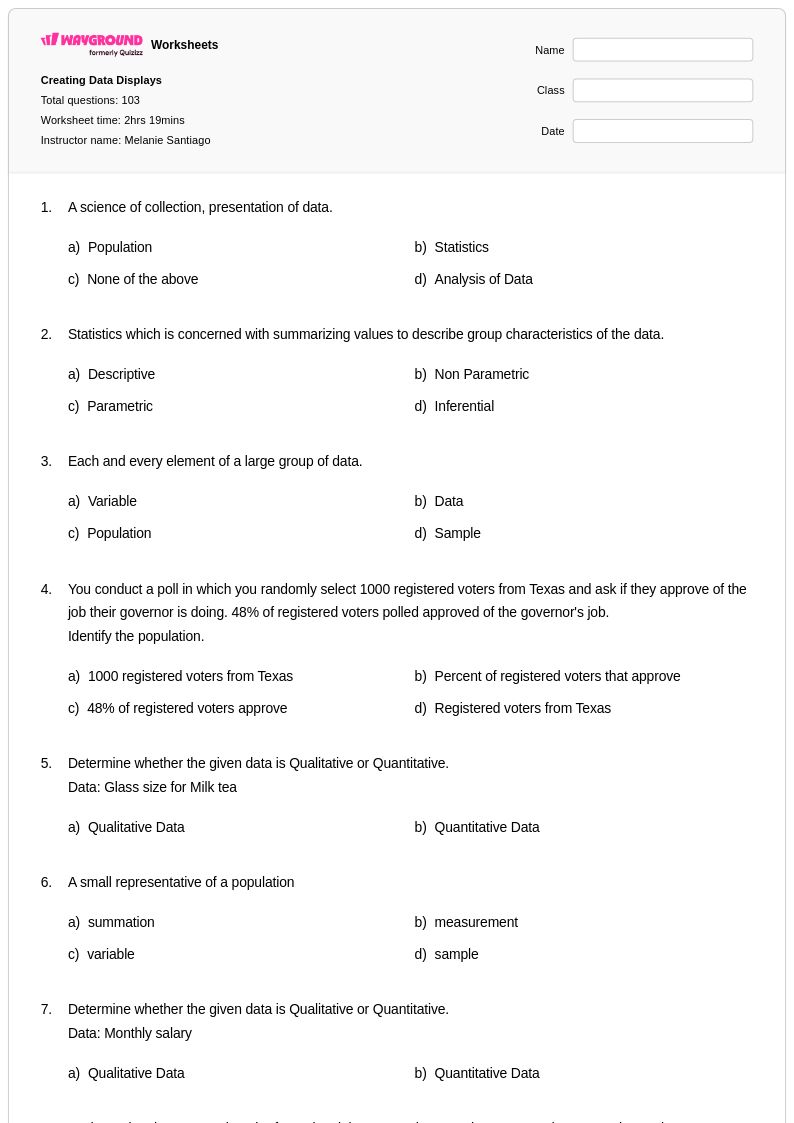
103 Q
9th - 12th
Explore Worksheets by Subjects
Explore printable Qualitative Graphs worksheets
Qualitative graphs worksheets available through Wayground (formerly Quizizz) provide students with essential practice in interpreting and analyzing graphs that display non-numerical relationships and trends. These comprehensive printable resources strengthen critical thinking skills by teaching students to read, interpret, and create graphs that show qualitative data such as temperature changes over time, population growth patterns, or speed variations during a journey. Each worksheet focuses on developing students' ability to understand the story that graphs tell without relying solely on specific numerical values, emphasizing the importance of recognizing patterns, trends, and relationships in visual data representations. The collection includes free pdf downloads with complete answer keys, offering educators ready-to-use practice problems that build foundational data literacy skills essential for mathematical reasoning and real-world problem solving.
Wayground (formerly Quizizz) supports mathematics educators with an extensive library of millions of teacher-created qualitative graphs worksheets designed to meet diverse classroom needs across all grade levels. The platform's robust search and filtering capabilities allow teachers to quickly locate resources aligned with specific curriculum standards, while built-in differentiation tools enable customization for varying skill levels within the same classroom. These versatile worksheets are available in both printable pdf format for traditional classroom use and digital formats for online learning environments, making lesson planning more efficient and flexible. Teachers can utilize these resources for targeted skill practice, remediation support for struggling students, enrichment activities for advanced learners, and comprehensive assessment preparation, ensuring that all students develop strong competencies in reading and interpreting qualitative mathematical representations.
FAQs
How do I introduce qualitative graphs to students?
What exercises help students practice interpreting qualitative graphs?
What are the most common mistakes students make with qualitative graphs?
How do qualitative graphs fit into the math curriculum?
How can I use this qualitative graphs worksheet in my class?
How can I support struggling students with qualitative graphs?