Find the best resources for your students
Browse by subject, grade to discover resources that support meaningful learning progress.
Browse by subject


Trusted by educators in
90% of US schools
and over
150+ countries.
Why choose Wayground?
Get any resource and adapt it to your needs
Dive into a library of resources that are standards-aligned and mapped to your curriculum
Use AI to differentiate any material so that it’s just-right for each student
Import and adapt your own trusted materials to save time planning and grading
Create aha moments for each student
Motivate every student, not just the loudest or the fastest
Vary the student experience across dozens of formats, modes, and question types
Get clear data (for you and for them) that celebrates progress
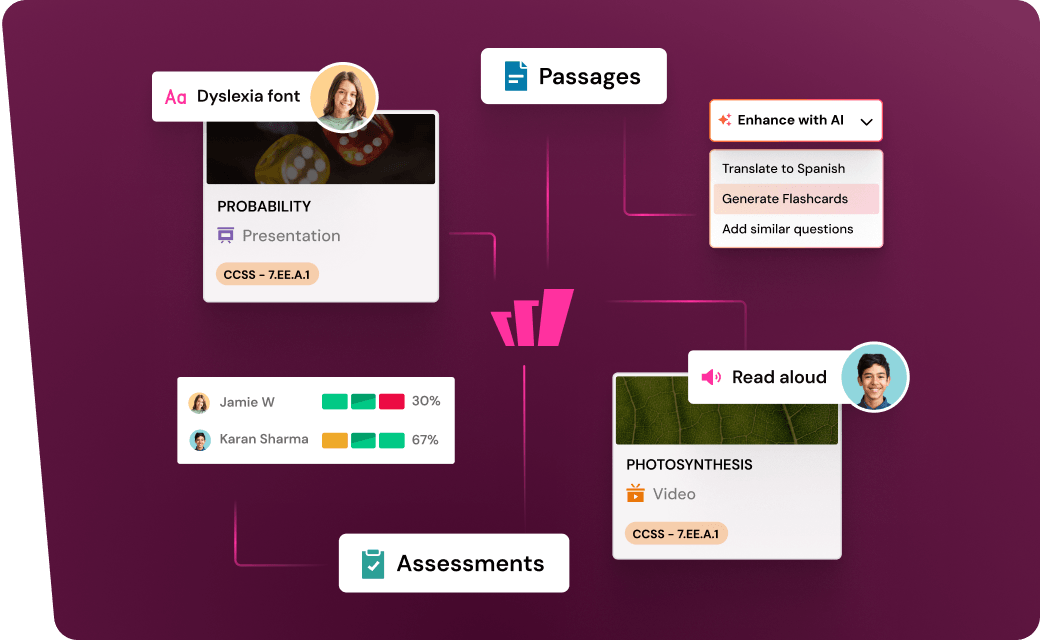
Accommodate students without singling them out
Assign 25+ modifications and adapt unique to each student
Set accommodations once and they're applied automatically moving forward
Adjust reading levels for groups of students and individuals
Find your best way forward
Wayground provides educators with a supplemental learning platform that brings together instruction, practice, and assessment in an AI-supported hub that helps students hit grade-level standards faster.
Teaching and learning resources for every subject and grade
Wayground (formerly Quizizz) offers a comprehensive collection of educational resources spanning every subject and every grade level, from kindergarten through higher education. Teachers and students can access millions of quizzes, interactive presentations, reading passages, video-quizzes, and flashcards covering mathematics, science, English language arts, social studies, world languages, and beyond. Each resource type serves a distinct instructional purpose: quizzes and practice questions reinforce understanding and provide immediate feedback across core concepts, flashcards build vocabulary and long-term recall through spaced repetition, presentations deliver structured visual instruction for introducing or deepening a topic, interactive video lessons embed comprehension checks directly into guided viewing experiences, and reading passages sharpen critical thinking through text-based questions. Together, these formats address the full range of learning needs — from initial concept explanation to ongoing skill reinforcement — making it possible for educators to find the right resource for any lesson, unit, or academic standard.
Wayground's library of teacher-created resources gives educators powerful search and filtering tools to quickly surface materials by subject, grade, standard, and resource type, ensuring that planning time is spent on instruction rather than resource creation. Standards-aligned content helps teachers connect daily practice to curriculum benchmarks, while differentiation and customization tools allow any resource to be adapted for diverse learners — whether for remediation, enrichment, or extension. Quizzes and flashcards support self-paced review and targeted practice, video-quizzes encourage active engagement with multimedia content, and presentations can be deployed for whole-class instruction or independent exploration. This breadth of flexible delivery formats means Wayground functions equally well in live classroom settings, asynchronous assignments, and blended learning environments, giving teachers a single, scalable platform to meet every student where they are across every grade and subject area.
Accessibility
Features
Wayground Super
School & District
Wayground for Business
Create a quiz
Create a presentation
Wayground AI
Subjects
Mathematics
Social Studies
Science
Physics
Chemistry
Biology
About
Our Story
Wayground Blog
Media Kit
Careers
Support
F.A.Q.
Help & Support
Privacy Policy
Terms of Service
Teacher Resources
2026 Wayground


Get our app

