wayground logo

Free Printable Worksheets

Font size

S
M
L
XL
Worksheets

Motion, Speed, Distance / Time Graphs

Total questions: 61

Worksheet time: 58mins

Name
Class
Date
1.
A measurement of how fast an object is moving
a)
Velocity
b)
Speed
c)
Vector
d)
Acceleration
2.
Can be measured in seconds (s)
a)
Distance
b)
Time
c)
Speed
d)
Acceleration
3.
Can be measured in meters per second (m/s)
a)
Distance
b)
Time
c)
Speed
d)
Acceleration
4.
Can be measured in meters (m)
a)
Distance
b)
Time
c)
Speed
d)
Acceleration
5.

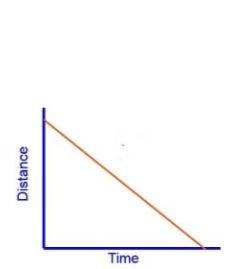
What does this graph represent?

(can choose more than 1)

a)

Constant speed

b)

Acceleration

c)

Not moving

6.
What is happening at C?
a)
Stationary
b)
Accelerating
c)
Fast steady speed; moving away from the starting position
d)
Slower steady speed; moving away from the starting position
7.
What is happening at D?
a)
Stationary
b)
Accelerating
c)
Fast steady speed; moving away from the starting position
d)
Slower steady speed; moving away from the starting position
8.
What is happening at A?
a)
Stationary
b)
Accelerating
c)
Slower steady speed; moving away from the starting position
d)
Steady speed; returning to start position
9.
What is happening at B?
a)
Stationary
b)
Accelerating
c)
Slower steady speed; moving away from the starting position
d)
Steady speed; returning to start position
10.
Which runner won the race?
a)
A
b)
B
c)
C
11.
Which runner had a head start?
a)
A
b)
B
c)
C
12.
At what time did runner A pass runner B?
a)
0 seconds
b)
1 second
c)
2 seconds
d)
3 seconds
13.
What is the formula to calculate speed?
a)
S = t/d
b)
S = d/t
c)
S = d x t
d)
S = t x d
14.
What is the speed of an object that travels 60 meters in 4 seconds?
a)
240 m/s
b)
15 m/s
c)
0.067 m/s
d)
15 mph
15.
Marta rides her bike 10 miles in 5 hours. Joel rides his bike 11 miles in 5 hours. Avery rides her bike 15 miles in 5 hours. Which child rides her bike faster?
a)
Marta
b)
Avery 
c)
Joel
16.
What does this graph represent?
a)
Constant Speed
b)
Acceleration
c)
Not moving
17.
How long did it take this object to travel 10 m?
a)
0 s
b)
10 s
c)
15 s
d)
20 s
18.
What is this graph showing?
a)
Constant Speed
b)
Acceleration (speeding up)
c)
Deceleration (slowing down)
d)
No motion
19.

What is happening in this graph from point A to B?

(can choose more than 1)

a)

The object is accelerating.

b)

The object is not moving.

c)

The object is decelerating.

d)

The object is moving at a constant speed.

20.
What is happening in this graph from point B to C?
a)
The object is going down a hill.
b)
The object is returning to its starting location.
c)
The object is slowing down.
d)
The object is staying still.
21.
If you travel 10 miles in 5 minutes, what is your speed?
a)
10 mi/min
b)
15 mi/min
c)
50 mi/min
d)
2 mi/min
22.
Which of the following is NOT a correct unit for speed?
a)
miles per hour
b)
km/min
c)
seconds per hour
d)
cm/s
23.
What is this graph showing?
a)
Constant Speed
b)
Acceleration (speeding up)
c)
Deceleration (slowing down)
d)
No motion
24.
In which of the following graphs (click the image) are both runners moving at the same speed (note that graph c is the bottom right graph, and graph d is the bottom left graph)? 
a)
Graph A
b)
Graph B
c)
Graph C
d)
Graph D
25.
What is the speed of an object that travels 60 meters in 4 seconds?
a)
240 m/s
b)
15 m/s
c)
0.067 m/s
d)
15 mph
26.
A description of the speed and direction of an object's motion
a)
Velocity
b)
Speed
c)
Acceleration
d)
Vector
27.
What is velocity?
a)
the quickness of an object
b)
the location of an object
c)
acceleration
d)
speed in a specific direction
28.
An elevator traveled 15 floors (150 ft) at a speed of 4.5 m/s. What additional information is needed to determine the velocity of the elevator?
a)
the direction the elevator traveled
b)
how long the elevator was stationary
c)
how many times the elevator stopped
d)
the total distance the elevator traveled
29.
Velocity is both ____ and _____. 
a)
speed , direction 
b)
direction, mass
c)
volume, density 
d)
direction, magnitude 
30.
How do you calculate average speed?
a)
divide total time by total distance
b)
multiply total time by total distance
c)
divide total distance by total time
d)
subtract total time from total distance
31.
Find the velocity of a plane that traveled 3000 miles west in 5 hours.
a)
65 mph west
b)
6 mph west
c)
600 mph west
d)
6000 mph west 
32.
Acceleration is defined as the CHANGE in 
a)
time of motion to another place. 
b)
velocity 
c)
distance 
d)
speed
33.
What is the velocity of a runner who travels South 100 m in 10 seconds 
a)
10 m/s South
b)
10 m/s
c)
100 m/s South
d)
1000 m/s
34.
Which graph shows a car that is moving at a constant velocity?
a)
A
b)
B
c)
C
d)
none of them
35.
Which graph shows a car that is speeding up?
a)
A
b)
B
c)
C
d)
none of them
36.
All of the following are examples of speed except:
a)
A car traveling at 55 km/hr
b)
A snail hightailing it 45 mm/sec
c)
Jube timing himself at 23 seconds
d)
Lonnie running down the hall at 45 mph
37.
All of the following are units of speed except:
a)
Km/hr
b)
Km
c)
Kilometer per hour
d)
Kilometer/Hour
38.
Total distance divided by total time is
a)
average speed
b)
constant speed
c)
instantaneous speed
d)
acceleration
39.

Every morning, Tom walks along a straight road from his home to the bus stop. Below, is a graph representing Tom’s trip to school.

- What is the average speed of Tom’s complete journey?

a)

1.6 m/s

b)

1.3 m/s

c)

2.3 m/s

d)

2.8 m/s

40.
 Every morning, Tom walks along a straight road from his home to the bus stop. Below, is a graph representing Tom’s trip to school.
-
 What is the distance covered through the second segment, which is between 50 seconds, and 70 seconds?
a)
40 meters
b)
60 meters
c)
80 meters
d)
20 meters
41.
How long did one of the runner's rest?
a)
8 seconds
b)
13 seconds
c)
5 seconds
d)
50 seconds
42.
Which runner stopped for a rest?
a)
Albert
b)
Bob
c)
Charlie
43.
What is the objects  speed from 0-20 seconds?
a)
0.5m/s
b)
10m/s
c)
2m/s
d)
10m
44.
At 60 seconds, how far had this object traveled? 
a)
0 m
b)
10 m
c)
20 m
d)
40 m
45.
Which graph shows the object standing still?
a)
A
b)
B
c)
C
d)
D
46.

What is this line of this graph showing?

a)

moving away from starting point at a constant speed

b)

moving back towards the starting point at a constant speed

c)

acceleration (getting faster)

d)

deceleration (getting slower)

47.
Which graph is showing acceleration (getting faster)
a)
D
b)
E
c)
both D and E
d)
neither D or E
48.
Which graph is showing deceleration (getting slower)
a)
D
b)
E
c)
both D and E
d)
neither D or E
49.
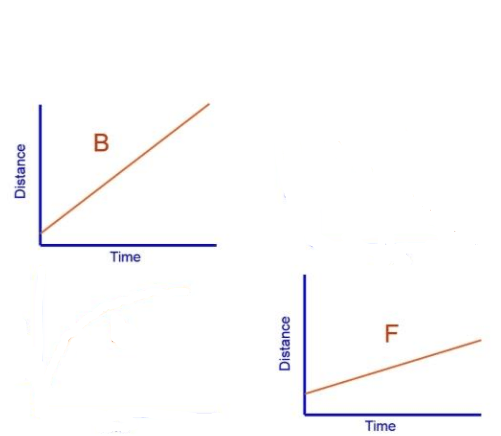
Which graph is showing a faster constant speed?
a)
B
b)
F
c)
They show the same speed
50.
How long did it take this object to travel 10 m?
a)
0 s
b)
10 s
c)
15 s
d)
20 s
51.

What is the speed this motion?

(can choose more than 1)

a)

constant speed

b)

not moving

c)

speed increasing

d)

speed increasing at a constant rate

52.

What happened during A to B point?

(can choose more than 1)

a)

not moving

b)

increasing speed at a constant rate

c)

moving at a constant speed

d)

acceleration

53.

What happened during C to D point?

a)

not moving

b)

increasing speed at a constant rate

c)

slowing down

d)

moving at 10 m/s

54.

What happened during E to F point?

(Can choose more than 1)

a)

not moving

b)

increasing speed at a constant rate

c)

constant speed

d)

acceleration

55.

What happened during B to C point?

a)

deceleration

b)

constant speed back home

c)

at rest

d)

acceleration

56.
Centripetal acceleration is ...
a)
Acceleration toward the center of a curved or circular path
b)
Acceleration toward the outside of a circle
c)
Vertical motion instead of horizontal motion
57.
What is the starting point used to describe the position of an object?
a)
Beginning point
b)
Ending point
c)
Reference point
d)
positive
58.
What is the speed of this object at 3 seconds?
a)
5 m/s
b)
45 m/s
c)
5 s/m
d)
45 s/m
59.
What is this objects speed at 2 s?
a)
5 m/s
b)
5 s/m
c)
20 m/s
d)
20 s/m
60.
What is the person doing from 5 seconds to 10 seconds?
a)
Walking 
b)
Running
c)
Standing Still 
d)
Walking Fast
61.
A student runs two times around a running path at a local park.  Each lap is 3 km.  The student completes the first lap in 20 minutes.  The student then sits on a bench and rest for 5 minutes before completing the second lap in 25 minutes.  Which graph bests represents the student's motion?
a)
F
b)
G
c)
H
d)
J