wayground logo

Free Printable Worksheets

Font size

S
M
L
XL
Worksheets

Unit 3: Populations

Total questions: 64

Worksheet time: 2hrs 24mins

Name
Class
Date
1.

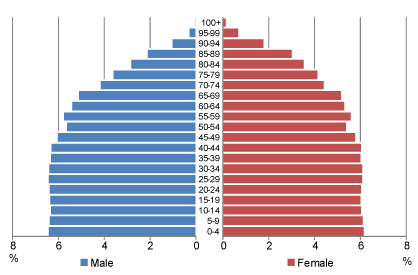
The population pyramid shown is most likely which country?

a)

Nigeria

b)

China

c)

Germany

d)

Japan

2.

The Population Pyramid shown is most likely which country?

a)

The United Arab Emirates

b)

USA

c)

Latvia

d)

Brazil

3.

The Population Pyramid shown is most likely which country?

a)

Canada

b)

Japan

c)

Zimbabwea

d)

Algeria

4.

Which country is the best example of a country in stage 5 of the demographic transition model?

a)

Japan

b)

North Korea

c)

China

d)

Vietnam

5.

What is the amount of average children needed for a population to achieve ZPG?

a)

2.1 per woman

b)

1 per woman

c)

3 per woman

d)

2.5 per woman

6.
VOCAB: The average number of years an individual is expected to live.
a)
life expectancy
b)
infant mortality
c)
death rate
d)
growth rate
7.
VOCAB: the total fertility rate for a nation that would keep its population size stable 
a)
replacement fertility rate
b)
total fertility rate
c)
growth rate
d)
death rate
8.
VOCAB: The average number of children a female member of a population has during her lifetime
a)
total fertility rate
b)
replacement fertility rate
c)
growth rate
d)
death rate
9.
What kind of growth is this country experiencing?
a)
Exponential Growth
b)
Stable Growth
c)
Declining Growth
10.
The richest one fifth of the world’s people uses what percent of the world’s resources?
a)
5
b)
23
c)
40
d)
86
11.

Which of the following is the BEST definition of the term crude birth rate?

a)

The total number of births in a year

b)

The number of births in a year divided by 1000

c)

The average number of births per 1000 people

d)

The total number of births per year per 1000 people

12.
If the global population has a CDR of 12 and a CBR of 15, this would result in a growth rate of ________%
a)
0.3
b)
3.0
c)
30
d)
.03
13.
What two main factors would best indicate quality of life of a country’s population?
a)
The total fertility rate and the death rate
b)
The crude birth rate and the crude death rate
c)
The birth rate and the infant mortality rate
d)
The life expectancy and the infant mortality rate
14.
In a country has a crude birth rate of 24 per 1,000 and a crude death rate of 8 per 1,000, the natural annual percent increase of its population is
a)
0.6%
b)
1.6%
c)
3%
d)
16%
15.
What is the population doubling time in years for a country with an annual growth rate of 3.5%?
a)
.5 year
b)
3.5 years
c)
20 years
d)
70 years
16.
Which of the following makes it difficult to reduce population growth?
a)
High literacy rates result in women wanting to have more children.
b)
Population sizes will not decline until some people start having to do without food and other necessities of life.
c)
Many people have low literacy and limited access to healthcare
17.
Educating women worldwide has lowered birthrates partly because
a)
educated women need to bear many children to ensure that some will survive.
b)
educated women may learn family-planning techniques.
c)
educated women contribute less to their family income.
18.
Growth rates for different parts of the world vary depending on the level of development of the region. Which region is experiencing the biggest increase in population?
a)
Europe
b)
Asia 
c)
North America
d)
Australia
19.
If a country were doubling its population every 35 years, what would its growth rate be?
a)
1%
b)
2%
c)
4%
d)
8%
20.
Even if a country reduces its birth rate and maintains replacement-level fertility, its population will still continue to grow for several decades because of
a)
lower death rates.
b)
increased income.
c)
population momentum.
d)
better health care.
21.
Which of the following is a true statement about replacement-level fertility?
a)
It equals the average number of children a woman will give birth to during her child-bearing years
b)
It equals the annual number of live births per 1,000 people in a population
c)
It equals the natural increase of a population in one year
d)
It is greater in countries with high infant-mortality rates than in countries with low infant-mortality rates
22.
Which of the following have contributed to increased family planning worldwide?
  I. women's education
 II. increased income
III. advertising campaigns
a)
I, II, and III
b)
I and II only
c)
I and III only
d)
II and III only
23.
The IPAT equation was developed to estimate
a)
the affluence of a country's population
b)
the rate of demographic transition
c)
the impact of human lifestyles on Earth
d)
the gross domestic product o a country
24.
Which of the following is NOT a factor in gross domestic product?
a)
consumer spending
b)
cost of environmental damage
c)
government spending
d)
imports and exports
25.

There are roughly 7 billion people in the world today. Which map shows best where they live? (Each figure represents 1 billion

a)

1 billion in Europe, 4 billion in Asia, 1 billion in Africa and 1 billion in America.

b)

1 billion in Europe, 3 billion in Asia, 2 billion in Africa and 1 billion in America

c)

1 billion in Europe, 3 billion in Asia, 1 billion in Africa and 2 billion in America?

26.
The increase in the size of Earth’s human population in the last century has been dramatic. Which of the following identifies two major contributors to this increase?
a)
New methods of agriculture and the identification of new food crops
b)
The Industrial Revolution and modern medicine
c)
New methods of birth control and decreased warfare
d)
Increased education for women and the development of new pesticides
27.
Which section would see exponential population growth?
a)
1
b)
2
c)
3
d)
4
28.
The most critical factor in controlling human population growth is
a)
controlling reproductive lifespan.
b)
decreasing the age of first birth.
c)
decreasing the average number of births per woman.
d)
decreasing infant death.
29.
Population size can be estimated using the formula
a)
(CBR + Immigration) + (CDR + Emigration)
b)
(CBR + Immigration) - (CDR + Emigration)
c)
(CBR - Immigration) + (CDR - Emigration)
d)
(CBR - Immigration) - (CDR - Emigration)
30.
Use Figure 7-1.  Population A would most likely be in which stage of demographic transition?
a)
Pre-Industrial
b)
Transitional
c)
Industrial
d)
Post-Industrial
31.

If a city of population 10,000 experiences 100 births, 40 deaths, 10 immigrants, and 30 emigrants in the course of a year, what is its net annual percentage growth rate?

a)

0.4%

b)

0.8%

c)

1.0%

d)

4.0%

e)

8.0%

32.

The current global human population is about 7.6 billion and is growing at an annual rate of 1.1 percent. If world population were to grow at the current rate, how many people would be added next year?

a)

8 X 10⁵

b)

8 X 10⁶

c)

8 X 10⁷

d)

8 X 10⁸

e)

8 X 10⁹

33.

Identify TWO (2) of the key improvements that led to a population growth.

a)

Sanitation Improvements

b)

Improvements in weapons

c)

Vaccinations & Antibiotics

d)

Education

34.

According to which theory do the collective actions of different human beings sometimes cause situations that are threatening to the environment?

a)

Tragedy of the Commons

b)

Tragedy of the Resources

c)

Scientific Theory of Common Use

d)

Common Sense

35.

Women tend to have fewer and healthier children for which of the following reasons? (Choose one or more)

a)

When their individual rights are protected

b)

When they have access to education

c)

When they have access to the internet

d)

When they are not in arranged marriages

36.

Which factor below is least likely to affect birth and fertility rates today?

a)

number of people 60 or older

b)

cost of raising and educating children

c)

religious beliefs

d)

educational and employment opportunities for women

e)

average age at marriage

37.

A metropolitan region of 100,000 people has 2000 births, 500 deaths, 200 emigrants, and 100 immigrants over a 1-year period. Its population growth rate is

a)

1.2 percent.

b)

1.4 percent

c)

1.6 percent.

d)

1.8 percent.

e)

2.0 percent.

38.

Which of the following pairs of indicators best reflects the availability of health care in a country?

a)

Crude death rate and growth rate

b)

Crude death rate and crude birth rate

c)

Growth rate and life expectancy

d)

Infant mortality rate and life expectancy

e)

Infant mortality rate and crude death rate

39.

Which of the following characteristics are typical of developed countries?

I High technology use

II Low GDP

III Small-scale sustainable agriculture

a)

I only

b)

II only

c)

I and III only

d)

II and III only

e)

I, II and III

40.
What does the graph represent?
a)
Emigration
b)
Exponential growth
c)
Immigration
d)
Logistic Growth
41.
Which limiting factor is independent of the number of individuals in a population?
a)
competition
b)
parasitism/disease
c)
stress
d)
natural disasters
42.

What point on the graph represents the carrying capacity?

a)

A

b)

B

c)

C

d)

D

43.
Which factor is a density-dependent limiting factor on the population of a species?
a)
seasonal variation
b)
natural disasters
c)
unusual weather
d)
predation
44.
________ grow slowly over time, cares for its young over a long period of time and is usually near the carrying capacity of its ecosystem.
a)
K-strategists
b)
R-strategists
c)
Uniform strategists
d)
environmentalists
45.
The intrinsic growth rate of a population
a)
occurs at the population's carrying capacity
b)
depends on the limiting resources of the population
c)
increases as the population size increases
d)
decreases as the population size increases
46.
An r-selected species characteristically has
a)
a type I survivorship curve
b)
few offspring
c)
a population near carrying capacity
d)
a fast population growth rate
47.

Identify two main contributors for the dramatic increase in the world population over the last century.

a)

increased access to birth control

b)

development of modern medicine

c)

increased immigration

d)

introduction of the Industrial Revolution

48.

According to the graph, what can have the greatest impact on reducing global TFR?

a)

increasing access to healthcare

b)

increasing access to immigration

c)

women empowerment

49.
What is the carrying capacity of the following graph?
a)
1000
b)
8000
c)
800
d)
600
50.
Which section would see exponential population growth?
a)
1
b)
2
c)
3
d)
4
51.
A country with an age distribution like that shown in the figure above, is most likely a country that
a)
Is expecting rapid growth
b)
Is experiencing slow or no population growth
c)
Is experiencing a high death rate
d)
Is a less-developed country
52.
The graph on the right best represents which country?
a)
USA
b)
Mexico
c)
Nigeria
d)
India
53.
Organisms that have gestation (pregnancy) periods and usually only give birth to one offspring at a time.
a)
Type 1
b)
Type 2
c)
Type 3
d)
Foxes
54.
Use Figure 7-1.  Population A is most likely:
a)
rapidly growing
b)
rapidly declining
c)
stable or close to stable
d)
going to decline in a few decades
55.
Use Figure 7-1.  Population A would most likely be in which stage of demographic transition?
a)
Pre-Industrial
b)
Transitional
c)
Industrial
d)
Post-Industrial
56.
Nesting birds often space themselves evenly from other nests. This pattern is called
a)
clumped dispersion.
b)
uniform dispersion.
c)
random dispersion
d)
scatter dispersion
57.
Largest number of individuals of a population that the environment can support...  
a)
carrying capacity
b)
population crash
c)
lag phase
d)
mutualism
58.

Which of the graphs below shows exponential growth?

a)
b)
c)
d)
e)
59.
Refer to the diagram of the survivorship curve.
Which curve best describes an organism that invests a lot of energy in parenting?
a)
A
b)
B
c)
C
d)
this is not a survivorship curve
60.
Which kind of dispersion is shown in #1?
a)
clumped
b)
random
c)
uniform
d)
segregated
61.

Specialist species have an advantage in habitats that...

a)

stay the same

b)

are constantly changing

c)

have many different food options

62.

___________ is the capacity for population growth under ideal conditions

a)

k selected

b)

r selected

c)

mortality rate

d)

biotic potential- intrinsic rate of growth

63.

R-selected species have...

a)

high parental care

b)

early reproductive age

c)

few offspring

d)

long life spans

64.

Survivorship curves- Which type would be typical for R-selected species?

a)

Type I- late loss

b)

Type II- constant loss

c)

Type III- early loss

d)

Type VI- no loss