wayground logo

Free Printable Worksheets

NEW

Font size

S
M
L
XL
Worksheets

8th grade-science method

Total questions: 70

Worksheet time: 2hrs 16mins

Name
Class
Date
1.
A standard used to compare the results of the experiment/remains constant from experiment to experiment is a(n)
a)
constant.
b)
control.
c)
dependent variable.
d)
independent variable.
2.
A variable whose value changes as a result of changes to other variables is a(n)
a)
independent variable.
b)
dependent variable.
c)
constant.
d)
control.
3.

A scientist investigates the effect of carbon dioxide on plant height. The scientist grows plants in several closed containers. All the plants receive the same amounts of water and light, but the air in each container has a different amount of carbon dioxide. What is the independent variable in this experiment?

a)

the amount of carbon dioxide in each container

b)

the number of plants in each container

c)

the amount of water provided to the plants

d)

the height of each plant after a period of time

4.

The table shoes different types of pollination data for the fruit from one plant species.


Which graph best represents some of the data in the table?

a)
b)
c)
d)
5.

The scientific method is a process that is used to explore nature and answer questions.

a)

True

b)

False

6.

Scientists look for ___________ and effect relationships in nature.

a)

matter

b)

energy

c)

affect

d)

cause

7.

Observations lead to questions, which are the basis for all scientific research.

a)

True

b)

False

8.

Scientists repeat experiments multiple times to make sure there are no errors.

a)

True

b)

False

9.

Scientists collect data to analyze it, resulting in a conclusion that answers their original question.

a)

True

b)

False

10.

Which is one reason that engineers should test their designs?

a)

to find ways to improve their designs

b)

to make them smaller and more compact

c)

to change the design to be more profitable

d)

to discover solutions to problems that have not yet occured

11.

What is a hypothesis?

a)

a standard for comparison

b)

a testable prediction

c)

a factor that is adjusted by the experimenter

12.

What is a control?

a)

a factor whose value is graphed on the y-axis

b)

organized procedure for testing a hypothesis

c)

a standard for comparison

13.

What is a dependent variable?

a)

a factor whose value is graphed on the y axis

b)

a factor that doesn't vary in experiment

c)

a standard for comparison

14.

What is an experiment?

a)

a testable prediction

b)

a standard for comparison

c)

an organized procedure for testing a hypothesis

15.

What is a constant?

a)

a factor that is adjusted by the experimenter

b)

A factor that doesn't vary in the experiment

c)

a factor whose value is graphed on the y-axis

16.

What is an independent variable?

a)

a factor adjusted by the experimenter

b)

a factor that doesn't vary in the experiment

c)

a factor whose value is graphed on the y-axis

17.
A testable explanation to a problem that has not yet been tested. 
a)
data
b)
theory
c)
hypothesis
d)
fact
18.
This variable in an experiment is the one being changed by the scientist. 
a)
dependent variable
b)
independent variable
c)
data
d)
control group
19.
Testing a hypothesis often involves a(n):
a)
answer
b)
experiment
c)
problem
d)
safety check
20.
The summary at the end of an experiment that explains the results. 
a)
conclusion
b)
procedures
c)
materials
d)
responding variable
21.
The name of the information that you get from your experiment (you organize it into charts and graphs).
a)
observations
conclusion
b)
data
c)
variables
d)
hypothesis
22.
An experiment is performed on plants to see how different liquids affect plant growth. Each plant in the experiment is given a different liquid; water, apple juice, or milk. Each plant has the same amount of soil, sunlight, and listens to the same music. In this investigation, the independent variable is ...
a)
The type of plant
b)
The amount of sunlight
c)
The type of music
d)
The type of liquid
23.
Dependent variable means
a)
the scientist controls what to test
b)
educated guess
c)
ask a question
d)
what is being measured
24.
If you increase the amount of spinach you eat, then you will increase the iron in your blood. 
What's the dependent variable?
a)
increase the amount of iron in your blood
b)
spinach you eat
25.
If I ride my bike to school instead of walking, then I will get to school faster. What is the dependent variable?
a)
True
b)
How fast you get to school
c)
Riding a bike or walking
d)
False
26.
If I study for my scientific method test, then I will have a better test score. What is the dependent variable?
a)
Scientific Method
b)
Studying
c)
Independent variable
d)
Test score
27.
If I listen to Mr. Castro's instructions, then I will have less accidents in the lab. What is the independent variable?
a)
Yes
b)
Maybe
c)
Listening or not listening to instructions
d)
Likelihood of having an accident in lab 
28.
If I read this question carefully, then I will answer it correctly. What is the independent variable?
a)
I hope so
b)
Yes
c)
Reading or not reading carefully
d)
Likelihood of a correct answer
29.
What is the length of the screw?
a)
5cm
b)
6cm
c)
5mm
d)
6m
30.
4 cm = ___mm
a)
400
b)
40
c)
4
d)
4,000
31.
Convert from meters to cm:  9 meters
a)
900 cm
b)
90 cm
c)
0.9 cm
d)
0.09 cm
32.

5 L = _____ mL

a)

0.005

b)

500

c)

50

d)

5000

33.
Which unit is the smallest?  
a)
km
b)
mm
c)
m
d)
cm 
34.
What is an observation?
a)
an opinion
b)
a fact
c)
what you decide
d)
a conclusion
35.
What is an observation for this picture?
a)
The man is scared
b)
The man is going to get eaten
c)
There is a man in a kayak
d)
The man is paddling fast
36.
Dolphin colors range from gray to white
a)
quantitative observation
b)
qualitative observation
37.
Dolphins have smooth skin.
a)
quantitative observation
b)
qualitative observation
38.
Dolphins eat the equivalent of 4% of their body mass each day.
a)
quantitative observation
b)
qualitative observation
39.
Dolphins in a pod engage in play.
a)
quantitative observation
b)
qualitative observation
40.
There are nine dolphins in a pod.
a)
quantitative observation
b)
qualitative observation
41.
The penguin got pushed in.
a)
Observation
b)
Inference
42.
More penguins are going to jump in next.
a)
Observation
b)
Inference
43.
The weather is cold.
a)
inference
b)
observation
44.
The boy is in the water.
a)
inference
b)
observation
45.
The tree branch is broken.
a)
inference
b)
observation
46.
You know that 12 inches = 1 foot.  Convert 60 inches to feet.
a)
720 feet
b)
5 feet
c)
5 inches
d)
72 feet
47.
How many gallons are in a pool that holds 758,000 Liters?
(1 gallon = 3.79 Liters)
a)
200
b)
20,000
c)
200,000
d)
2,000,000
48.

Convert 40 ounces to pounds. (16oz = 1lb)

a)

2.5 pounds

b)

.4 pounds

c)

2/5 pounds

d)

5 pounds

49.
The length of a desk is 3.5 feet. How many centimeters is the length? 
(there are 2.54 cm in an inch)
a)
60
b)
120.23
c)
106.68
d)
117.12
50.

How many years are in a 3 months?

a)

0.2 yrs

b)

0.75 yrs

c)

0.50 yrs

d)

0.25 yrs

51.

How many kilograms of calcium are there in 173 pounds of calcium? (1 pound = 454 grams; 1 kg = 1000 g)

a)

1.10 kg

b)

78.5 kg

c)

110 kg

d)

78500 kg

52.

Convert 35⁰F to Celsius (5/9 x (0F - 32))

a)

1.6⁰

b)

1.7⁰C

c)

2.0⁰

d)

16.6⁰C

53.

Convert 30°C to Fahrenheit (1.8 x 0C) + 32

a)

860°F

b)

86°F

c)

63.8°F

d)

56°F

54.

Convert 15°C to Fahrenheit (1.8 x 0C) + 32

a)

63.8°F

b)

84.6°F

c)

-9.4°F

d)

59°F

55.

100 Celsius is ? Kelvin (K = Celsius + 273)

a)

173 K

b)

373K

c)

273 K

d)

0 K

56.
What type of graph is this?
a)
Line Graph
b)
Pictograph
c)
Bar Graph
d)
Histogram
57.
What type of graph is this?
a)
Line Graph
b)
Pictograph
c)
Bar Graph
d)
Histogram
58.
What type of graph is this?
a)
Bar graph
b)
Histogram
c)
Pie Chart
d)
Stem Chart
59.
A pie chart allows you to easily see
a)
information about the proportion of parts relative to the whole.
b)
the total number of each category.
c)
how much data occurs within a range of numbers.
d)
the spread of the data.
60.
How many students take the bus to school?
a)
35
b)
20
c)
10
d)
15
61.
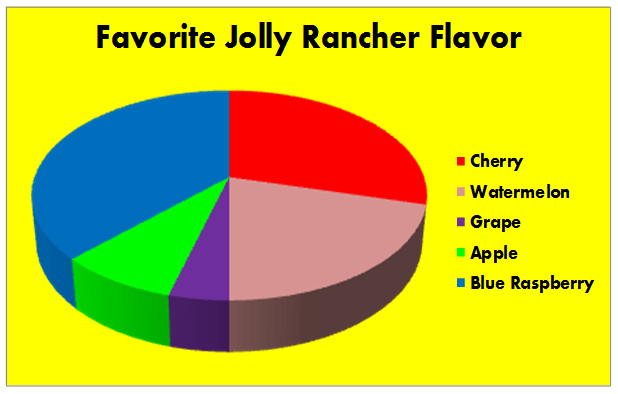
According to this graph, what is the most popular flavor of Jolly Rancher?
a)
Cherry
b)
Grape 
c)
Blue Raspberry
d)
Watermelon
62.

The __ - axis is vertical in the coordinate plane. This is usually the dependent variable.

a)

X

b)

Y

c)

Z

d)

None of the above

63.

The __ - axis is the horizontal axis of the coordinate plane. This is usually the independent variable.

a)

X

b)

Y

c)

Z

d)

None of the above

64.

To display data which compares favorite movie types, you should use a...

a)

Circle Graph

b)

Bar Graph

c)

Line Graph

65.

To display data showing your heights over the first ten years of your life, use a...

a)

Circle Graph

b)

Bar Graph

c)

Line Graph

66.

To display data comparing the colors of skittles in a bag compared to the total number of skittles in the bag, use a...

a)

Circle Graph

b)

Bar Graph

c)

Line Graph

67.
How much weight is on this triple beam balance?
a)
272 g
b)
272.5 g
c)
270 g
d)
372 g
68.
How much water is in the graduated cylinder
a)
40
b)
30
c)
35
d)
36
69.
What is this?
a)
Balance
b)
Triple beam balance
c)
Mass
d)
Graduated cylinder
70.
What is this?
a)
goggles
b)
eye dropper
c)
visor
d)
beaker