

wayground logo

Free Printable Worksheets

Font size

S
M
L
XL
Worksheets

APES Unit 3: Populations

Total questions: 85

Worksheet time: 4hrs 46mins

Name
Class
Date
1.

Which factor below is least likely to affect birth and fertility rates today?

a)

number of people 60 or older

b)

cost of raising and educating children

c)

religious beliefs

d)

educational and employment opportunities for women

e)

average age at marriage

2.

A metropolitan region of 100,000 people has 2000 births, 500 deaths, 200 emigrants, and 100 immigrants over a 1-year period. Its population growth rate is

a)

1.2 percent.

b)

1.4 percent

c)

1.6 percent.

d)

1.8 percent.

e)

2.0 percent.

3.

Which of the following pairs of indicators best reflects the availability of health care in a country?

a)

Crude death rate and growth rate

b)

Crude death rate and crude birth rate

c)

Growth rate and life expectancy

d)

Infant mortality rate and life expectancy

e)

Infant mortality rate and crude death rate

4.

Which of the following characteristics are typical of developed countries?

I High technology use

II Low GDP

III Small-scale sustainable agriculture

a)

I only

b)

II only

c)

I and III only

d)

II and III only

e)

I, II and III

5.

Which of the following statements about total fertility rate is correct

a)

TFR is equal to the crude birth rate minus the crude death rate.

b)

TFR is the average number of children each woman must have to replace the current population.

c)

TFR is generally higher in developed countries than in developing countries

d)

TFR is equal to the growth rate of a country

e)

TFR is the average number of children each woman will give birth to during her childbearing years.

6.

Even if a country reduces its birth rate and maintains replacement-level fertility, its population will still continue to grow for several decades because of

a)

lower death rates

b)

increased income.

c)

population momentum

d)

better health care.

e)

increased life expectancy.

7.

At current growth rates, which country will probably be the most populous in the world after 2050?

a)

China

b)

Brazil

c)

India

d)

Indonesia

e)

United States

8.

Which of the following countries best exemplifies phase 4 of a demographic transition?

a)

Argentina

b)

China

c)

India

d)

Mexico

e)

Japan

9.

Using the rule of 70, a population growing at 10% would double in

a)

7 years

b)

10 years

c)

17 years

d)

15 years

e)

not enough information to tell

10.

Populations whose age structure diagrams are narrower at the bottom than at the top have

a)

high death rates

b)

the same proportion of individuals in each age group

c)

a declining population

d)

a high growth rate

e)

all of the above

11.

A particular country has a Total Fertility Rate equal to replacement level fertility and emigration equal to immigration. Which of the following must be true?

a)

The population will begin shrinking within ten years, based on the Rule of 70.

b)

The population must be stable.

c)

The population will begin growing as soon as TFR = 2.1.

d)

Infant mortality must also be less than Crude Death Rate.

e)

There is not enough information to tell.

12.

Population size can be estimated using the formula

a)

CBR + Immigration + CDR + Emigration

b)

CBR + Immigration – CDR – Emigration

c)

CBR + Immigration + CDR – Emigration

d)

CBR – Immigration – CDR – Emigration

e)

CBR – Immigration + CDR – Emigration

13.

What factor describes when populations decrease because animals are moving out of a population?

a)

Emigration

b)

Limiting Factors

c)

Immigration

d)

Exponential Growth

14.
What does the graph represent?
a)
Emigration
b)
Exponential growth
c)
Immigration
d)
Logistic Growth
15.
Which limiting factor is independent of the number of individuals in a population?
a)
competition
b)
parasitism/disease
c)
stress
d)
natural disasters
16.

What point on the graph represents the carrying capacity?

a)

A

b)

B

c)

C

d)

D

17.

A population is...

a)

All members of one species in one area

b)

All members of all species that live in one area

c)

All of the living and nonliving things in an area

d)

None of these

18.
Which factor is a density-dependent limiting factor on the population of a species?
a)
seasonal variation
b)
natural disasters
c)
unusual weather
d)
predation
19.

What is happening at the 'A' on the graph?

a)

the population overshoots above the carrying capacity

b)

the population stops growing

c)

growth begins to slow down due to limited resources

d)

growth is speeding up due to an abundance of resources
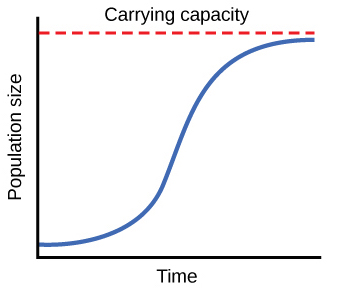
20.
To measure population density, you must divide the number of individuals living in a defined space by the
a)
area of the space
b)
birth and death rates
c)
carrying capacity
d)
height of the space
21.
Nesting birds often space themselves evenly from other nests. This pattern is called
a)
clumped dispersion.
b)
uniform dispersion.
c)
random dispersion
d)
scatter dispersion
22.
A species described as r-strategist would definitely NOT have which of the following characteristics?
a)
clumped population pattern
b)
much parenting
c)
many offspring
d)
random population pattern
23.
__________ growth shows growth of a population under environmental constraints (carrying capacity-K) that sets a maximum population size 
a)
logistic
b)
exponential
c)
niche
d)
uniform
24.
________ grow slowly over time, cares for its young over a long period of time and is usually near the carrying capacity of its ecosystem.
a)
K-strategists
b)
R-strategists
c)
Uniform strategists
d)
environmentalists
25.
J-Shaped curves
a)
show a decline after an increase
b)
display populations that have reached carrying capacity
c)
represent exponential growth
d)
does not depend on the numbe rof resources
26.

Two male Giraffes are fighting over the last green leaf of a tree that is dying.

a)

Intraspecific Competition

b)

Mutualsim

c)

Predation

d)

Commensalism

e)

Interspecific Competition

27.
Represents the biotic potential of the species
a)
A
b)
B
c)
D
d)
E
28.
Population distribution is
a)
often clumped in response to predation
b)
used by wildlife managers when regulating hunting and fishing
c)
measured relative to other species
d)
uniform in most tree species
29.
Which is true about a population's carrying capacity?
a)
it is denoted as "C"
b)
it is usually used when studying ecosystems
c)
it depends on a limiting resource
d)
it is controlled by density-independent factors
30.
Which population is typically regulated by density-independent factors?
a)
algae
b)
predators
c)
Paramecium bacteria
d)
birds
31.
Which does NOT have a significant effect on the number of offspring produced by a population?
a)
population distribution
b)
sex ratio
c)
age structure
d)
population size
32.
The intrinsic growth rate of a population
a)
occurs at the population's carrying capacity
b)
depends on the limiting resources of the population
c)
increases as the population size increases
d)
decreases as the population size increases
33.
population growth using the exponential growth model
a)
increases at a constant rate
b)
applies to most populations only after a long time
c)
has an increasing intrinsic growth rate
d)
represents ideal conditions that rarely occur in natural populations
34.
An r-selected species characteristically has
a)
a type I survivorship curve
b)
few offspring
c)
a population near carrying capacity
d)
a fast population growth rate
35.
Which is true of a population overshoot?
a)
it occurs when reproduction quickly responds to changes in food supply
b)
it is followed by a die-off
c)
it is most likely to be experienced by K-selected species 
d)
it rarely occurs in species with type III survivorship curves
36.

Identify two main contributors for the dramatic increase in the world population over the last century.

a)

increased access to birth control

b)

development of modern medicine

c)

increased immigration

d)

introduction of the Industrial Revolution

37.

Closest to the current world population

a)

1 million

b)

1.4 billion

c)

7 billion

d)

330 million

38.

If a country has a crude birth rate of 22 and a crude death rate of 7, what is the Annual Growth Rate? AGR = (cbr-cdr)/10

a)

0.7%

b)

1.5%

c)

2.2%

d)

7.0%

39.

According to the graph, what can have the greatest impact on reducing global TFR?

a)

increasing access to healthcare

b)

increasing access to immigration

c)

women empowerment

40.

What is a group of organisms of one species that lives in the same area at the same time.

a)

community

b)

group

c)

population

d)

habitat

41.

What is the maximum number of individuals of one species that the environment can support?

a)

overload capacity

b)

top capacity

c)

population

d)

carrying capacity

42.

The part of the environlent that keeps a population's size at a level below its full potential

a)

limiting factor

b)

stopping factor

c)

carrying factor

43.
What is the carrying capacity of the following graph?
a)
1000
b)
8000
c)
800
d)
600
44.

When a population grows past the ecosystem's carrying capacity, what happens to the population?

a)

Continues to grow

b)

The population starts to die off to return to carrying capcity

c)

The population will go extinct due to lack of resources

45.

Which one is an effect of rural exodus?

a)

Overcrowded cities

b)

People eat better in rural areas

c)

There are more jobs in rural areas

46.

Which one shows the relation between population and square kilometres?

a)

Natural increase

b)

Life expectancy

c)

Population density

47.

What is the dispersion pattern of herding animals, birds that flock together, and fish that form schools?

a)

clumped

b)

random

c)

uniform

d)

unpredictable

48.

Which factor would be considered density independent?

a)

an intestinal parasite

b)

a fatal virus

c)

a severe drought

d)

severe overcrowding

49.

Which factor would be considered density dependent?

a)

competition

b)

drought

c)

water quality

d)

pH of the soil

50.

What is the horizontal line on the graph called?

a)

exponential growth

b)

geometric growth

c)

carrying capacity

d)

straight-line growth

51.

If angel fish produce hundreds of young several times a year, which statement below is true?

a)

Angelfish have a k-strategy reproductive pattern

b)

Angelfish have an r-strategy reproductive pattern

c)

Angelfish probably have a low mortality rate

d)

Angelfish provide a lot of care for their young

52.

The size, density, and birth and death rates of human population are studied during

a)

age structure graphs

b)

demography

c)

exponential growth

d)

k strategist reproduction

53.

What term refers to the number of males and females in various reproductive age groups?

a)

age structure

b)

carrying capacity

c)

reproductive dispersal

d)

birth rates

54.

Type III survivorship is characterized by

a)

extremely high juvenile mortality

b)

mortality that is not age dependent

c)

most mortality occurring among the elderly

d)

most juveniles surviving to a critical age

55.
The highest natural increase rates are found in countries in which stage of the demographic transition model (DTM)?
a)
Stage 1
b)
Stage 2
c)
Stage 3
d)
Stage 4
56.
The lowest crude birth rates (CBRs) are found in countries in which stage of the DTM?
a)
Stage 1
b)
Stage 2
c)
Stage 3
d)
Stage 4
57.
The highest CDRs are found in countries in which stage of the DTM?
a)
Stage 1
b)
Stage 2
c)
Stage 3
d)
Stage 4
58.
The population pyramid of Naples, Florida, is "upside down," because the city has a large percentage of:
a)
infants.
b)
females.
c)
elderly people.
d)
young people.
59.
Which section would see exponential population growth?
a)
1
b)
2
c)
3
d)
4
60.
The intrinsic growth rate of a population:
a)
directly affects environmental resistance.
b)
causes changes in birth rates without affecting death rates
c)
causes changes in death rates without affecting birth rates.
d)
is the maximum rate at which a population may increase.
61.
The human population is currently following roughly a j-shaped curve.  This means that the population is growing
a)
arithmetically.
b)
sigmoidally.
c)
at a decreasing rate.
d)
exponentially.
62.
Use Figure 7-1.  Population A would most likely be in which stage of demographic transition?
a)
Pre-Industrial
b)
Transitional
c)
Industrial
d)
Post-Industrial
63.
A country with an age distribution like that shown in the figure above, is most likely a country that
a)
Is expecting rapid growth
b)
Is experiencing slow or no population growth
c)
Is experiencing a high death rate
d)
Is a less-developed country
64.
The graph on the right best represents which country?
a)
USA
b)
Mexico
c)
Nigeria
d)
India
65.
Organisms that have gestation (pregnancy) periods and usually only give birth to one offspring at a time.
a)
Type 1
b)
Type 2
c)
Type 3
d)
Foxes
66.
Organisms that lay eggs, do no nurturing of their young and are adults for only short periods of time:
a)
Type 1
b)
Type 2
c)
Type 3
d)
Zebras
67.
Use Figure 10-1.  Urban populations increased approximately ____% from 1950 to 2000.
a)
3
b)
8
c)
40
d)
68
68.
Use Figure 10-1.  Urban populations increased approximately ____% from 1950 to 2000.
a)
3
b)
8
c)
40
d)
68
69.
The most critical factor in controlling human population growth is
a)
controlling reproductive lifespan.
b)
decreasing the age of first birth.
c)
decreasing the average number of births per woman.
d)
decreasing infant death.
70.
Which of the following characteristics are typical of r-selected species?
I. They produce many offspring in a short period of time.
II. They have very low survivorship early in life.
III. They take a long time to reach reproductive maturity.
a)
I only
b)
II only
c)
III only
d)
I and II
71.
Use Figure 7-1.  Population A is most likely:
a)
rapidly growing
b)
rapidly declining
c)
stable or close to stable
d)
going to decline in a few decades
72.
Use Figure 7-1.  Population A would most likely be in which stage of demographic transition?
a)
Pre-Industrial
b)
Transitional
c)
Industrial
d)
Post-Industrial
73.
According to the theory of demographic transition, countries move through growth phases in which order?
a)
stable growth, rapid growth, slow growth, declining growth
b)
rapid growth, slow growth, stable growth, declining growth
c)
slow growth, declining growth, rapid growth, stable growth
d)
slow growth, rapid growth, stable growth, declining growth
74.
Refer to the diagram of the survivorship curve.
Which curve best describes an organism that invests a lot of energy in parenting?
a)
A
b)
B
c)
C
d)
this is not a survivorship curve
75.
________ grow slowly over time, cares for its young over a long period of time and is usually near the carrying capacity of its ecosystem.
a)
K-strategists
b)
R-strategists
c)
Uniform strategists
d)
environmentalists
76.
A certain plant needs moisture, carbon dioxide, oxygen, light, and minerals to survive. This scenario shows that this particular living organism depends on .
a)
Biotic and Abiotc Factors
b)
Biotic Factors 
c)
Abiotic Factors 
d)
None of the Above
77.
An example of a population is
a)
all trees in a forest
b)
all maple trees in a forest
c)
all plants in a forest
d)
all animals in a forest
78.
World population growth will eventually stop when
a)
the population reaches 9 billion
b)
most countries have replacement level fertility rates
c)
most countries have higher death rates
d)
the worldwide infant mortality rate increases
79.
Over a long period of time, each pair of adults in a population had only two offspring and the offspring lived to reproduce, the population would...
a)
grow
b)
shrink
c)
remain the same
d)
disperse randomly
80.
Which of the following is NOT a strategy that could slow population growth?
a)
public advertising 
b)
economic incentives
c)
 legal punishments
d)
limiting education for women
81.
If the death rate of a population is greater than the birthrate, the population decreases.
a)
True
b)
False
82.
Exponential growth is slow and gradual.
a)
True
b)
False
83.
A group of different species that live together and interact in an environment are called a/an ________.
a)
community
b)
habitat
c)
population
d)
ecosystem
84.
If a population grows larger than the carrying capacity of the environment, the
a)
death rate may rise
b)
birth rate may rise
c)
death rate must fall
d)
birth rate must fall
85.

What would promote a high Total Fertility Rate (TFR)?

a)

Elimination of tax benefits for families with more than two children

b)

Free public housing to families with more than two children

c)

Government advocacy of abstinence to discourage teen pregnancy
