
 Worksheets
Production possibility curve
Total questions: 103
Worksheet time: 2hrs 4mins
For whom to produce is related to
What goods to be produced
Technique of Production
Distribution of Income
None of these


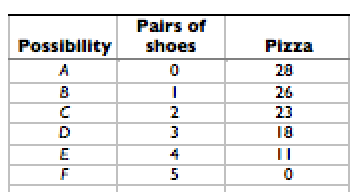
The table shows the production possibilities for a country. Based on the table, which of the following production combinations is a possibility?
28 pizzas and 5 pairs of shoes
3 pairs of shoes and 23 pizzas
2 pairs of shoes and 20 pizzas
4 pairs of shoes and 15 pizzas


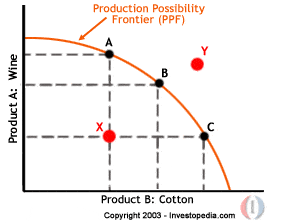

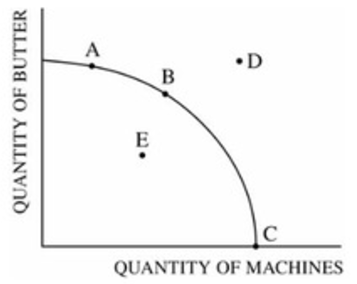

This graph shows potential costs of production when a company or country is efficiently using resources.
Production possibilities curve
trade offs
specialization
comparative advantage

The opportunity cost of shifting production from "Point E" to "Point C" would be:
30 cans of cola
30 chocolate bars
70 cans of soda
20 chocolate bars
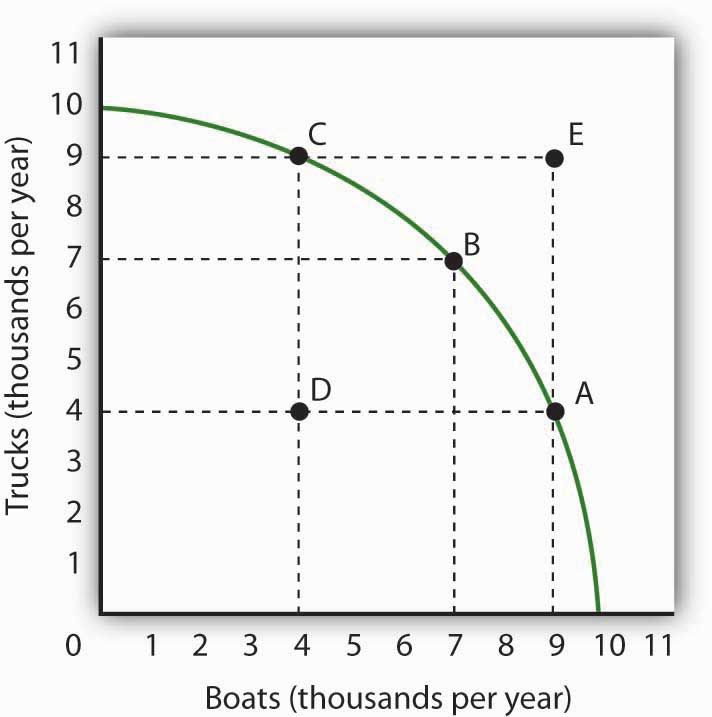
The opportunity cost of increasing truck production from point B to point C is...
can't have point E
2 thousand boats
2 thousand trucks
3 thousand boats
The opportunity cost of increasing production from point C to point A is...
1 thousand boats
2 thousand boats
5 thousand trucks
3 thousand trucks

If a natural disaster strikes, where would a production possibilities curve most likely shift?
No shift
To the left (as seen in Case 1)
To the right (as seen in Case 2)
all of the above


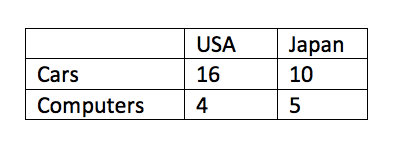


The economic problem is that
resources are limited and wants are limited.
resources are unlimited and wants are limited.
resources are limited and wants are unlimited.
resources are unlimited and wants are unlimited.
The opportunity cost of a good is
its price in dollars and cents.
the alternative goods forgone.
the price of alternative goods foregone.
none of the other options
The opportunity cost of Australian households moving away from coal-powered energy to solar-powered energy includes (i) the loss of jobs in the coal industry, (ii) a cleaner environment, (iii) reduced coal production.
(i), (ii) and (iii)
(ii) and (iii)
(iii) only
(i) and (iii)
A firm operating at 'X' produces 70 whips and 60 saddles. It changes production to 'Y' producing 20 whips and 90 saddles. The opportunity cost of this production change is
20 whips
30 saddles
50 whips
60 saddles
The production possibility curve shows
alternative combinations of two goods that an economy is capable of producing.
the actual levels of production of two goods that the economy is achieving.
alternative combinations of productive resources that can be used to produce two goods.
the total value of two goods produced in one time period.
If an economy is producing at a point inside its production possibility curve, then
consumption is greater than production.
productive resources are not used to their full potential.
production of capital goods is inadequate.
it cannot benefit by specialisation and trade.
When a country’s people and all its other resources are fully employed, which of the following must be true before more of any one item can be produced?
Less of another good or goods must be produced.
There must be a general rise in prices to encourage supply.
The government must intervene to produce needed products.
There must be a general fall in the general price level.
In terms of the production possibility curve, a decrease in unemployment would be best shown by
a movement along the curve.
an outward shift of the curve.
a movement from a point inside the curve to a point closer to the curve.
an inward shift of the curve.
Slope of production possibility curve is
Straight line
Convex to the point of origin
Concave to the point of origin
None of these
When an economy is operating on production possibility curve it indicates
Potential output = actual output
Potential output greater then actual out put
Potential output less than actual output
None of these
Increase in resources implies that production possibility curve
Shift to the right
Shift to the left
Rotates to the right
None of these
Production possibility curve is straight line in case of
Rising moc
falling moc
Constant moc
None of these
Concavity of production possibility curve implies
Increasing slope
Decreasing slope
Constant slope
none of thede
The shape of production possibility curve is changed by
Opportunity cost
Total cost
Marginal opportunity cost
None of these.
Slope of production possibility curve shows
Moc
Opportunity cost
Average cost
Total cost
Production possibility curve is a convex in case of
Constant Moc
Rising Moc
Falling moc
None of these
Rotation of the production possibility curve is due to
Increase in resources
Decrease in resources
Improvement in technology
All the above
Production possibility curve is a set of
Many goods
One good
Two goods
Three goods
Any point below production possibility curve shows
full utilisation of resources
Growth of resources
Under utilisation of resources
Effective use of resources
Any point in production possibility curve shows
Fully utilisation of resources
Attainable combination of resources
Efficient utilisation of resources
All the above

