
Font size
 Worksheets
Biology Semester one final review
Total questions: 66
Worksheet time: 2hrs 14mins

What is the pH that will cause this particular enzyme to have a higher rate of reaction?
(a)

Enzymes are substances that speed up the rate of chemical reactions. The rate of enzyme action is affected by several factors. A researcher studying these factors made this graph. Which would be an appropriate title for this graph?
Enzyme Action and Changes in pH
The Effect of Temperature on Enzyme Populations
How Enzyme Action Alters Temperature
The Effect of Temperature on Enzyme Action
A molecule is composed of chains of amino acids. The sequence of the amino acids determines the shape and the function of the molecule. Identify the molecule.
Protein
Carbohydrate
Lipid
Nucleic Acid

The diagram shows a molecule made up of chains of hydrogen, carbon, and oxygen. This molecule performs numerous roles in living organisms. What type of molecule does the diagram represent?
Lipid
Carbohydrate
Protein
Nucleic Acid

Identify the structures and processes at T.
Mitochondria
Chloroplast
Ribosomes
Cell membrane

Which one of the cells shown is eukaryotic?
The cell that contains the nucleus
The cell that contains the ribosomes
The cell that contains the ribosomes
The cell that contains the ribosomes

Why is a wolf a carnivore?
because it eats willow trees
because it eats dead animals
because it eats sand
because it eats other animals

Click on the picture of the graph. What is this graph showing?
Lynx and hare populations over time
Lynx and hare captures over time
Lynx and hare offspring over time
Lynx and hare speed over time

Which pattern is found in the graph?
The populations do not show a similar pattern
The populations cycle opposite of each other about every 10 years. When one increases, the other decreases
The populations cycle with each other about every 10 years. When one increases, the other also increases

Provide an example of an abiotic factor in the ocean ecosystem image.
coral
fish
water
microorganisms

Analyze the graph and describe the population over time of the lynx & the hare.
The hare population increases and the lynx population stays the same.
The lynx population increases and the hare population stays the same.
When the hare population increases, the lynx population increases and when the hare population decreases, so does the lynx.
The hare and lynx population stay the same over time.

Identify a predator/prey relationship in the food web.
grasshopper & butterfly
python & rat
fruit fly & corn
lavender & flowering plant

Look carefully at the image. If energy is lost as it moves up the food chain, what trophic level has the most amount of energy?
1st level - producers
2nd level - primary consumers
3rd level - secondary consumers
4th level - tertiary consumers

If producers in this food web have 2,000kCal of energy, how much of that would end up going to the herring (secondary consumers)?
200 kCal
20 kCal
2 kCal
0.2KCal

Which of the following would be the most likely effect, if there were a sudden increase in the cricket population?
There would be a decrease in the small bird population.
There would be a decrease in the grass/flowers population.
There would be a decrease in the mice population.
There would be an increase in the grass/flowers population.

As the elk decrease, what happens to the population of willow trees?
Increases
Decreases
Stays the same
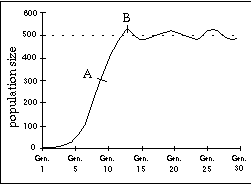
What is the carrying capacity of the graph?
around 500
more than 800
less than 300
around 700

What happens if a population grows past its carrying capacity?
The population keeps growing
The population starts to die off
The entire species will go extinct
The carrying capacity just increases
This may cause a population to increase
increase of food supply
removal of predators
removal of disease
all of these



The _ is an organized set of investigation procedures used by scientists.
scientific method
scientific law
scientific theory
A _ is an educated guess or testable prediction
control
hypothesis
dependent variable
A _ is a standard for comparison.
hypothesis
control
dependent variable
The factor that is adjusted by the experimenter is the _.
control
independent variable
dependent variable
The factor whose value depends on the independent variable is the _.
experiment
constant
dependent variable



