
 Worksheets
Unit 1 Test Review
Total questions: 80
Worksheet time: 7hrs 40mins
Which sentence is the claim?
Air is matter.
We found that the weight of the ball increases by .5lbs each time we pumped more air into it.
This shows that air has weight, one of the characteristics of matter.
Which sentence is the evidence?
Air is matter.
We found that the weight of the ball increases by .5lbs each time we pumped more air into it.
This shows that air has weight, one of the characteristics of matter.
Which sentence is the reasoning?
Air is matter.
We found that the weight of the ball increases by .5lbs each time we pumped more air into it
This shows that air has weight, one of the characteristics of matter.
Which of these is relevant evidence to this claim: Plants in bigger pots will grow taller.
The researchers placed plants in pots of different sizes and let them grow for one month.
Some plants grow taller than others when grown in large pots.
According to the data, a plant grown in a 5 cm pot only grew to be 4 cm tall, where as a plant in a 10cm pot grow to be 8 cm tall.
The researchers observed 10 plants total, 5 planted in smaller pots and 5 planted in larger pots.
Which reasoning explains the following evidence? "According to the data, a plant grown in a 5 cm pot only grew to be 4 cm tall, where as a plant in a 10cm pot grow to be 8 cm tall."
When plants are placed in a bigger pot, the roots have more room to spread out, making it more optimal for a plant to grow taller.
Sometimes, plants just enjoy being in a bigger pot. When a plant enjoys its pot more it will grow taller
No one really knows why, it just happened.
The evidence supports the claim that plants grow taller in a bigger pot because a plant grown in a 5 cm pot only grew to be 4 cm tall, where as a plant in a 10cm pot grow to be 8 cm tall.
Which options provide relevant evidence to support the claim that students who get less sleep are more likely to perform poorly in academics. (Select up to two)
According to the study, students who went to sleep later, causing them to get less sleep, scored an average of 30% lower on their exams.
The claim of an article I read in another class was that students who sleep less do poorly on tests.
Students reported feeling more sluggish over all, making it hard to focus and do well on their exams.
According the the study, the kids were sleepy. When I am sleepy, I also do poorly on my assignments.
Which reasoning explains the following evidence? "According to the study, students who went to sleep later, causing them to get less sleep, scored an average of 30% lower on their exams."
When a person has had less sleep they can have a harder time remembering things, focusing, and reading. All of these can result in mistakes on an exam which could explain the lower score.
When a person has had less sleep they are often in a bad mood. Exams also put people in a bad mood.
I got an A on my last history test after studying all night, so maybe they did the experiment with people who are bad at studying?
The evidence supports the claim that people who get less sleep do poorly on exams because students who went to sleep later, causing them to get less sleep, scored an average of 30% lower.
If the prompt is, "Is there a best color notebook to use for your science class?", which of the following would make a good claim?
Yes, there is a best color but I'm not telling.
There is no single "correct" color to use for a science notebook.
There is only one correct color to use as a notebook for any subject.
I have always used purple notebooks for science class.
If the prompt is, "Do students who sleep get better grades?
No, students who sleep do not study.
Students who are well rested are likely to be able to focus, remember information, and participate in class.
I will test this by sleeping in class.
Yes, I think so.
What does CER stand for
Certainty, Experience, Reality
Circular, Experiment, Rotation
Crime, Expedition, Revolution
Claim, Evidence, Reasoning

What is a quantitative observation you can make about the picture you just saw?
The blocks are made of wood
That they block are light brown
The blocks are about 15.5 cm long
That the block longer than they are wide and wider than they are tall

Which is a qualitative observation made about this forest?
The average tree diameter is 500 cm
The light that filters through the trees are in the 510 nm range
The forest floor is a healthy green color
Average height of the trees is 50 ft.
Match the following quantities and units of measurement
kilograms
mass
Meters
Length
Degrees Celsius
Temperature
Liters
Volume
Seconds
Time
Match the following quantities and units of measurement
Milligrams
mass
Millimeters
Length
Degrees Kelvin
Temperature
Milliliters
Volume
Milliseconds
Time

A student recorded that the metal bar is 7.1 cm long. what part of this measurement is the uncertainty digit?
There are no uncertainty digits.
1 is the uncertainty digit
7 is the uncertainty digit
Both 7 and 1 are uncertainty digits
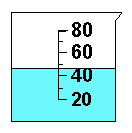
Which of the following is the best estimate of the volume of the liquid including the uncertainty digit? The volume markings on the beaker are in Milliliters.
48 mL
48.2 mL
48.25 mL
50 mL

What is mass of the measurement above including the uncertainty digit?
21.16 g
21.164 g
21 g
21.1643 g

What is the length of this object including your uncertainty digit?
3.2 cm
3.12 cm
3 cm
3.219 cm

What is the temperature indicated by this thermometer? Include your uncertainly digit.
24.2 °C
24.05 °C
24 °C
25 °C
A student measures this metal bar. Which of the following is an accurate measurement including the uncertainty digit?
7 cm
7.1 cm
7.05 cm
7 km
Identify independent, dependent and control variables for the following experiment:
Does the amount of candy offered as payment affect how much laundry my little sister will fold?
Candy offered (measured in pieces)
Independent Variable
Pairs of socks folded
Dependent Vaiable
amount of time after eating a meal
Control Variable
Identify independent, dependent and control variables for the following experiment:
Does the height above the ground a phone is dropped from affect how much damage the screen has from the drop?
height above the ground
Independent Variable
Size of cracks in the screen
Dependent Vaiable
Surface the phone is dropped onto (stone tiles, wood floors, carpet, grass).
Control Variable
Choose the best hypothesis for "What is the effect of putting Cooking Spray on the bottom of a sled?"
I think I will fall off the sled more often.
If I put Cooking Spray on the bottom of my sled then the sled will get very hot while it slides.
If I put Cooking Spray on the bottom of my sled it will be more slippery and let me slide faster

A scientist hypothesizes the the temperature at which an alligator's egg is incubated will determine whether the alligator will be male or female. The independent variable is
the male alligators
the gender of the alligator
the temperature
the incubator

A scientist hypothesizes the the temperature at which an alligator's egg is incubated will determine whether the alligator will be male or female. The dependent variable is
the temperature
the size of the baby alligators
the incubator
the gender of the baby alligators

A students was doing an experiment using the scientific method. One plant is placed in dim light and the other is placed in bright light. Every three days the student plans to count the green leaves. Which would be a good hypothesis for this experiment?
Neither plant will grow, they only grow in sunlight
If plants are places in bright light, then they will grow more green leaves than in dim light.
If plants are place in clay pots, then they will grow more green leaves than plastic pots.
If plants are in warmer temperatures, then they will grow more green leaves.
What materials would be needed to conduct the following experiment "What is the effect of putting Cooking Spray on the bottom of a sled?" Select all that are correct.
Cooking Spray
A snowy hill to slide down and the distance the sled will move.
A sled with a rider
A stopwatch or phone to find how long it takes to slide down the hill.
A cool teacher
What materials would be needed to conduct the following experiment "How does the brightness of a grow light affect how many leaves a plant grows?" Select all that are correct.
At least two plants
A room with a stable temperature
Dim and bright grow lights
A stop watch
Sunny Weather
Re order the following steps to create an experimental procedure to test the hypothesis that plants will grow more leaves in bright light.
Select 8 plants of the same type and size and place 4 in the dim light and 4 in the bright light.
Clip each plant so that they have the same number of leaves.
Allow the plants to grow for three months with all plants getting the same amount of water and fertilizer
Count the number of leaves on each plant and record this number.
Place your data into a visual organizer like a graph or table to show your results.
Re order the following steps to create an experimental procedure to test the hypothesis that chocolate ice cream has more mass than vanilla ice cream
Select 20 measuring cups, measure and record the mass of each one.
Carefully fill each cup so that 10 are filled with vanilla and 10 are filled with chocolate
Record the mass of each filled cup and then subtract the mass of the measuring cup to find the mass of the ice cream.
Average the masses of the 10 cups of vanilla ice cream. Then average the masses of the 10 cups of chocolate ice cream.
Report your findings and clean up
Find the average of the numbers below:
3, 2, 1, 3, 2, 1, 3, 2, 1, 3, 2, 1
3
2
1
4
Find the average of the numbers below:
1, 8, 7, 5, 6, 4, 7, 6
5
5.5
6
6.5
Find the average of the numbers below:
20, 30, 24, 32
26.5
27.5
27
27.5

Student A
Student B
Student C
Cannot be determined

High Accuracy & High Precision
High Accuracy & Low Precision
Low Accuracy & High Precision
Low Accuracy & Low Precision
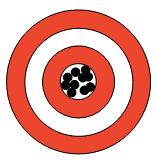
This bullseye demonstrates...
High Accuracy & High Precision
High Accuracy & Low Precision
Low Accuracy & High Precision
Low Accuracy & Low Precision
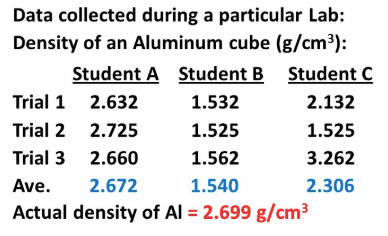
Which student is the most ACCURATE?
A
B
C
A group of students are using a ruler to measure the diameter or a power cable. Which of the following is a possible source of error? (select all three correct answers)
The students do not keep the wire straight and measures a diagonal section.
Three different students measure the wire power cable and then average their results.
The students don't place one side of the cable at the zero on the ruler and forget calculate the change from start to finish.
The students use the inches side of the ruler but record their result as centimeters.
A group of students are using a scale to measure the mass of a cookie. Which of the following is a possible source of error? (select both correct answers)
The students forget to zero the scale between trials
The students take turns putting the cookie on the scale.
The students use the same cookie for every trial.
A students takes a bite out of the cookie between trials.
Which of the following could be sources of error for future labs in our class that you might not be able to control or avoid? Mark all that apply.
Hint: These sources of error are the reason we conduct multiple trials and then average the results.
Measuring incorrectly with our tools.
Not reading the directions before starting.
imperfect equipment introducing random variables
lack of practice with procedures leading to small mistakes by the experimenter.
Reorder the following units from largest to smallest
Kilogram
gram
centigram
milligram
Reorder the following units from largest to smallest
Kilometer
meter
centimeter
millimeter
Convert 23 centimeters into meters
0.023m
2300m
0.23m
23,000m
Convert 1 kilometers into millimeters
1,000,000 mm
1,000 mm
0.001 mm
0.000001 mm
Convert to scientific notation:
520,000,000
52 x 107
5.2 x 10⁷
5.2 x 10⁸
0.52 x 10⁹
.000457
457 x 106
457 x 10-6
4.57 x10⁴
4.57 x 10⁻⁴
The distance from Venus to Earth is 2.61 x 10⁸ kilometers. What is this distance in standard notation?
261,000
261,000,000
261.8
26,100,000,000
Rank the following from the largest to smallest measurements of distance
1 km
1x10² m
1 m
1 cm
1 mm
Rank the following from the largest to smallest measurements of distance
1 km
1 m
1 cm
1 mm
3.2x10⁻⁵ m
Rank the following from the largest to smallest measurements of distance
1x10³m
3 m
1x10⁻²m
3 mm
3.2x10⁻⁵ m
Which of the following are Scalar Quantities (select all that apply)
Time
Velocity
Displacement
Mass
Which of the following are Vector Quantities (select all that apply)
Time
Velocity
Distance
Mass
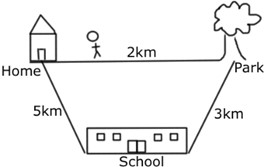
Jerry walked from home to school, then from the school to the park. What is his total distance?
2 km
5 km
8 km
10 km

If you walk from your home in the figure above to the library and then to the park. What is your displacement
0.75km
1.35km
1.7km
2.0 km
Her distance and displacement are both zero.
Her distance is zero, but her displacement is 200 meters.
Her distance is 200 meters, but her displacement is zero.
Her distance and displacement are both 200 meters.
v
The variable for Velocity
sm
The Units for Velocity
t
The variable for time
s
The unit for time
v=tΔd
The equation for finding velocity
Δd=v⋅t
The equation for finding displacement from velocity
t=vΔd
The equation for finding time from velocity
Δ
The symbol for change
Jose walked 4 km in a straight line at 2 km/hr. How long did Jose walk for?
2 hours
8 hours
0.5 hours
2 km
A vehicle travels 2345 m in a straight line toward the evening sun for 315s. What is its velocity?
7.44 m/s
0.13 m/s
738,675 m/s
7.44m
What the car's displacement be after traveling with a velocity 18 m/s travel for 3600 seconds?
77.7 km
64.8 km
51.7 km
67.7 km

What is the independent variable for this graph?
iPhone Charging Speed
Time (minutes)
Capacity (% charged)
The origin

What is the dependent variable for this graph?
Leona's Job Earnings
Newspapers Delivered
Total Pay (dollars)
There isn't one.

What is the IV?
Hours of Sunlight Exposure
Number of Tomatoes on Each plant
Size of the tomatoes
number of clouds each day

If you were graphing this table on a grid that had 10 available spaces horizontally and vertically which of the following options would make the easiest to read and most accurate graph?
every horizontal space is worth 4.5 hours. Every vertical space is worth $0.5
every horizontal space is worth 1 hours. Every vertical space is worth $36
every horizontal space is worth 5 hours. Every vertical space is worth $10
every horizontal space is worth 0.5 hours. Every vertical space is worth $4.5
If you were to graph this data set and your graph had 10 vertical lines to place your data on, how much would each line need to be worth to get an easy to read graph?
Each line should always be worth 1 and I can use a ruler to extend the graph space.
If I count by twos it will be easy to estimate the odd numbers half way between lines and I'll have enough space.
I can place 3 on the first line, 8 on the second, 11 on the third, 8 again on the fourth. I'll only need 6 of the lines.
The first number is 3 so I should count by 3s.

Which data table matches the graph.


Which data table matches the graph.


Which graph matches the data table?


Which statement below accurately represents the graph?
as the hours worked increases the dollars earned increases at an increasing rate
as the dollars earned increases the hours work decreases.
as the hours worked increases the dollars earned increases at a constant rate
as the hours worked increases the dollars earned decreases at a constant rate
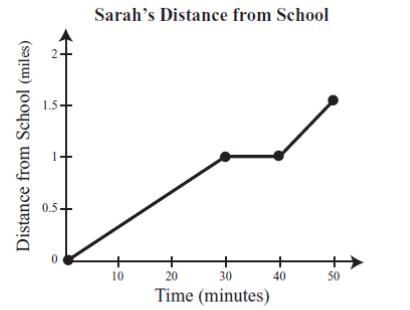
Which of the following is the best interpretation of the graph shown?
Sarah travels towards school at a slower constant rate for 30 min, is stopped for 10 min, and then travels quickly for 10 min
Sarah travels away from school at a slower constant rate for 30 min, is stopped for 10 min, and then travels quickly for 10 min
Sarah speeds up as she moves away from school, except where she got stuck at a red light.
Sarah has a friend who lives 30 minutes away from school.

Which dot diagram best reflects the motion shown?


Match the dot diagrams to the motions shown in the animation
Red Car
Green Car

Blue Car

The observer watching them

Which dot diagram best reflects the motion shown?
Match the following Dot Diagrams with the type of motion they show

At Rest

Moving with a Constant Velocity
Speeding Up

Slowing Down
Match the following Graphs with the type of motion they show

At Rest

Moving with a Constant Velocity

Speeding Up

Slowing Down
Match the following Graphs with the type of motion they show

At Rest

Moving with a Constant Velocity

Speeding Up

Slowing Down
Match the following Data Tables with the type of motion they show

At Rest

Moving with a Constant Velocity

Speeding Up

Slowing Down
Which diagrams show acceleration
Which Graphs show Constant Velocity?


Which data tables show acceleration?



