
 Worksheets
APES Unit 3 Populations Review
Total questions: 95
Worksheet time: 1hrs 29mins
What is the difference between exponential growth and logistic growth in population models?
Exponential growth occurs in urban areas, while logistic growth occurs in rural areas
Exponential growth is slower than logistic growth
Exponential growth is unlimited, while logistic growth is limited.
Logistic growth is only seen in plants, while exponential growth is only seen in animals
Define carrying capacity and explain its significance in population ecology.
The average population size that an environment can sustain indefinitely.
The maximum population size that an environment can sustain indefinitely.
The minimum population size that an environment can sustain indefinitely.
The maximum number of species in an environment.
What factors influence population distribution?
Religion and cultural practices
Distance from the equator
Climate, resources, economic opportunities, and government policies
Education level and literacy rate
Explain the concept of population dynamics and provide an example.
The concept of population dynamics can be illustrated by the growth and decline of a population of rabbits in a forest ecosystem.
The concept of population dynamics can be illustrated by the behavior of individual animals.
The concept of population dynamics can be illustrated by the changes in weather patterns.
The concept of population dynamics can be illustrated by the migration patterns of birds.
What is the demographic transition and what are the stages involved?
The stages involved are: Stage 1 - high birth and death rates, Stage 2 - high birth rates and declining death rates, Stage 3 - declining birth rates and low death rates, Stage 4 - low birth and death rates.
Stage 3 - increasing birth rates and low death rates
Stage 2 - low birth rates and increasing death rates
Stage 1 - low birth and death rates
What are the limitations of the exponential growth model in predicting real population growth?
The model is not based on real data
The model does not account for limiting factors such as resource availability and environmental constraints.
The model is too complex to understand
The model only works for small populations
How does immigration and emigration affect population size and distribution?
Both immigration and emigration can affect population size and distribution by either increasing or decreasing the number of people in a specific area.
Immigration and emigration both only affect population distribution, not size
Immigration has no impact on population size and distribution
Emigration only affects population size, not distribution
Discuss the impact of human activities on population dynamics and carrying capacity.
Carrying capacity and population dynamics are not affected by human activities.
Human activities always increase carrying capacity and improve population dynamics.
Human activities have no impact on carrying capacity or population dynamics.
Human activities can decrease carrying capacity and negatively impact population dynamics.
Explain the concept of age structure and its relevance in demographic transition.
Age structure is important in understanding population growth and potential changes in demographic transition.
Age structure is irrelevant in understanding population changes
Age structure has no impact on demographic transition
Age structure only affects the economy, not population growth
What growth model has an S-shaped curve?
Logistic
Exponential
What growth model has an J-shaped curve?
Logistic
Exponential
When a population has unlimited resources, and it continues to grow to its FULL LIVING POTENTIAL, it is called
Peak
Top shelf
Resource controlled limit
Biotic potential
factors that affect a population depending on its size
- these include food, predation, parasitism, and disease
Density-Dependent factor
Density-Independent factors
affect all populations similarly regardless of population size. Examples include: natural disasters, rapid climate changes (drought or floods), and human activity and disturbances
Density-Dependent factors
Density-Independent factors
Describes how many individuals of different ages make up a population
Age Structure
Age Layout
The youths collation
Age Spread
Which population has the greatest potential for rapid growth?
Populations with a large number of middle aged individuals
Older populations
Populations with large numbers of young offspring
None of these
Population pyramids measure:
Age and Gender
Gender and Race
Age and Race
Land size

What age groups does the bottom of a population pyramid represent?
The elderly
The working adults
The children
Males

What growth rate does this population pyramid represent?
Rapid Growth
Slow Growth
Negative Growth
Zero Growth

Is this country Developed or Developing?
Developed
Developing
Which of the following are density dependent factors?
competition for resources
predation
disease
natural disasters
Which of the following are examples of a density independent factors?
forest fire
seasonal cycles
storms
disease
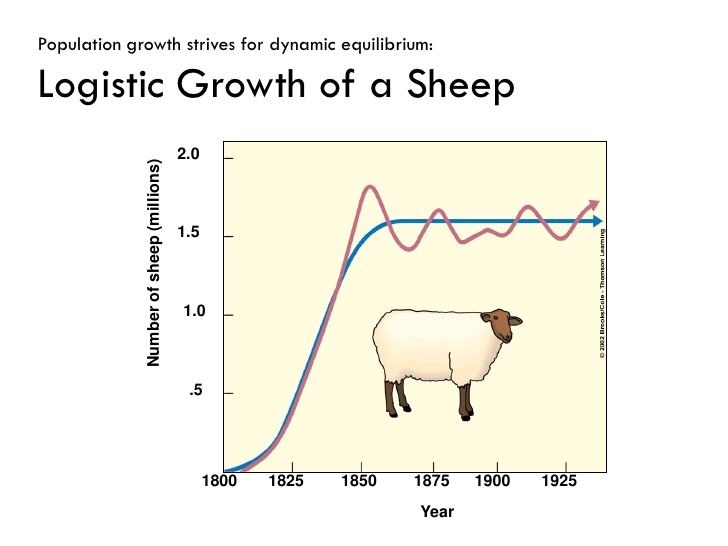

What factor describes when populations decrease because animals are moving out of a population?
Emigration
Limiting Factors
Immigration
Exponential Growth

What point on the graph represents the carrying capacity?
A
B
C
D

Tracks organisms that tend to live long lives (low death rate and high survivorship rate); toward the end of their life expectancies, however, there is a dramatic increase in the death rate.
Type I
Type II
Type III
Type IV
Describes organisms with a high death rate (or low survivorship rate) immediately following birth. Examples include bacteria, fishes, and invertebrates.
Type I
Type II
Type III
Type IV
These organisms typically live in unstable, unpredictable environments & are able to reproduce rapidly (exponentially). They do not take care of their young & are subject to predation.
k-strategist
r-strategist
m-strategist
s-strategist
These organisms occupy stable environments, are larger in size and have longer life expectancies. They produce, during their life spans, fewer offspring, but place a greater investment in each.
k-strategist
r-strategist
m-strategist
s-strategist

A pattern of survival over time in which there is a relatively constant decline in survivorship throughout most of the life span.
Type ii survivorship
Type i survivorship
Type iii survivorship
Human population growth in 2020 was 0.98 %. If this growth were to remain constant in what year will the human population double?
2051
2091
2109
9120
Human population growth of Mozambique in 2021 was 2.8. If growth remains constant, in what year will the human population double?
(a)
In 2004 China's CBR was 11.8 the CDR was 6.3. what is the growth rate for China in 2004?
0.38%
0.49%
0.55%
0.68%
Which of the following is most typically associated with the transition form a rural to an urbanized society?
Reduced birth rates
Reduced need for sewage-treatment facilities
Increased rates of population growth
Increased air quality in urban areas
Increased stabilization of microclimate in urban areas.
Which describes the birth and death rate of Stage 3 of the DTM?
The death rate is decreasing and birth rate remains high
Both the death and birth rate are high
The death rate is low but the birth rate is high
Both the birth rate and death rate are decreasing
Which describes the birth and death rate of Stage 2 of the DTM?
The death rate is decreasing and birth rate remains high
Both the death and birth rate are high
The death rate is low but the birth rate is high
Both the birth rate and death rate are decreasing

In Stage 1, the birth rate is...
High
Falling
Low

In Stage 1, the death rate is...
High
Falling
Low

In Stage 2, the Total Population is...
Growing Slowly
Growing Quickly
Not Growing

In Stage 3, the Birth Rate is...
High
Dropping quickly
Low

In Stage 4, the Death rate is...
High
Rising
Low
In Stage 4, the Population Pyramid looks like...


What stage is this country in?
Stage 1
Stage 2
Stage 3

Which correctly describes the term demographic transition?
The transition from low birth rates and death rates to high birth rates and death rates as a country develops.
The transition from high birth rates and death rates to low birth rates and death rates as a country develops.
The transition from high birth rates to low death rates as a country develops.
The transition from low birth rates to high death rates as a country develops.
What is population growth?
Decrease in the number of individuals in a population over time.
The average number of individuals in a population.
The movement of individuals from one population to another.
Increase in the number of individuals in a population over time.
Define population distribution.
The number of people in a given area or region.
The average age of people in a given area or region.
The number of males and females in a given area or region.
Pattern or spread of people in a given area or region.
What is population density?
Population density is the number of individuals per unit area or volume.
Population density is the average age of a population.
Population density is the number of individuals per unit time.
Population density is the total number of individuals in a population.
Explain carrying capacity.
The minimum number of individuals an environment can support sustainably.
The average number of individuals an environment can support sustainably.
The maximum number of individuals an environment can support unsustainably.
Maximum number of individuals an environment can support sustainably.
How does population distribution affect ecosystems?
Population distribution only affects the physical environment of ecosystems.
Population distribution affects ecosystems by determining the availability of resources, competition for those resources, and the overall balance of species within the ecosystem.
Population distribution has no impact on ecosystems.
Population distribution only affects the behavior of individual organisms within ecosystems.
What are the different methods used to calculate population density?
Multiplying the total population by the total land area
Adding the total population and the total land area
Subtracting the total population from the total land area
Dividing the total population by the total land area, dividing the total population by the total number of households, and dividing the total population by the total area of a specific region.
How do population dynamics impact biodiversity?
Population dynamics have no impact on biodiversity.
Biodiversity is solely determined by external factors and not influenced by population dynamics.
Population dynamics only impact the size of individual species, not overall biodiversity.
Population dynamics impact biodiversity by influencing the abundance and distribution of species within an ecosystem.

Which one would represent a country that has a high birth rate and death rate?
A
B
C
The most common kind of dispersion in nature is
clumped
uniform
random
unknown

What is the approximate population of men age 65-69 in the US in 2014? (see image)
7.5 million
10.5 million
5 million
12 million
A graph that shows the number or proportion of individuals surviving to each age for a given species or group.
survivorship curve
exponential
linear
logistic

A population is...
All members of one species in one area
All members of all species that live in one area
All of the living and nonliving things in an area
None of these

What is happening at the 'A' on the graph?
the population overshoots above the carrying capacity
the population stops growing
growth begins to slow down due to limited resources
growth is speeding up due to an abundance of resources


This age structure diagram most likely represents which country?
Kenya
U.S.
Nigeria
Guatemala

Figure C shows an age structure diagram for a population that is _________?
diminishing
expanding
stable
birthrate is higher than deathrate
Population growth will be lowest when...
infant mortality=low; life expectancy= high
infant mortality=low; life expectancy=low
infant mortality=high; life expectancy= high
infant mortality=high; life expectancy=low
Which is the correct order of the Demographic Transition Model?
Pre-Industrial, Transitional, Industrial, Post-Industrial
Pre-Industrial, Industrial, Transitional, Post-Industrial
Transitional, Pre-Industrial, Post-Industrial, Industrial
Post-Industrial, Transitional, Industrial, Post-Industrial
What is the total fertility rate?
average number of children a male fathers in his lifetime
average number of children a female has during her lifetime
average number of children a female has during her twenties
average number of children on Earth
Which factor below is least likely to affect birth and fertility rates today?
number of people 60 or older
cost of raising and educating children
religious beliefs
educational and employment opportunities for women
average age at marriage
A metropolitan region of 100,000 people has 2000 births, 500 deaths, 200 emigrants, and 100 immigrants over a 1-year period. Its population growth rate is
1.2 percent.
1.4 percent
1.6 percent.
1.8 percent.
2.0 percent.
Even if a country reduces its birth rate and maintains replacement-level fertility, its population will still continue to grow for several decades because of
lower death rates
increased income.
population momentum
better health care.
increased life expectancy.
Which of the following countries best exemplifies phase 4 of a demographic transition?
Argentina
China
India
Mexico
Japan
Using the rule of 70, a population growing at 10% would double in
7 years
10 years
17 years
15 years
not enough information to tell
Populations whose age structure diagrams are narrower at the bottom than at the top have
high death rates
the same proportion of individuals in each age group
a declining population
a high growth rate
all of the above

Main reason for the population increase in the United States
increase in immigration
improvement in healthcare
lower infant mortality rate
lower total fertility rate

How many years would it take a country to double its population with a growth rate of 35%?
1
2
35
70

Identify two main contributors for the dramatic increase in the world population over the last century.
increased access to birth control
development of modern medicine
increased immigration
introduction of the Industrial Revolution

Closest to the current world population
1 million
1.4 billion
8 billion
330 million

If a country has a crude birth rate of 22 and a crude death rate of 7, what is the Annual Growth Rate? AGR = (cbr-cdr)/10
0.7%
1.5%
2.2%
7.0%

According to the graph, what can have the greatest impact on reducing global TFR?
increasing access to healthcare
increasing access to immigration
women empowerment
Which one shows the relation between population and square kilometres?
Natural increase
Life expectancy
Population density
What is the dispersion pattern of herding animals, birds that flock together, and fish that form schools?
clumped
random
uniform
unpredictable

What is the horizontal line on the graph called?
exponential growth
geometric growth
carrying capacity
straight-line growth



