
 Worksheets
statistics and probability
Total questions: 177
Worksheet time: 6hrs 58mins
Choose the correct examples of discrete variable.
A film critic's rating of a film (0 - 4 stars)
The sum of the numbers rolled on a pair of dice
Time taken to commute to work
Winning ticket number drawn from a raffle
Amount of gasoline a car
Given a random variable X between 0 and 3, if P(0) = .15, P(1) = .2, P(2)= .3, P(3) =?
0.65
0.45
0.35
0.25

From the following Prob Dist, which of these is most likely the mean?
0.31
22
100
25
How to find the standard deviation of a random variable or SD (X)?
Get the sum of (x multiplied by the probability of x
The square root of variance (X)
The expected value of X2 subtract the expected value of X, squared
Get the sum of (x squared multiplied by the probability of x)
A Random Variable X can take only two values, 1 and 2P(1) = 0.8 and P(2) = 0.2. Calculate the Expected value of X.
0.5
1
1.2
1.5
A Random Variable X can take only two values, 1 and 2P(1) = 0.8 and P(2) = 0.2. Calculate the variance of X.
0.16
0.4
0.26
0.76
A cubical die is biased. The numbers one to five are equally likely to land face up, but six is twice as likely to land face up as each of the other numbers.If X is the score shown on the uppermost face, calculate the expected value of X.
3
3 4/7
3 1/2
3 6/7
Two fair coins are tossed.If Y represents the number of tails, what is the Expected Value of Y?
0.5
1.5
1
2

1.1611
1.0775
1.0775
1.414
X 0 1 2 3 4 5
P(X) 0.24 0.37 0.20 0.11 0.05 0.03
What is the probability that a randomly chosen household has at least two cars?


The table above shows the number of cell phones per household in a small town. Find the mean round to the nearest hundredth.
2.80
2.93
0.10
0.14
What expected value does this broker assign to this stock's end-of-the-year price?

A discrete random variable X has the probability distributions shown in the table. Find the value of k. (Remember that a valid probability distribution must add up to 1)
1/3
7/12
1/12
1/4

Determine which of the following distribution is NOT a probability distribution. (Remember that a valid probability distribution must add up to 1)
A
B
C
D

Is this a probability distribution?
No, the sum of p(x) does not equal 1.
Yes, all p(x) are between 0 and 1.
No, all p(x) are not between 0 and 1.
Yes, the sum p(x) is 1.

The table above shows a television station's advertisement sales. The distribution of sales for one 24-hour day is given. Solve for the mean. Round to the nearest hundredth.
31.8
15.68
0.20
1.00
The table above shows a television station's advertisement sales. The distribution of sales for one 24-hour day is given. Solve for the standard deviation. Round to the nearest hundredth.
35.76
268.1
16.3
1279.35
Classify the random variables as discrete or continuous: The number of defective computers produced by a manufacturer
Discrete
continuous
either
neither
Classify the random variables as discrete or continuous: The weight of new-born each year in a hospital
Discrete
continuous
either
neither
Classify the random variables as discrete or continuous: The speed of a car
Discrete
continuous
either
neither
Classify the random variables as discrete or continuous: The time needed to finish the test.
Discrete
continuous
either
neither
Which of the following is NOT a discrete random variable?
Height of eggplant as measured each day.
A number of refrigerators sold each day.
A number of late comers in going to school each day.
A number of people who went to the Rizal Park from Monday to Friday.
Which of the following is a discrete random variable?
Jose has four sisters.
Jose is 163 cm tall.
Jose weighs 68 kilograms.
Jose ran 300 meters in one and a half minutes.
Which of the following is NOT a continuous random variable?
The height of the airplane’s flight.
The amount of liquid on a container.
The length of time for the check up in the hospital.
The number of clients of a certain insurance company each day.
Which of the following variables is a discrete random variable?
The amount of unleaded gasoline in a Suzuki car.
The temperature of a cup of coffee served at a coffee shop.
The number of boys in a randomly selected two-child family.
The average amount spent on electric bill every month of May by a randomly selected household in Quezon Province.
You decided to order a pizza but you have to choose the type of crust and the toppings. If there are only six possible combinations of ordering a pizza, from which of the following should you choose?
Crust: thin or deep dish
Toppings: cheese or pepperoni
Crust: thin or deep dish
Toppings: cheese, bacon, or pepperoni
Crust: thin or deep dish
Toppings: cheese, bacon, sausages, or pepperoni
Crust: thin or deep dish
Toppings: cheese, bacon, sausage, pepperoni, or hotdog
You decided to conduct a survey of families with two children. You are interested in counting the number of girls (out of 2 children) in each family. Is this a random variable?
Yes, it is a random variable.
No, it is not a random variable.
Maybe, it is a random variable.
Cannot be determined.
X is the number of heads when a fair coin is flipped 12 times
Find P(X = 4)
0.12
0.19
0.81
0.93
Find the mean of a binomial distribution with n=50 and p=0.4
50
4
20
10

The probability distribution for the random variable x is shown in the table


Paul expected to receive 4 emails in a week.Find the probability of receiving 6 emails for the next 2 weeks?
0.1221
0.1912
0.3134
0.6866
0.8088
Identify the distribution defined:
The number of cars randomly arriving at a car wash during a 20-minute interval.
Poisson
Binomial
Geometric
Hyper geometric
Identify the distribution defined:
If electricity power failures occur with an average of 3 failures every twenty weeks, calculate the probability that there will not be more than one failure during a particular week.
Poisson
Binomial
Geometric
Hyper geometric
Which distribution is described by predicting the number of girls among 10 children randomly selected from a group of 16 girls and 12 boys?
Binomial
Uniform
Hypergeometric
Geometric
Suppose 2% of all credit card transactions are fraudulent. If there 50 transactions per day, Which distribution can be use to find out the probability that at least 2 transactions are fraudulent?
Uniform
Binomial
Geometric
Hypergeometric
An urn contains 3 red ball and 5 green balls. You randomly choose 4 balls. Which distribution can be use to find out the probability that you choose exactly 2 red balls?
Uniform
Binomial
Geometric
Hypergeometric
In a given week, the probability that a certain company experiences a network failure is 10%. Which distribution can be use to find out the probability that the company will experience 5 weeks without a network failure?
Uniform
Binomial
Geometric
Hypergeometric
Suppose we randomly pick a card from a deck, then, without replacement, randomly pick another card from the deck. Which distribution can be use to find out the probability that both cards are Queens?
Uniform
Binomial
Geometric
Hypergeometric
What is the probability of getting exactly 6 questions correct on this test?
What are other example of continuous variables?
Height of the students
number of patients in the hospital
number of petals in a flower
length of your hair
If we want to calculate the probability of rolling a 6 for the first time on the 6th roll of a die, would we use the geometric or the binomial distribution?
geometric
binomial
When rolling a fair die 100 times, what is the probability of rolling a "4" exactly 25 times? Is this an example of binomial or geometric?
binomial
geometric
Which one of these variables is a discrete random variable?
Time it takes a randomly selected student to complete a multiple choice exam.
The heights of randomly selected students in the class.
Distance between the students' home and school.
Number of pairs of shoes a randomly selected person owns.
No, there is not a defined success/failure


A test consists of 10 multiple choice questions with five choices for each question. As an experiment, you GUESS on each and every answer without even reading the questions.
What is the probability of getting exactly 6 questions correct on this test?
(10C6)(1/5)6(4/5)4
(10C5)(1/5)6(4/5)4
(10C6)(1/5)6(4/5)5
(10C5)(1/6)5(5/6)5
Suppose that a quiz consists of 20 True-False questions. A student hasn't studied for the exam and will just randomly guesses at all answers (with True and False equally likely). How would you find the probability that the will student get 8 or fewer answers correct?
Find the probability that X=8 in a binomial distribution with n = 20 and p=0.5.
Find the area between 0 and 8 in a uniform distribution that goes from 0 to 20.
Find the probability that X=8 for a normal distribution with mean of 10 and standard deviation of √5
Find the cumulative probability for 8 in a binomial distribution with n = 20 and p = 0.5.
X 50 20 5
P(X) 0.1 0.3 0.6
A certain type of battery has a 0.5% failure rate. Find the probability that a shipment of 1,000 batteries has more than two defective batteries.
0.876
5
2.2304
0.9599
The answer is not listed
When you add a positive constant to a random variable the effects on the random variables distribution are as follows:
the shape is changed, the mean is increased by a value of "a" and the standard deviation is unchanged.
the shape and standard deviation are unchanged and the mean is increased by a value of "a".
all three aspects are unchanged
the shape and mean are unchanged and the standard deviation is increased by a value of "a".
Multiplying a random variable by a positive constant "b" affects the distribution of the random variable as follows:
the shape is unchanged, measures of center and spread, both, are multiplied by "b".
the shape, measures of center and measures of spread are all multiplied by "b".
the shape and measures of center are unchanged, the measures of center are multiplied by "b".
there is no change in the distribution.
The distribution of random variable R has mean 10 and standard deviation 4. The distribution of random variable S has mean 7 and standard deviation 3. If R and S are independent, what are the mean and standard deviation of the distribution of R + S?
Mean = 17
Standard deviation = 7
Mean = 3
Standard deviation = 1
Mean = 1.43
Standard deviation = 1.33
Mean = 17
Standard deviation = 5
A random variable X has a mean of 120 and a standard deviation of 15. A random variable Y has a mean of 100 and a standard deviation of 9. If X and Y are independent, approximately what is the standard deviation of X – Y?
24.0
17.5
12.0
6.0
4.9
A random variable X has a mean of 120 and a standard deviation of 15. A random variable Y has a mean of 100 and a standard deviation of 9. If X and Y are independent, approximately what is the mean of X – Y?
1.2
20
220
-20
The mean weight of a dog is 34 pounds with a standard deviation of 6.7 pounds. The mean weight of a cat is 12 pounds with a standard deviation of 3.1 pounds. If you have 2 dogs and 1 cat, what is the mean and standard deviation of their total weight?
80, 9.969
80, 16.5
46, 7.382
46, 16.5
The mean weight of a bag checked in at Southwest Airlines is 36 pounds with a standard deviation of 3.5 pounds. If two random bags were checked, what is the mean and the standard deviation of the weights of the two bags?
36, 4.95
36, 7
72, 4.95
72, 7
The expressions "n choose k" or nCk are used to describe
the number of combinations of k things from a group of n things
the number of combinations of k things from a group of 17 things
the number of permutations of k things from a group of n things
the number of combinations from a group of zero things, which is obviously 1.
X is the number of calls reaching a person that a random-digit dialling machine makes out of 15 attempted calls. The accepted chance of reaching a person through a randomly-dialled call is .12. Which of the following demonstrates the "B" of BINS?
A set of exactly 15 calls is attempted.
The call either reaches a person or does not.
Each call completed doesn't change the odds of reaching the next person.
A person is reached randomly in 12% of attempts.
The formula for P(X=x) for a binomial random variable with number of trials n and a given number of successes x is
nCx
px
(1-p)(n-x)
nCx (p)x (1-p)(n-x)
An opinion poll calls residential telephones at random with a 12% chance of reaching a live person. X is a count of the number of calls out of 15 trials that do actually reach a person. Which of the following is NOT true of the mean of X.
1.8 is the expected number of calls to reach a live person when many many sets of 15 phone calls are made.
MeanX = 1.8
MeanX = np = 15 * .12
Exactly 1.8 calls out of every 15 must be made before a person is reached.
We can use a Normal Distribution to model a Binomial Setting if the Large Counts condition is met. This means that
np≥10
n(1−p)≥10
np≥10
n(1−p)≥10
n<.10N
When taking a random sample, trials in can be treated as independent if
the 10% Condition is met and the sample size is less than 10 percent of the population size.
Large Counts is met and the number of expected successes and failures are at least 10.
we sample without replacement.
the expected value is small.
The shape of a Binomial Distribution
is impossible to know.
is always approximately Normal.
is always skewed right.
can be determined by making a histogram with the discrete random variable on the horizontal axis and the probability on the vertical axis.
The shape of a Geometric Distribution is
always skewed left.
always skewed right.
always approximately Normal.
usually Uniform.
In which of the following situations would it be appropriate to use a Normal distribution to approximate probabilities for a binomial distribution with the given values of n and p?
n = 10
p = 0.5
n = 100
p = 0.2
n = 40
p = 0.88
n = 100
p = 0.99
The z-table gives the percent of data at or below a z-score.
True
Sometimes true, sometimes false
False

What is the value of the mean on this Normal Curve?
6
34
52
70
What is the standard deviation on this Normal Curve?
6
12
34
18
What does it mean to have a z-score of z=0 on a quiz?
It means you did better than zero people.
It means you scored the same grade as the average grade.
It means you earned a zero on the quiz.
It means the average score was a zero.

What percent of scores are below a z-score of z=2.34 ? (Use Table A)
99.04%
0.96%
98.93%
97.68%
What percent of values are less than 46? (Use Table A or Empirical Rule)
16%
84%
46%
12.5%

What percent of scores are at or below a z-score of z=1.42 ? (Use Table A)
92.22%
.9222%
92.07%
.9207%
The distribution of heights of young women aged 18 to 24 is approximately N (64.5, 2.5).
What percent of young women have heights between 62 and 72 inches?
About 50%
About 99.85%
About 16%
About 84%

A data set has a mean of 290 and a standard deviation of 20. Calculate the z-score for an x value of 265.
z=250.5
z=1.25
z=−1.02
z=−1.25

A data set has a mean of 20 and a standard deviation of 3. Calculate the z-score for 23.
z=−1
z=16.33
z=1
z=3
Find the z-score for 75 given a mean of 60 and a standard deviation of 6.
-2.5
2.5
-1.15
1.15
What shape is a normal distribution curve?
Half curve
Rhombus curve
Bell curve
Square curve
A town's average snowfall is 48 inches per year with a standard deviation of 6 inches. Using a Normal model, what values should border the middle 50% of the model?
44 and 52 inches
42 and 54 inches
40 and 50 inches
40 and 60 inches

Suppose the amount of soda in a can is normally distributed; the mean is 16 oz and standard deviation is 0.4 oz. How much soda is in the heaviest 3% of cans?
≈16.97 oz
≈16.75 oz
≈16.45 oz
≈16.30 oz
Find the z-score with 40% of the observations falling below it.
z=-0.25
z=-0.33
z=0.25
z=0.33
The mean GPA of students in a course at UGA is 3.2 with a standard deviation of 0.3. What percent of students in the course have a GPA between 2.9 and 3.8?
81.5%
47.5%
68%
95%

The ages of the population of people living in the Atlanta area are normally distributed with a mean of 43 and a standard deviation of 14.
The town has a population of 5,000. How many would you expect to be aged between 29 and 57?
This Standard Normal Distribution curve may help you solve this problem.
1750
3860
3400
4330
A town's average snowfall is 48 inches per year with a standard deviation of 6 inches. Using a Normal model, what percent of snow fall amounts will be between 40 and 50?
53.93%
46.07%
37.19%
72.34%
A bank's loan officer rates applicants for credit. The ratings can be described by a Normal model with a mean of 200 and a standard deviation of 50. What is the rating which cuts off the bottom 20%?
157.92
242.08
189.34
190.60
What does the mean tell you about a data set
It tells you the number that occurs the most
It is the difference between the highest and lowest number
It tells you the average of the data set
It tells you how mad someone is at another person
What is the total area under the curve of a standard normal curve?
0
1
-1
cannot be determined
Which of the following is the symbol for sample size?
r
n
σ
X
Which of the following is the symbol for population size?
r
n
σ
X
Which of the following is the symbol for population standard deviation?
r
n
σ
X
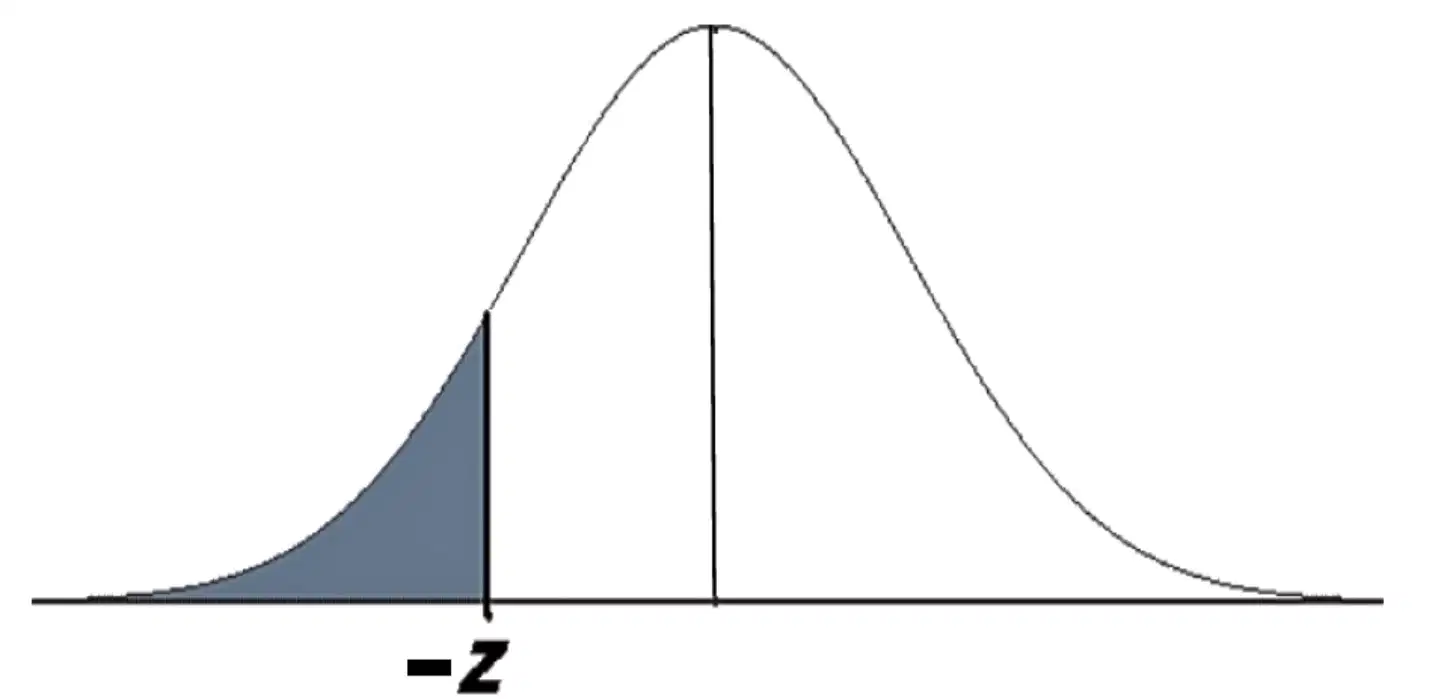
What is the required area as depicted by the shaded region of the given figure?
At least z
Less than -z
Greater than z
To the right of -z
What is the correct step in getting the area between z = -1 and z = 1?
Add the area of z = -1 and z = 1.
Get the difference between the areas of z = 0 and z = 1.
Multiply the area of z = 1 to itself.
Subtract the area of z = -1 and z = 1.
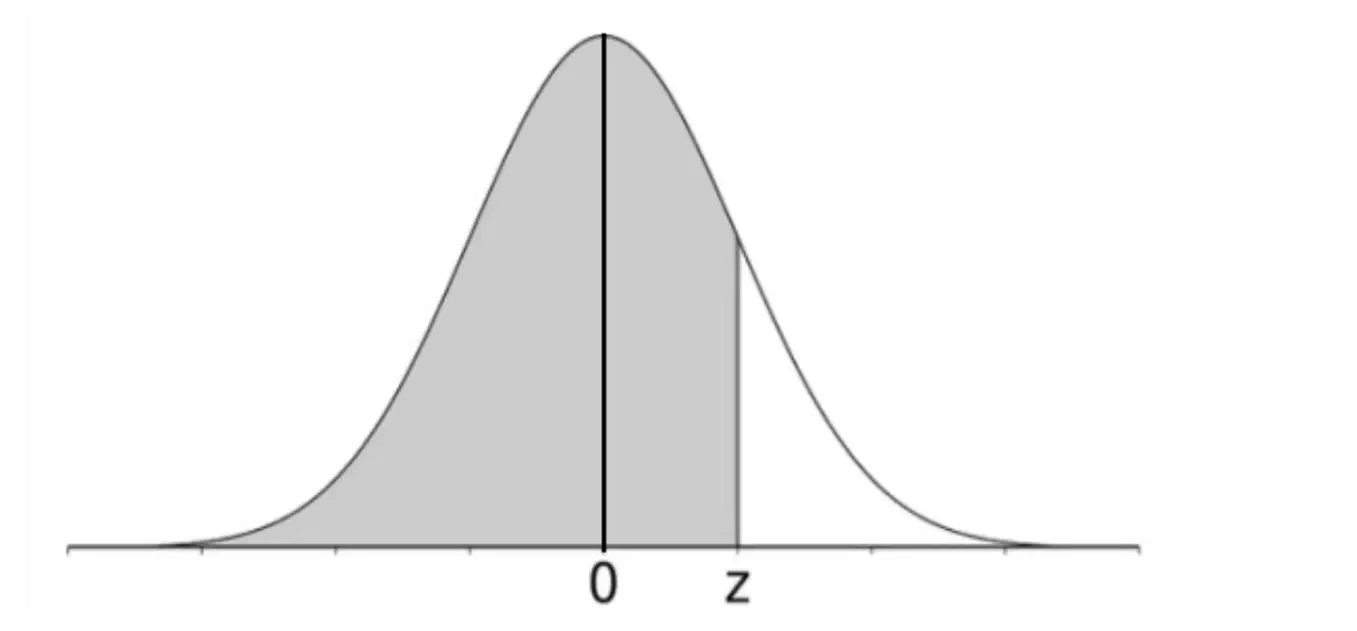
What is the area of the shaded region in the given figure if z = 1?
0.1587
0.3413
0.5000
0.8413
What does it mean to have a z-score of z = 0 on a quiz?
It means your score is below average.
It means you earned a zero on the quiz.
It means you scored the same grade as the average grade.
It means your score is above average.
What does it mean to have a z-score of z > 0 on a quiz?
It means your score is below average.
It means you earned a zero on the quiz.
It means you scored the same grade as the average grade.
It means your score is above average.
What does it mean to have a z-score of z < 0 on a quiz?
It means your score is below average.
It means you earned a zero on the quiz.
It means you scored the same grade as the average grade.
It means your score is above average.
If waist sizes are normally distributed, estimate the proportion of teenagers who will have waist sizes greater than 31 inches?
Mensa International is a non-profit organization that accepts only people with IQ score within the top 2%. What level of IQ qualifies one to be a member of Mensa?
Suppose a male long jumper's jump ranked in the 75th percentile. How long was his jump?
About what percent of the products last between 12 and 15 days?
If I tell you that you scored at the 55th percentile on your final exam, you would know:
55% of the class scored the same or worse than you did
You earned a 55% on the exam
You failed the exam
45% of the class scored worse than you did
Given the data set: 1, 2, 3, 6, 9, 11, 45, 102, calculate the percentile rank for 11.
70th percentile
62.5th percentile
72.5th percentile
75th percentile
The average speed of 1500 vehicles traveled on a stretch of highway that day is 67 miles per hour with a standard deviation of 3.5 miles per hour. If 100 vehicles are randomly selected as samples, what would be the mean of the resulting sampling distribution of sample means?
63.5
67
70.5
74
The average speed of 1500 vehicles traveled on a stretch of highway that day is 67 miles per hour with a standard deviation of 3.5 miles per hour. If 100 vehicles are randomly selected as samples, what would be the standard error of the resulting sampling distribution of sample means?
0.52
0.43
0.34
0.25
A population has a mean of 60 and a standard deviation of 5. A random sample of 16 measurements is drawn from this population. Describe the sampling distribution of the sample means by computing its mean. Assume that the population is infinite.
60
65
70
75
A population has a mean of 60 and a standard deviation of 5. A random sample of 16 measurements is drawn from this population. Describe the sampling distribution of the sample means by computing its standard deviation. Assume that the population is infinite.
5.00
3.75
2.50
1.25
The 300 customers who called the call centre spend an average of 45 minutes on hold, with a standard deviation of 12 minutes. What is the expected average of the sampling distribution for a sample of 150 randomly selected customers?
33
45
57
69
The 300 customers who called the call centre spend an average of 45 minutes on hold, with a standard deviation of 12 minutes. What is the standard error of the sampling distribution for a sample of 150 randomly selected customers?
0.70
0.69
0.58
0.49
The heights female college students are normally distributed with mean of 68 inches and standard deviation of 3 inches. If 25 students are randomly drawn from the population, what would be the expected mean of the resulting sampling distribution of the means?
68
59
40
31
The heights female college students are normally distributed with mean of 68 inches and standard deviation of 3 inches. If 25 students are randomly drawn from the population, what would be the standard error of the resulting sampling distribution of the means?
0.8
0.7
0.6
0.5
In a population of five university students with GPAs of 2.5, 2.3, 1.7, 1.4, and 1.1, a sample of three students are considered. What would be the mean of the resulting sampling distribution?
1.9
1.8
1.7
1.6
In a population of five university students with GPAs of 2.5, 2.3, 1.7, 1.4, and 1.1, a sample of three students are considered. What would be the standard deviation of the resulting sampling distribution?
0.56
0.41
0.34
0.22
What is the mean of the sampling distribution of p-hat?


What is the mean of the sampling distribution?
What is the standard deviation of the sampling distribution?

In one region of the country, the mean length of stay in hospitals is 5.5 days with standard deviation 2.6 days. Because many patients stay in the hospital for considerably more days, the distribution of length of stay is strongly skewed to the right. Consider random samples of size 100 taken from the distribution with the mean length of stay, x, recorded for each sample. Which of the following is the best description of the sampling distribution of x ?
Strongly skewed to the right with mean 5.5 days and standard deviation 2.6 days
Strongly skewed to the right with mean 5.5 days and standard deviation 0.26 day
Strongly skewed to the right with mean 5.5 days and standard deviation 0.026 day
Approximately normal with mean 5.5 days and standard deviation 2.6 days
Approximately normal with mean 5.5 days and standard deviation 0.26 day
Which of the following pairs of sample size n and population proportion p would produce the greatest standard deviation for the sampling distribution of a sample proportion p?
n = 1,000 and p close to 0
n = 1,000 and p close to 1
n = 1,000 and p close to 1/2
n = 100 and p close to 0
n = 100 and p close to 1/2
A biologist wants to estimate the difference between the mean body lengths of green and brown stinkbugs. A random sample of 20 green stinkbugs has a mean body length of 16.22 millimeters (mm) and a standard deviation of 1.34 mm. A random sample of 20 brown stinkbugs has a mean body length of 13.41 mm and a standard deviation of 0.73 mm. What is the standard error of the difference (green - brown) between the sample means?


Researchers will conduct a study of the television-viewing habits of children. They will select a simple random sample of children and record the number of hours of television the children watch per week. The researchers will report the sample mean as a point estimate for the population mean. Which of the following statements is correct for the sample mean as a point estimator?
A sample of size 25 will produce more variability of the estimator than a sample of size 50.
A sample of size 25 will produce less variability of the estimator than a sample of size 50.
A sample of size 25 will produce a biased estimator, but a sample size of 50 will produce an unbiased estimator.
A sample of size 25 will produce a more biased estimator than a sample of size 50.
A sample of size 25 will produce a less biased estimator than a sample of size 50.

Suppose that 25 percent of women and 22 percent of men would answer yes to a particular question. In a simulation, a random sample of 100 women and a random sample of 100 men were selected, and the difference in sample proportions of those who answered yes, was calculated. The process was repeated 1,000 times. Which of the following is most likely to be a representation of the simulated sampling distribution of the difference between the two sample proportions?


According to government data, 22 percent of children in the United States under the age of 6 years live in households with incomes that are classified at a particular income level. A simple random sample of 300 children in the United States under the age of 6 years was selected for a study of learning in early childhood. If the government data are correct, which of the following best approximates the probability that at least 27 percent of the children in the sample live in households that are classified at the particular income level? (Note: z represents a standard normal random variable.)


Employees at a large company can earn monthly bonuses. The distribution of monthly bonuses earned by all employees last year has mean 2.3 and standard deviation 1.3. Let z represent the standard normal distribution. If x represents the mean number of monthly bonuses earned last year for a random sample of 40 employees, which of the following calculations will give the approximate probability that x is less than 2 ?


In a national study on transportation patterns, 1,000 randomly selected adults will be asked the question: How many trips per week do you make to the grocery store? The sample mean will be computed. Let µ denote the population mean response to the question if everyone in the population is to be asked the question. Is the sample mean x unbiased for estimating µ?
Yes, because for random samples the mean (expected value) of the sample mean x is equal to the population mean µ.
Yes, because with a sample size of 1,000 the standard deviation of the sample mean x is small.
Yes, because the wording of the question is not biased.
No, because the sample mean x does not always equal the population mean µ.
No, because number of trips to the grocery story is not normally distributed so the mean (expected value) of the sample mean x does not equal the population mean µ.
Let X be a random variable that has a skewed distribution with mean µ = 10 and standard deviation σ = 10. Based on random samples of size 400, the sampling distribution of X is
highly skewed with mean 10 and standard deviation 10
highly skewed with mean 10 and standard deviation 5
highly skewed with mean 10 and standard deviation 0.5
approximately normal with mean 10 and standard deviation 10
approximately normal with mean 10 and standard deviation 0.5
There were 5,317 previously owned homes sold in a western city in the year 2000. The distribution of the sales prices of these homes was strongly right-skewed, with a mean of $206,274 and a standard deviation of $37,881. If all possible simple random samples of size 100 are drawn from this population and the mean is computed for each of these samples, which of the following describes the sampling distribution of the sample mean?
Approximately normal with mean $206,274 and standard deviation $3,788
Approximately normal with mean $206,274 and standard deviation $37,881
Approximately normal with mean $206,274 and standard deviation $520
Strongly right-skewed with mean $206,274 and standard deviation $3,788
Strongly right-skewed with mean $206,274 and standard deviation $37,881
A recent study was conducted to investigate the duration of time required to complete a certain manual dexterity task. The reported mean was 10.2 seconds with a standard deviation of 16.0 seconds. Suppose the reported values are the true mean and standard deviation for the population of subjects in the study. If a random sample of 144 subjects is selected from the population, what is the approximate probability that the mean of the sample will be more than 11.0 seconds?
0.1151
0.2743
0.7257
0.8849
Based on the values of the true mean and true standard deviation, it can be concluded that the population distribution is not normal and therefore the probability cannot be calculated.

The histogram below represents data obtained after the census of an entire population was conducted. The sampling distribution of the sample mean based on samples of size 2 for the population was simulated, and a histogram of the results was produced. Which of the following histograms is most likely the histogram of that sampling distribution?


The normal curve shown represents the sampling distribution of a sample mean for sample size n = 25, selected at random from a population with standard deviation sd. Which of the following is the best estimate of the standard deviation of the population, sd ?75
3
6
15
30
75

Two random samples, A and B, were selected from the same population to estimate the population mean. For each sample, the mean, standard deviation, and margin of error for a 95 percent confidence interval for the population mean are shown in the table. Which of the following could explain why the margin of error of sample A is greater than the margin of error of sample B?
The sample size of A is greater than the sample size of B.
The sample size of A is less than the sample size of B.
The sample size of A is equal to the sample size of B.
The mean of sample A is greater than the mean of sample B.
The standard deviation of sample A is less than the standard deviation of sample B.

The histograms show the results of three simulations of a sampling distribution of a sample mean. For each simulation, 1,500 samples of size n were selected from the same population and the sample mean was recorded. The value of n was different for each of the three simulations. Which of the following is the correct ordering of the graphs from least value of n to greatest value of n ?
A, C, B
B, A, C
B, C, A
C, A, B
C, B, A
A manufacturer of cell phone batteries claims that the average number of recharge cycles for its batteries is 400. A consumer group will obtain a random sample of 100 of the manufacturer’s batteries and will calculate the mean number of recharge cycles. Which of the following statements is justified by the central limit theorem?
The distribution of the number of recharge cycles for the sample is approximately normal because the population mean of 400 is greater than 30.
The distribution of the number of recharge cycles for the sample is approximately normal because the sample size of 100 is greater than 30.
The distribution of the number of recharge cycles for the population is approximately normal because the sample size of 100 is greater than 30.
The distribution of the sample means of the number of recharge cycles is approximately normal because the sample size of 100 is greater than 30.
The distribution of the sample means of the number of recharge cycles is approximately normal because the population mean of 400 is greater than 30.

These symbols represent the mean and standard deviation for which of the following distributions?
The Population
The Sample
The Sampling Distribution

These symbols represent the mean and standard deviation for which of the following distributions?
The Population
The Sample
The Sampling Distribution
What is the standard deviation of the sampling distribution?
What is the mean of the sampling distribution?
What is the probability of selecting one data value less than 190?
What is the probability of selecting 25 data values with a mean less than 190?
What is the standard error of the sampling distribution?
What is the probability of selecting 64 data values with a mean between 195 and 200?
What is the probability of selecting 100 data values with a mean greater than 202?
What is the variance of the sampling distribution?
What is the mean of the sampling distribution?
Identify the Sample:
A restaurant wants to know if their customers buy dessert when they eat out. As people leave the restaurant one evening, 20 people are surveyed at random. Eight people say they usually order dessert when they eat out. The restaurant concluded that most customers do not order dessert.
20 customers
All customers
8 customers
Dessert

