
 Worksheets
Test- Chp 1: The Nature of Science
Total questions: 42
Worksheet time: 21mins
Name
Class
Date
1.
___________ is a method for studying the natural world and a process that uses observation to gain knowledge about the events in nature.
a)
Curiosity
b)
Measurement
c)
Technology
d)
Science
2.
Which branch of science studies the interaction between matter and energy?
a)
Psychology
b)
Physical Science
c)
Biology
3.
A series of steps used to solve a problem or learn about the natural world is the
a)
Scientific theory
b)
Scientific method
c)
Independent variable
4.
A _____ is a possible logical explanation for a question using what is known and what is observed. It is sometimes called an “educated guess”.
a)
Hypothesis
b)
Conclusion
c)
Thesis
d)
Theory
5.
Graphing data can help you detect
a)
Hypothesis
b)
Patterns
c)
Experiments
d)
Theories
6.
To study which fertilizer makes plants grow faster, a scientist would conduct a(n)
a)
Problem
b)
Theory
c)
Scientific law
d)
Experiment
7.
Both are well tested, but a _____ explains and a _____ describes processes in nature.
a)
Hypothesis/ Scientific law
b)
Theory/ experiment
c)
Theory/ Scientific law
8.
The prefix centi- means
a)
1,000
b)
0.01 (one hundredth) or 1/100
c)
0.001 (one thousandth) or 1/1000
d)
100
9.
The prefix kilo- means
a)
1,000
b)
100
c)
0.01 (one hundredth) or 1/100
d)
0.001 (one thousandth) or 1/1000
10.
The prefix milli- means
a)
0.01 (one hundredth) or 1/100
b)
100
c)
0.001 (one thousandth) or 1/1000
d)
1,000,000
11.
Which type of graph would be best to plot how data changes over time?
a)
Bar graph
b)
Line graph
c)
Pie chart
d)
None of the above
12.
The best type of graph to use to show how a whole quantity is broken down into parts is a
a)
Pie chart
b)
Line graph
c)
Bar graph
d)
All of the above
13.
Which metric unit should you use to measure the length of the hallway?
a)
Liter
b)
Meter
c)
Gram
d)
Yards
14.
Which metric unit would you use the measure the volume of water in a bottle?
a)
Gram
b)
Miles
c)
Meters
d)
Liter
15.
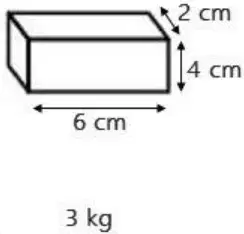
What is the volume of this rectangular solid? (LxWxH)
a)
3 kg
b)
12 cm³
c)
48 cm³
d)
642 mL
16.
Which metric unit would you use to measure the mass of a block of metal?
a)
Meter
b)
Seconds
c)
Grams
d)
Liter
17.
The lowest possible temperature is
a)
-273 Kelvin
b)
absolute zero
c)
0 ℃
18.
At what temperature does pure water freeze?
a)
32°C
b)
0°C
c)
0 K
d)
0°F
19.
The amount of matter an object contains is its
a)
Mass
b)
Length
c)
Volume
d)
Temperature
20.
The amount of space occupied by an object is its
a)
Weight
b)
Height
c)
Mass
d)
Volume
21.
In a controlled experiment, how many variables are changed between groups?
a)
0
b)
1
c)
At least 5
22.
Any variable that does NOT change in an experiment is a(n)
a)
Dependent variable
b)
Constant
c)
Manipulated variable
d)
Independent variable
23.
Anything that can change in an experiment is called a...
a)
measurement
b)
observation
c)
variable
d)
qualitative
24.
The 1st step in the scientific method is to...
a)
Ask a question
b)
Make a Hypothesis
c)
Test hypothesis
d)
Draw conclusions
25.
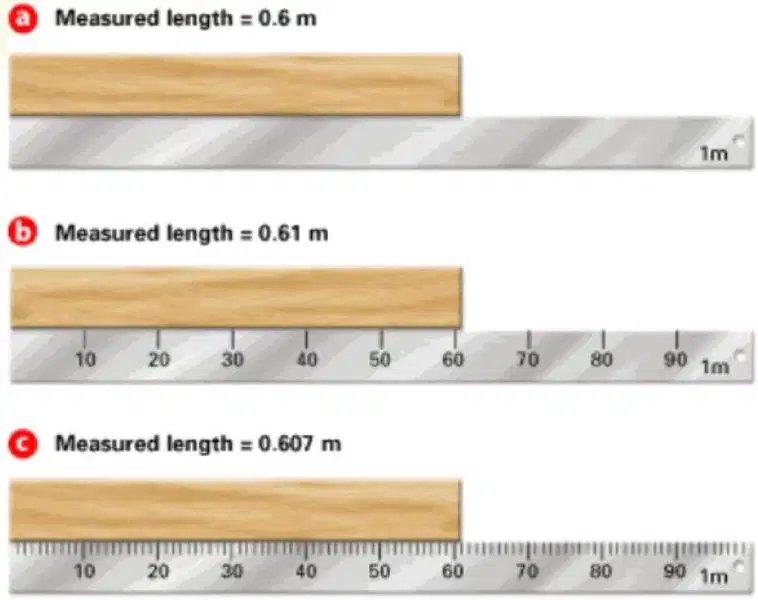
Which ruler would give the most precise measurement?
a)
a
b)
b
c)
c
26.

What is the independent variable (AKA manipulated variable) in the experiment below?
a)
Student grades
b)
Types of music
c)
The test
27.

What is the dependent variable (AKA responding variable) in the experiment below?
a)
Student grades
b)
The test
c)
Types of music
28.

What is the control group in the experiment below?
a)
1st hour
b)
2nd hour
c)
3rd hour
d)
4th hour
29.

Which would be a constant in the experiment?
a)
the students
b)
the test
c)
the music
d)
the grades
30.

What is the independent variable (AKA manipulated variable)?
a)
Temperature
b)
Number of chirps
c)
Number of crickets
31.

What is the dependent variable (AKA responding variable)?
a)
Number of crickets
b)
Temperature
c)
Number of chirps
32.
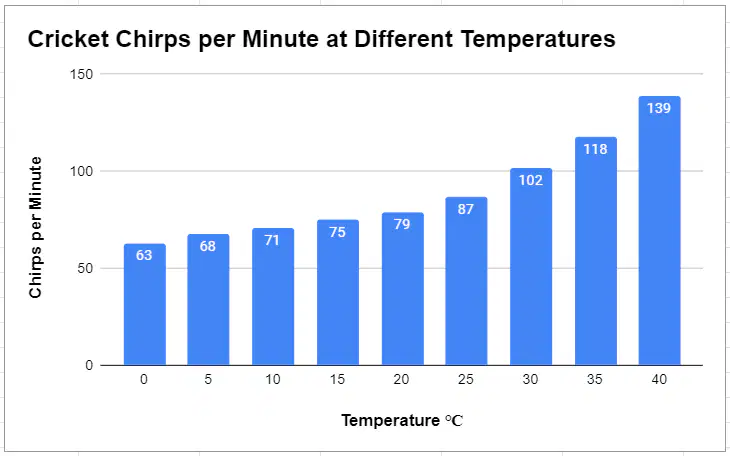
What type of graph is shown?
a)
Scatterplot
b)
Line graph
c)
Circle graph
d)
Bar graph
33.
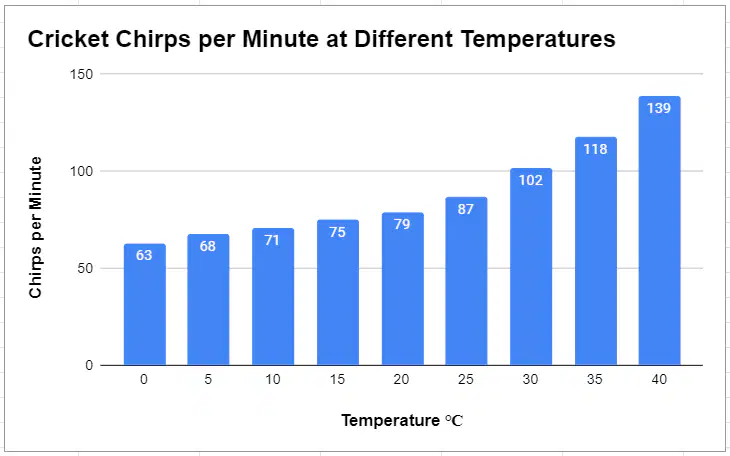
What type of data is shown in the graph?
a)
Quantitative
b)
Qualitative
34.
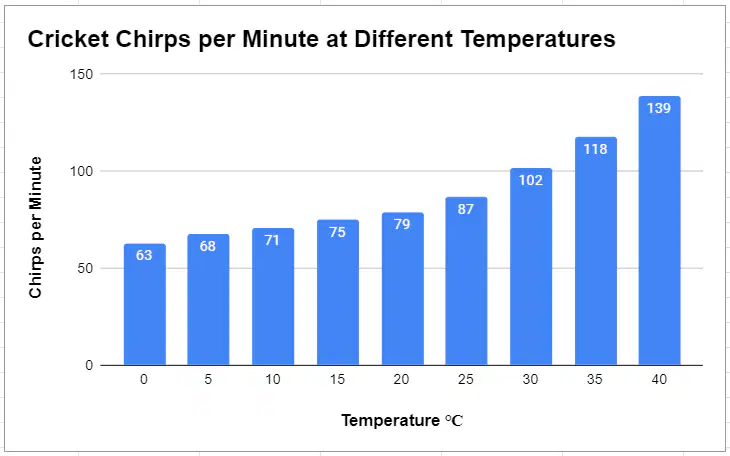
Based on the data, what should the student’s conclusion be?
a)
Higher temperatures result in more chirps per minute
b)
Higher temperatures result in fewer chirps per minute
c)
Lower temperatures result in more chirps per minute
d)
The results are inconclusive
35.
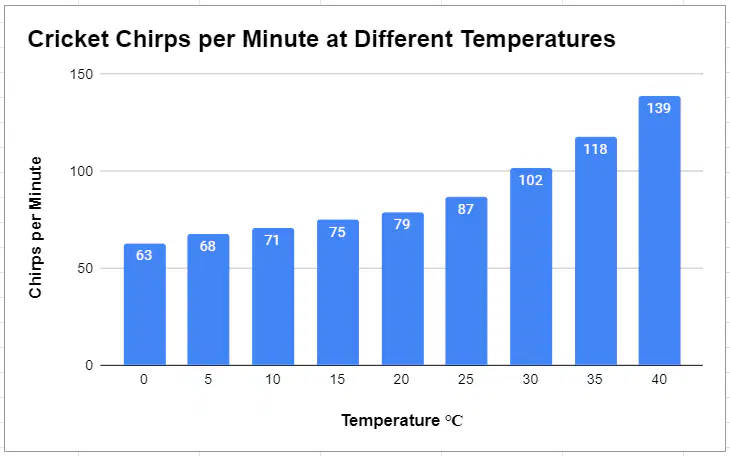
Analyze the data in the graph. At what temperature did the crickets chirp 75 times per minute?
a)
10°C
b)
15°C
c)
20°C
d)
25°C
36.
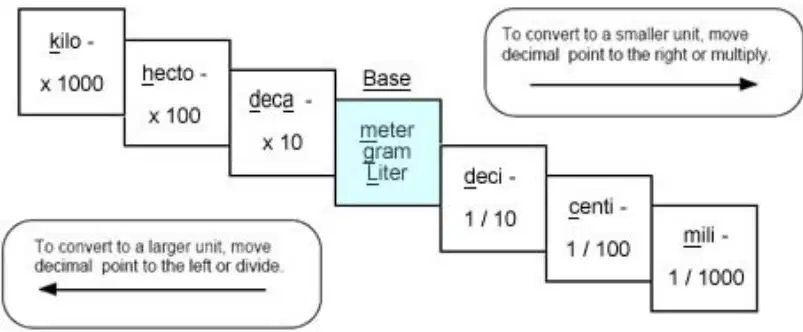
57km = _____________ m
a)
5,700
b)
0.057
c)
57,000
d)
5.7
37.
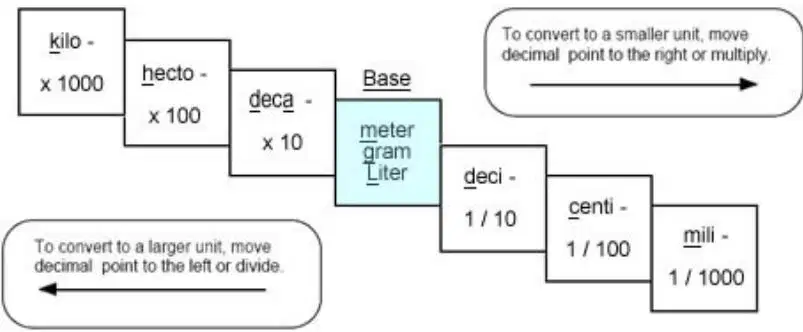
4,500,000mg = ______________g
a)
450
b)
4,500
c)
4,500,000,000
d)
0.45
38.
Convert 3.14 x 10⁴ to standard notation:
a)
3,140
b)
0.000314
c)
31,400
d)
0.0314
39.
Convert 0.0025 to scientific notation:
a)
2.5 x 10³
b)
2.5 x 10⁴
c)
2.5 x 10⁻³
d)
2.5 x 10⁻⁴
40.
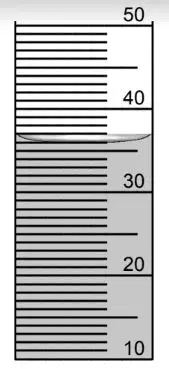
What is the volume of the liquid in the graduated cylinder?
a)
30.6mL
b)
36mL
c)
31mL
d)
41mL
41.
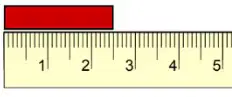
What is the length of the red bar?
a)
25 cm
b)
2.5 cm
c)
2 ¹/₂ cm
d)
3.0 cm
42.
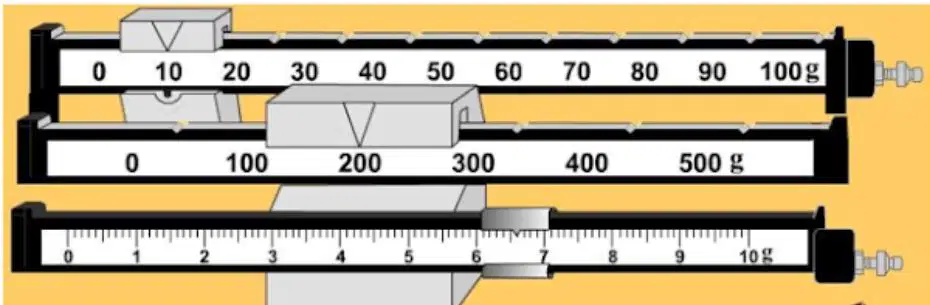
What is the reading on the scale?
a)
216.6 g
b)
1266 g
c)
210.66 g
100 %

