
 Worksheets
Spring25 EES FINAL EXAM
Total questions: 82
Worksheet time: 14hrs 31mins
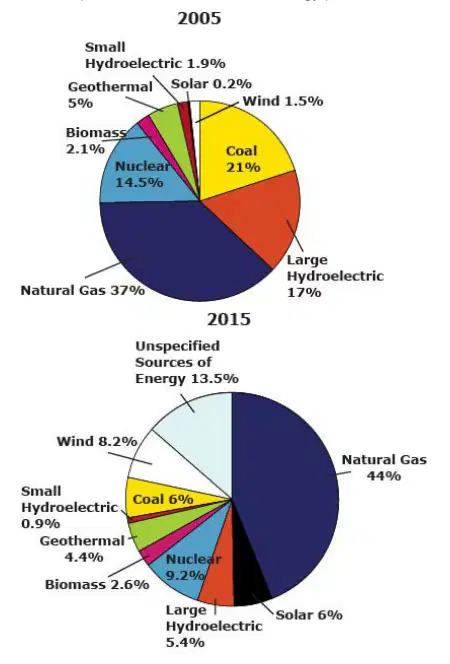
Based on the information from these two pie charts, which statement describes a change that occurred in the way California produced electricity between 2005 and 2015?
There was an increase in the use of coal.
There was an increase in the use of solar energy.
There was a decrease in the use of biomass.
There was a decrease in the use of wind energy.
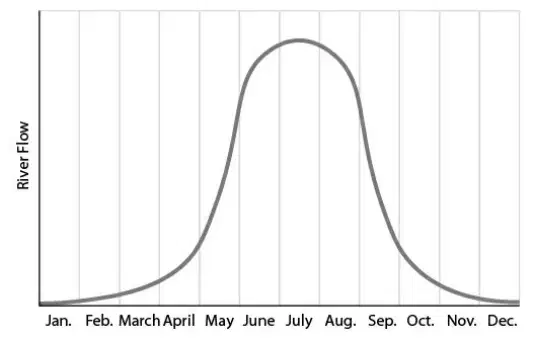
A graph of water flow in the river is shown below. Which statement describes the availability of water for growing vegetables and for the plants and animals in the environment?
Water flow occurs only in the summer months.
Water flow decreases in the summer and increases in the fall.
Water flow steadily increases throughout the year.
Water flow increases in the spring and decreases in the fall.

Read the passage - 'Plastic Bag Recycling Program' - and answer the following question: What is composite lumber, as mentioned in the passage?
A type of plastic bag
A material made from recycled plastic bags used to build decks and railings
A byproduct of petroleum
A drop-off location for plastic bags

Fossil fuels that are used to make plastic bags are collected through either mining or drilling. Mining involves digging or scraping to expose and excavate natural resources. Drilling reaches resources which are deep within the ground and allows those resources to flow to the surface. Both methods result in disruptions to the local habitat and emit large amounts of carbon into the atmosphere. Based on this information, which statement BEST identifies one advantage and one disadvantage of the "It's in the Bag" program?
The program reduces carbon emissions released during mining and drilling. However, animals would be negatively affected by the increased number of plastic bags polluting their habitats.
The program eliminates the need for fossil fuels by reusing plastic. However, the environment is negatively affected by habitat destruction since the program harvests composite lumber from natural areas.
The program eliminates the need to mine resources since composite lumber is made from recycled bags. However, animals would be negatively affected by the decreased number of trees in their habitats.
The program reduces the need for harvesting lumber by replacing wood with composite lumber. However, the environment is negatively affected by habitat destruction since the program uses products made from fossil fuels.
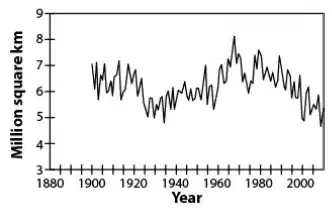
Read the passage: 'Climate Change and Sea Ice'. The effect of increasing carbon dioxide concentrations and global temperatures can be observed in sea ice. Sea ice plays an important role maintaining Earth's energy balance and global temperature. It helps keep polar regions cool because it reflects more sunlight back to space. It also acts as an insulation barrier between the cold air above it and the warmer water below it. The graph shows a trend line for Earth's Arctic sea ice cover.
Climate Change and Sea Ice
Scientists build climate models to predict future changes to Earth's climate. They look at several sources of data to build their models, including average global temperatures and carbon dioxide concentrations. Human activities have introduced additional carbon dioxide into the atmosphere due to the burning of fossil fuels. The graph shows the carbon dioxide concentration in the atmosphere over past decades and the global average temperature.
The effect of increasing carbon dioxide concentrations and global temperatures can be observed in sea ice. Sea ice plays an important role maintaining Earth's energy balance and global temperature. It helps keep polar regions cool because it reflects more sunlight back to space. It also acts as an insulation barrier between the cold air above it and the warmer water below it. The graph shows a trend line for Earth's Arctic sea ice cover.
What are TWO limitations of the climate models described in the passage?
The level of carbon dioxide emissions in the future is unknown.
The use of fossil fuels is not factored into the models.
The amount of sunlight is not considered in the models.
The use of alternative energy sources may influence the models.
The models are based only on data from the United States.
How does the melting sea ice act as a feedback loop in the environment?
As the ice turns to colder seawater, additional sea ice melts at a faster rate.
As the ice turns to colder seawater, additional sea ice melts at a slower rate.
As the ice turns to warmer seawater, additional sea ice melts at a faster rate.
As the ice turns to warmer seawater, additional sea ice melts at a slower rate.

Which conclusion can be made from the data shown?
As carbon emissions increase, global temperatures increase, leading to an increase in sea ice.
As carbon emissions increase, global temperatures increase, leading to a decrease in sea ice.
As carbon emissions increase, global temperatures decrease, leading to an increase in sea ice.
As carbon emissions increase, global temperatures decrease, leading to a decrease in sea ice.
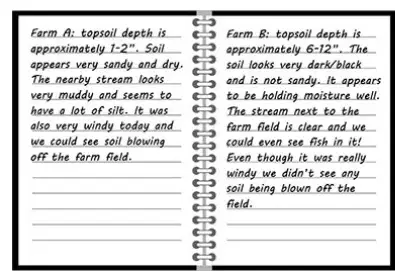
Read the passage - 'Topsoil Erosion and Cover Crops' - and answer the question below: In March, Braxton and Huang visit two farms for a plant biology class. Farm A grows soybeans from May to late September. After the beans are harvested, the fields are tilled and left as bare soil for the remainder of the year. Farm B also grows soybeans from May to late September but they plant winter wheat after harvest. Winter wheat grows in the fall into a small plant that requires a cold winter to be able to be harvested in the spring. Farmer A notes that he experiences a large amount of topsoil loss and erosion over the winter from wind, and his nearby streams are very muddy in the spring. Farmer B says that she only has minimal soil losses, and her streams are clear in the spring. Braxton and Huang measure topsoil depth at each farm (just after the harvest of winter wheat at Farm B) and note the kind of soil they see at each farm. They also walk to streams that receive snowmelt and runoff from the farms and note what they see. This is what they write in their lab notebooks: From their observations, Braxton and Huang realize that Farm A experiences topsoil erosion from the wind and from soil runoff caused by precipitation. Farm B does not experience the same loss. Which conclusion or conclusions can Braxton and Huang draw from their data? Select ALL that apply.
A. Wind did not contribute to topsoil erosion on either farm.
B. Planting two crops per year exhausted the soil's nutrients more rapidly than planting one crop.
C. Planting winter wheat helped to stabilize Farm B's topsoil.
D. Farm B lost less soil due to runoff than Farm A.
E. Farm A did not begin with as much topsoil as Farm B.
Read the passage - 'Earthquake Impacts on Humans' - and answer the question below:
Earthquake Impacts on Humans In 2010, the island nation of Haiti experienced a strong earthquake that directly and indirectly resulted in the deaths of 230,000 to 300,000 people. Some people died because of injuries or trauma that occurred during the earthquake or soon after, while many others died from long-term effects of the earthquake. Long-term negative effects include damage to the fundamental facilities and services in the area stricken by an earthquake. The following lists the types of facilities and services that can be damaged in an earthquake: • Loss of sewers, sanitation, and clean water sources • Loss of power stations, airports, and railways • Loss of homes and businesses • Loss of farm crops, fertile soils, and cattle • Loss of fishing boats and equipment • Loss of forest and freshwater habitats
Earthquake Impacts on Humans In 2010, the island nation of Haiti experienced a strong earthquake that directly and indirectly resulted in the deaths of how many people?
50,000 to 100,000
100,000 to 150,000
230,000 to 300,000
500,000 to 600,000
Long-term negative effects include damage to the fundamental facilities and services in the area stricken by an earthquake. The following lists the types of facilities and services that can be damaged in an earthquake: • Loss of sewers, sanitation, and clean water sources • Loss of power stations, airports, and railways • Loss of homes and businesses • Loss of farm crops, fertile soils, and cattle • Loss of fishing boats and equipment • Loss of forest and freshwater habitats
Which pair of statements is BEST supported by the information in the passage?
1. Humans can create or find new resources when they lose their original resources. 2. Natural hazards help increase human access to resources.
1. Humans depend on resources for survival. 2. Natural hazards, such as earthquakes, can impact the sizes of human populations.
1. Humans depend on resources for survival. 2. Natural hazards help increase human access to resources.
1. Humans can create or find new resources when they lose their original resources. 2. Natural hazards, such as earthquakes, can impact the sizes of human populations.
Which claim is correct based on the information in the passage?
Earthquakes only impact people immediately after they occur.
Long-term negative effects of an earthquake do not impact population size.
Natural hazards can significantly alter the size of human populations in an area.
Natural hazards do not affect the availability of natural resources.
After some natural disasters, people are forced to leave the area and relocate to a new area. Why were the people of Haiti less likely to relocate as a result of the 2010 earthquake?
Haiti was able to rebuild without relocating people because necessary technologies were not lost.
The earthquake was not strong enough to require people to relocate.
The earthquake only caused deaths directly and not from conditions that developed after the event.
Haiti is an island nation, so it is not easy to leave the area after an earthquake.
What is human migration described as?
The permanent movement of animals from one place to another
The temporary or permanent movement of humans from one place to another
The movement of plants from one place to another
The movement of water from one place to another
According to the passage, what is the difference between immigration and emigration?
Immigration describes entering an area, and emigration describes leaving an area.
Immigration describes leaving an area, and emigration describes entering an area.
Immigration and emigration both describe leaving an area.
Immigration and emigration both describe entering an area.
If more people enter an area than leave it, what type of net migration rate does the area have?
Negative net migration rate
Positive net migration rate
Balanced net migration rate
No migration rate
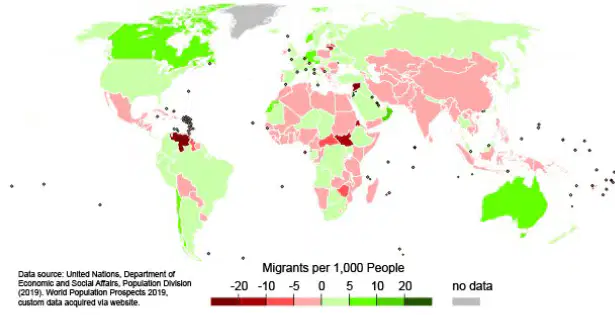
Refer to the map showing the annual anticipated net migration of humans on Earth between 2015 and 2020. Which regions have the highest positive net migration rates?
Regions such as North America, parts of Europe, and Australia have the highest positive net migration rates.
Regions such as Sub-Saharan Africa and Southeast Asia have the highest positive net migration rates.
Regions such as South America and Central Asia have the highest positive net migration rates.
Regions such as the Middle East and Northern Africa have the highest positive net migration rates.
Scientists have been able to determine the climate of Earth for the last how many years?
65,000 years
650,000 years
6,500 years
65 years

According to the table, what has happened to the thickness and area covered by Arctic sea ice due to climate change?
The thickness and area covered by Arctic sea ice has been diminished.
The thickness and area covered by Arctic sea ice has increased significantly.
The thickness has remained the same, but the area has increased.
The area has remained the same, but the thickness has increased.
Which statement BEST summarizes how climate change can affect the mass migration of humans on Earth?
Climate change can increase the risks of natural hazards in a location, increasing the number of humans that migrate to it.
Climate change can increase the amount of natural resources available in areas, attracting humans to migrate to those locations.
Climate change can decrease the carrying capacity of areas, forcing humans to migrate to other locations where their needs can be met.
Climate change can decrease the rate of natural processes in a location, causing humans to migrate to areas where processes occur quickly.
Choose THREE agricultural activities that humans perform to minimize their impact on climate change.
leave land untouched
plant cover crops
use additional fertilizers
drain wetlands
breed drought tolerant plants
Select TWO effects of climate change in an area that would MOST LIKELY cause humans to migrate to different areas permanently.
hurricanes
ice sheet reduction
seasonal flooding
sea level rise
desertification of land
The Amazon Rainforest
The Amazon Rainforest is a natural resource that is vital to the entire world. It is often referred to as the "lungs" of Earth because its vegetation affects the atmosphere's oxygen amount. The Amazonia region, which includes the rainforest and the water-rich Guiana Shield, is home to 30 million people. It contains 4,220 species of animals, making it the most biodiverse region on the planet. It also contains one-fifth of the planet's fresh water. Scientists conduct many studies in this region to preserve vital areas. They map where the forests are, the protected and indigenous areas, and the hot spots of deforestation. These studies show evidence that various relationships affect the rainforest. There is often a direct relationship between some factors and the size of the Amazon rainforest. This direct relationship is represented by a straight line going up to the right or down to the right on a coordinate plane. Direct relationships can be graphed using the linear formula y = mx + b, where y = vertical axis, the dependent variable, the number of acres of rainforest in an area being studied; m = slope, or the rate of change; x = horizontal axis, the independent variable, the variable that changes and affects the dependent variable; b = the amount of rainforest at the start of the study, the location on the y-axis where the graph would start.
What data should scientists collect to understand how changes in the variable (x) affect the size of the rain forest in acres (y)?
Scientists should collect data on the amount of tourism in two different areas of the rainforest and correlate it with data on the growth of the rainforest in those areas.
Scientists should collect data on the growth or decline of agriculture in the rainforest and correlate it with the number of acres of rainforest in those areas.
Scientists should collect data on the type of crops grown in two different areas of the rainforest and correlate it with data on the growth of the rainforest in those areas.
Scientists should collect data on the temperature in two different areas of the rainforest and correlate it with data on the growth of the rainforest in those areas.
An increase in agriculture (x) would most likely have what effect on the biodiversity in the rainforest (y)?
Increase biodiversity
Decrease biodiversity
Have no effect on biodiversity
Cause biodiversity to fluctuate randomly
The Amazon Rainforest The Amazon Rainforest is a natural resource that is vital to the entire world. It is often referred to as the "lungs" of Earth because its vegetation affects the atmosphere's oxygen amount. The Amazonia region, which includes the rainforest and the water-rich Guiana Shield, is home to 30 million people. It contains 4,220 species of animals, making it the most biodiverse region on the planet. It also contains one-fifth of the planet's fresh water. Scientists conduct many studies in this region to preserve vital areas. They map where the forests are, the protected and indigenous areas, and the hot spots of deforestation. These studies show evidence that various relationships affect the rainforest. There is often a direct relationship between some factors and the size of the Amazon rainforest. This direct relationship is represented by a straight line going up to the right or down to the right on a coordinate plane. Direct relationships can be graphed using the linear formula y = mx + b, where y = vertical axis, the dependent variable, the number of acres of rainforest in an area being studied; m = slope, or the rate of change; x = horizontal axis, the independent variable, the variable that changes and affects the dependent variable; b = the amount of rainforest at the start of the study, the location on the y-axis where the graph would start.
Read the passage - 'The Amazon Rainforest' - and answer the question below: Which TWO statements describe a relationship between variables in the rainforest? Pick up to 5 answers.
A. Increasing human developments will result in fewer acres of rainforest.
B. Reducing the amount of vegetation will result in higher oxygen levels.
C. Increasing human populations will result in more available fresh water.
D. Reducing available acres of rainforest will result in less biodiversity.
E. Reducing agriculture will result in fewer habitats for species.
What could happen if the Amazon rainforest was destroyed?
The level of rainfall would increase.
The level of oxygen would increase.
The level of carbon dioxide would increase.
The level of species biodiversity would increase.
No specific question is provided in the image for this passage, so no extractable question here.
There is no extractable question.
There is an extractable question.
The passage is a poem.
The passage is a story.
The Dust Bowl In the 1930s, the Great Plains of the United States and Canada experienced widespread soil erosion and subsequent dust storms. Severe drought and faulty farming practices combined with high winds, causing huge clouds of dirt to blow across the region. This time and place would come to be known as the Dust Bowl. The economic impact on the continent's farming communities exacerbated the Great Depression and led to widespread poverty and migration. Agricultural impacts included the loss of field fertility, permanent changes to the landscape due to extreme soil erosion, and property damage. Impacts to human health included malnutrition and pneumonia. In the time leading up to the Dust Bowl, during the late 1920s and early 1930s, people migrated to the Great Plains of the United States and Canada to farm. Huge herds of cattle, hogs, and goats grazed pasture land heavily. Mechanized inventions such as tractors and combines were used to rapidly plow millions of acres of grassland. Topsoil was loosened, but rainfall was scarce. As temperatures rose, the soil became increasingly dry. The fine, unanchored dirt was easily picked up by strong winds and coalesced into huge clouds that blew across the continent. The dust storms were so bad that people could no longer grow crops or maintain their farms, especially in extremely hard-hit areas such as Oklahoma. The loss of income for farmers also led to many families losing their land to bank foreclosures. This forced many families out of the Dust Bowl region in search of work in more plentiful lands. The desperate situation led to several government interventions. The U.S. Forest Service helped private landowners plant trees in order to create windbreaks along the edges of fields. Agricultural extension agents also taught contour tilling methods to farmers, which recommended tilling at angles to avoid prevailing winds. Continuous rotational farming was facilitated through government subsidies and provision of seed. No-till farming was encouraged to prevent the disruption to topsoil and the resulting water loss. Cattle and hog farmers reduced animal herds as the United States government bought excess animals and distributed the meat to the poor.
Based on the passage, which statement describes a cause-and-effect relationship that occurred during the Dust Bowl?
Severe drought exacerbated topsoil erosion.
Livestock grazing made fields unable to be plowed.
Contour tilling made fields more susceptible to wind damage.
High temperatures led to a reduction in cattle and hog populations.
How were the strategies implemented to improve conditions in the Dust Bowl designed to work?
They were designed to promote the conservation of native plant species.
They were designed to reforest farmland.
They were designed to protect topsoil in farmland.
They were designed to encourage traditional farming methods.
Read the passage - 'The Dust Bowl' - and answer the question below: Which TWO methods were introduced to reduce soil erosion in the Dust Bowl?
flooding fields
rotating crops
increasing livestock populations
manual plowing
planting natural windbreaks

Read the passage - 'Kepler's Laws of Motion' - and answer the question below:
The question has a diagram associated with it. The diagram has been stored separately.
The question does not have any diagram associated with it.
The diagram is missing from the question.
There is no reference to any diagram in the question.

Based on Kepler's laws, which statement is MOST LIKELY correct about comets?
A. Comets do not have the Sun as a focus.
B. Comets spend most of their time close to the Sun.
C. Comets spend most of their time far from the Sun.
D. Comets travel with a uniform speed.

According to the nebular theory, what caused the material in the solar nebula to gather in dense regions?
Gravitational attraction
Solar winds
Magnetic fields
Radiation pressure
Read the passage - 'The Nebular Theory' - and answer the question below: 28. Which statement about planetary impact craters in the early formation of the solar system is BEST supported by this theory?
A. All planets likely experienced few collisions that resulted in impact craters.
B. All planets likely experienced many collisions that resulted in impact craters.
C. The Jovian planets formed before others, which led to more collisions and impact craters.
D. The terrestrial planets formed before others, which led to fewer collisions and impact craters.
Read the passage - 'The Nebular Theory' - and answer the question below: Select the THREE features of the solar system that are explained by the nebular theory. Pick up to 6 answers.
The planets and asteroids all orbit the Sun in the same plane.
The planets all orbit the Sun in different planes.
The center of the solar system contains the most heat and the most mass.
The planets all orbit the Sun in the same direction.
The Jovian planets are made of the same elements as the Sun.
Which characteristics of the solar system are BEST explained by the shape and motion of the flattened, spinning disc that came from the solar nebula?
The disc shape of the flattened solar nebula explains the spherical shape of the planets. The spinning motion of the disc explains why all of the planets orbit the Sun in the same direction as the Sun’s rotation.
The disc shape of the flattened solar nebula explains the spherical shape of the planets. The spinning motion of the disc explains why all of the planets orbit the Sun in the opposing direction as the Sun’s rotation.
The flattened shape of the spinning disc explains why all of the planets lie in the same plane. The spinning motion of the disc explains why all of the planets orbit the Sun in the same direction as the Sun’s rotation.
The flattened shape of the spinning disc explains why all of the planets lie in the same plane. The spinning motion of the disc explains why all of the planets orbit the Sun in the opposing direction as the Sun’s rotation.
Which piece of evidence would provide the greatest support for this theory?
There are no impact craters on the Jovian planets.
All the planets in the solar system are made of the same elements.
Radiometric dating shows that Earth's oldest rocks, lunar rocks, and meteorites were all formed at different time periods.
Radiometric dating shows that Earth's oldest rocks, lunar rocks, and meteorites were all formed around the same time period.
What happens to gamma rays by the time they reach the surface of the Sun?
The gamma rays produced in the core travel in a straight path to the Sun's surface. This results in primarily gamma radiation that is emitted from the Sun.
The gamma rays produced in the core scatter many times before they reach the Sun's surface. This results in primarily gamma radiation that is emitted from the Sun.
The gamma rays produced in the core travel in a straight path to the Sun's surface. This results in a spectrum of electromagnetic radiation that is emitted from the Sun.
The gamma rays produced in the core scatter many times before they reach the Sun's surface. This results in a spectrum of electromagnetic radiation that is emitted from the Sun.
Which statement BEST compares the energy released by fusion to the energy released by chemical reactions?
Energy released by chemical reactions is much greater. The energy released by the hydrogen chemical reactions in the Sun is much greater than the energy released by nuclear fusion reactions that take place on Earth.
Energy released by fusion reactions is much greater. The energy released by the hydrogen chemical reactions in the Sun is much greater than the energy released by nuclear fusion reactions that take place on Earth.
Energy released by chemical reactions is much greater. The energy released by the nuclear fusion reactions in the Sun is much greater than the energy released by hydrogen chemical reactions that take place on Earth.
Energy released by fusion reactions is much greater. The energy released by the nuclear fusion reactions in the Sun is much greater than the energy released by hydrogen chemical reactions that take place on Earth.
Which statement BEST explains why nuclear fusion only occurs in one part of the Sun?
There is only one part of the Sun in which the temperature and pressure of helium are high enough to create an environment where nuclear fusion occurs.
There is only one part of the Sun in which the temperature and pressure of hydrogen are low enough to create an environment where nuclear fusion occurs.
There is only one part of the Sun in which the temperature and pressure of hydrogen are high enough to create an environment where nuclear fusion occurs.
There is only one part of the Sun in which the temperature and pressure of helium are low enough to create an environment where nuclear fusion occurs.
Earth's tectonic plates are constantly moving due to which process in Earth's interior?
Convection
Radiation
Evaporation
Condensation
What are the TWO energy sources that power the rock cycle?
wind
the Sun
plate motions
Earth's hot interior
Earth's liquid water
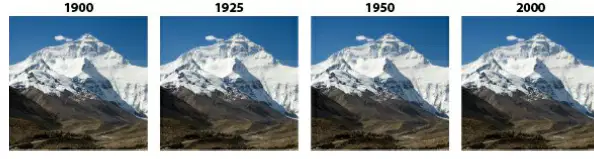
What can be said about the appearance of Mount Everest?
It appears stable because the changes occur on a large spatial scale and a large time scale.
It appears stable because the changes occur on a small spatial scale and a large time scale.
It appears stable because the changes occur on a large spatial scale and over a small time scale.
It appears stable because the changes occur on a small spatial scale and over a small time scale.
Which BEST describes what the rock cycle model demonstrates?
the cycling of Earth's materials
the creation of Earth's materials
the discovery of Earth's materials
the destruction of Earth's materials

Before geologists identified features like the Mid-Atlantic Ridge, what was the ocean floor believed to be like?
Mostly smooth and flat
Full of mountains
Covered in volcanoes
Completely dry

According to the passage, the Mid-Atlantic Ridge is part of an underwater ridge system nearly _______ km long that is found throughout all of Earth’s oceans.
40,000
4,000
400,000
14,000
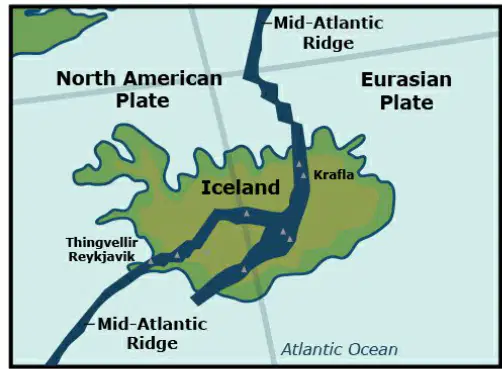
Some of the tallest peaks in the Mid-Atlantic Ridge are located on which island?
Greenland
Iceland
Madagascar
Hawaii
What phenomenon, discovered by geologists studying the Mid-Atlantic Ridge, provided evidence for Wegener’s continental drift theory?
Seafloor spreading
Volcanic eruptions
Earthquake swarms
Magnetic storms
What is the overarching theory used today to explain the movements of Earth’s crust and the landform changes that occur when plate boundaries interact?
Plate tectonics
Continental drift
Seafloor spreading
Uniformitarianism
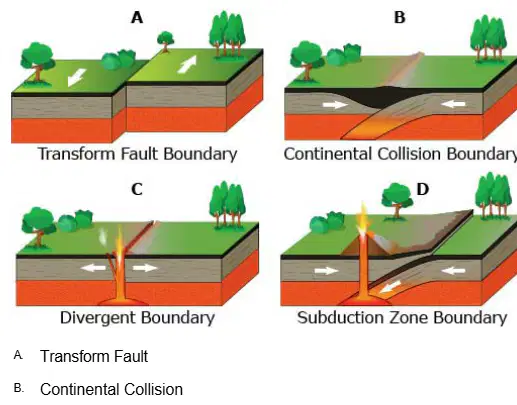
Diagrams A through D below show the movement of Earth's plates. Using information from the passage and analysis of the diagrams, select the model that best illustrates the movements of the North American Plate and Eurasian Plate that formed the Mid-Atlantic Ridge.
Transform Fault
Continental Collision
Divergent
Subduction
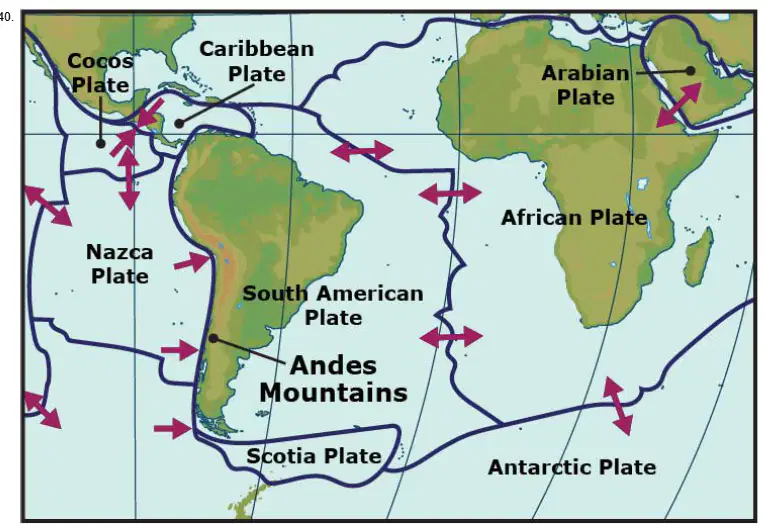
The Andes Mountains along the western coast of South America formed at an oceanic-continental convergence. At this boundary, the Nazca plate collides with the South American plate. Whale fossils have been discovered in this mountain range at elevations greater than 5,000 feet. Use the information shown in the picture to choose one of the following answer choices that BEST describes the reasons behind this fossil location.
The sea level in this region used to be significantly higher than it is now; at that time, this mountain range was under water.
The movement of the Nazca plate under the South American plate caused the sea floor to lift, bringing oceanic fossils up with it.
The collision of the Nazca and South American plates forced fossils off of the ocean floor underground; volcanic activity then brought the fossils to the surface.
Continuous coastal erosion along the South American plate revealed the whale fossils as the process removed softer ground and left behind the rocky Andes Mountains.
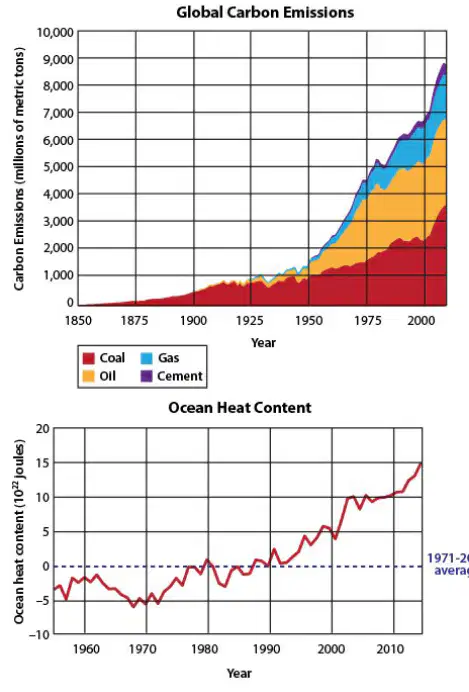
What are TWO effects of an increase in carbon emissions?
There is an increase in the global atmospheric temperature.
There is a decrease in emissions from burning oil.
There is a decrease in ice coverage of the oceans.
There is a decrease in the global ocean heat content.
There is an increase in the size of the polar ice caps.
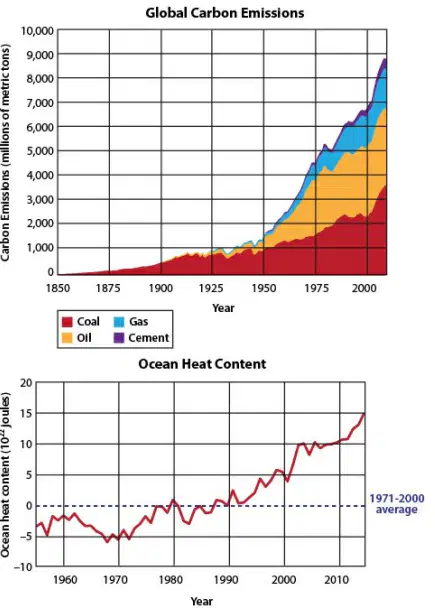
According to the graphs, in which year did carbon emissions first raise the global heat content of the oceans above the 1971-2000 average?
1962
1980
1987
2000

Which statement BEST explains the trend in atmospheric temperature between 1950 and 2000?
A. The Sun’s radiation output decreased during this time.
B. Human activity resulted in an increase in the atmosphere’s ability to retain radiation.
C. Urban sprawl and deforestation increased the amount of solar energy reflected back into space.
D. Coal burning increased the amount of air pollution, which led to a decrease in the absorption of solar radiation.
One factor that explains an increase in Earth's temperature is an increase in the amount of energy that Earth receives. Which of the following would result in an increase in energy received by Earth?
an increase in ocean circulation
an increase in solar output
a volcanic eruption
a shift in tectonic plates

According to the graph, between 1970 and 2000 the average temperature of Earth increased. Select ALL of the following that were the MOST LIKELY causes of the increasing temperature during that period.
A. shift in Earth's axial tilt
B. increasing levels of greenhouse gases in the atmosphere
C. increased solar output
D. changes in the orbit of Earth around the sun
E. a small volcanic eruption
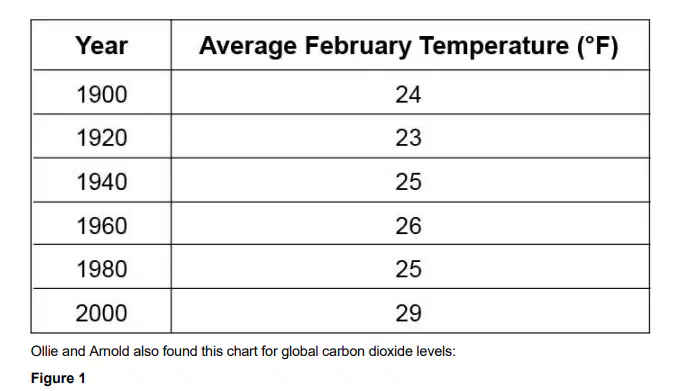
According to the table, what was the average February temperature in 2000?
29°F
32°F
25°F
35°F

Based on the table, which year had the lowest average February temperature?
1920
1935
1942
1950
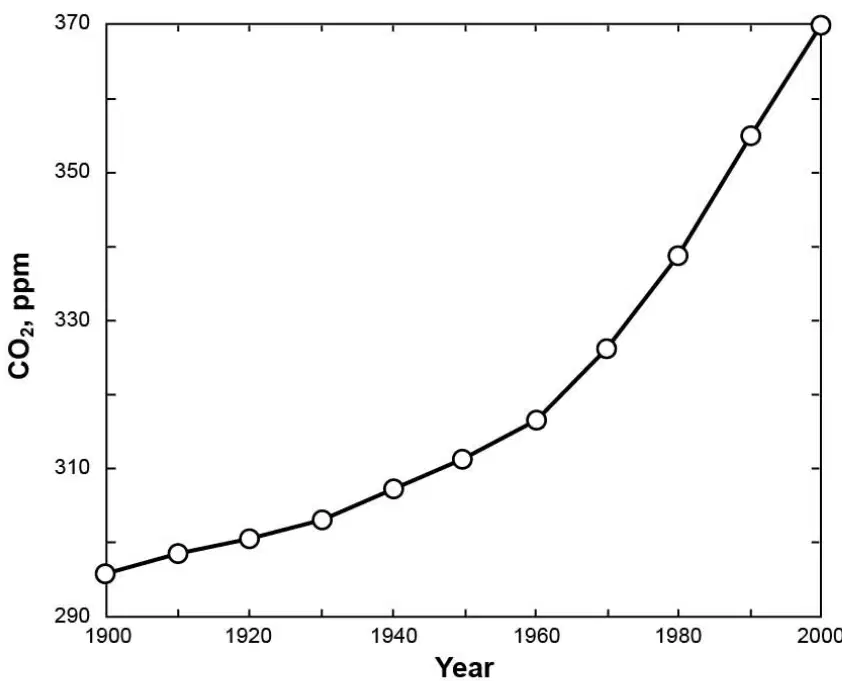
According to Figure 1, what was the approximate global carbon dioxide level in 1980?
340 ppm
300 ppm
380 ppm
410 ppm
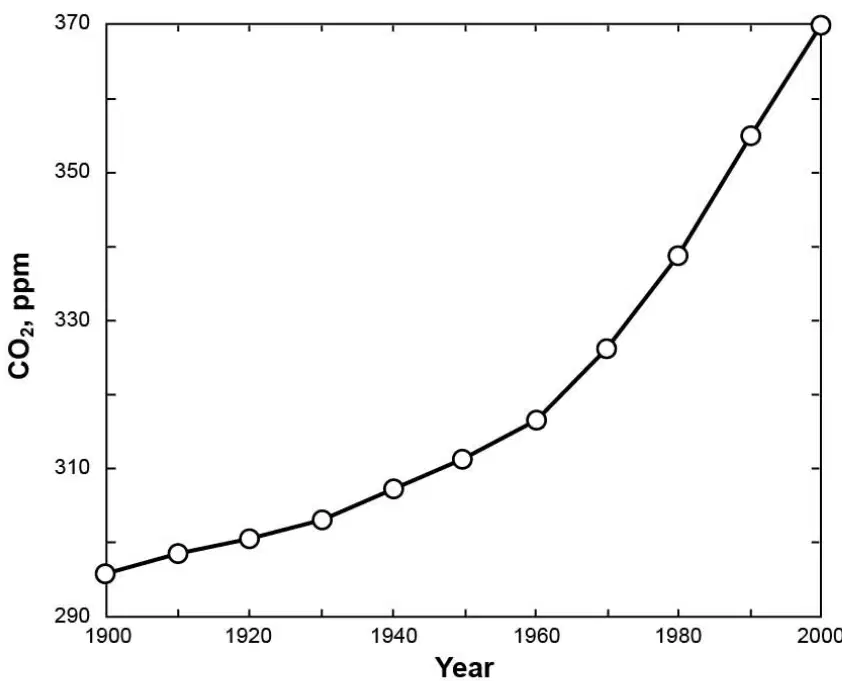
Which of the following best describes the trend in global carbon dioxide levels from 1900 to 2000 as shown in Figure 1?
Decreasing
Staying the same
Increasing
Fluctuating randomly
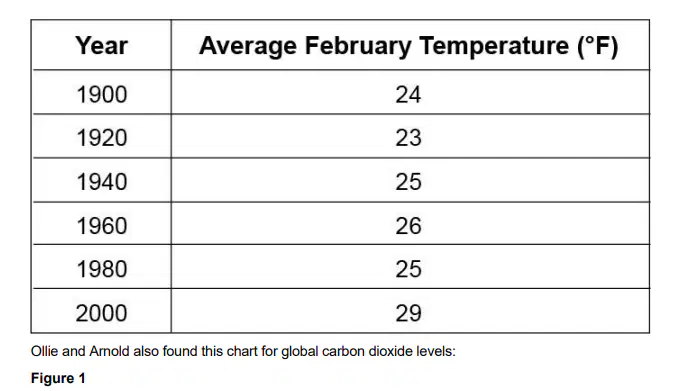
According to the table, which year had the highest average February temperature?
2000
1998
2002
1995
If warming trends continue, which of the following could happen to the glacial ecosystem? Choose ALL that apply.
Glacial loss will cool parts of the ecosystem, but because overall temperatures are warmer, precipitation will increase. Increased rain will raise stream and lake levels and increase fish populations.
Glaciers will not melt into nearby bodies of water. The water levels will rise and create an overall cooling effect on the ecosystem, resulting in a net zero temperature change. The fish population will be unaffected.
Glacial runoff will begin earlier in the year, and as a result, streams will also warm earlier. Warmer streams will affect native fish populations.
Glaciers will melt into nearby oceans, causing the salt levels of the ocean to go down. This will increase the available habitat for fish and cause an increase in the nearby population.
Glacial melt and warmer temperatures will increase humidity levels in the ecosystem. This will decrease fish populations that thrive in colder climates.
Coldwater fishes (fishes that live in glacial ecosystems) require the amount of oxygen carried by cold water to survive. The population of coldwater fishes has dropped in the last 100 years. Use this information and the information in Table 1 and Figure 1 to classify each scenario described below. Assume all other environmental factors remain the same. Effect on Fishes: Carbon dioxide levels decrease:
Coldwater fish populations will increase.
Coldwater fish populations will decrease.
Coldwater fish populations will remain neutral.
Coldwater fish will migrate to warmer waters.
Coldwater fishes (fishes that live in glacial ecosystems) require the amount of oxygen carried by cold water to survive. The population of coldwater fishes has dropped in the last 100 years. Use this information and the information in Table 1 and Figure 1 to classify each scenario described below. Assume all other environmental factors remain the same. Effect on Fishes: Carbon dioxide levels remain the same
Coldwater fish populations will remain neutral.
Coldwater fish populations will increase significantly.
Coldwater fish populations will decrease rapidly.
Coldwater fish populations will become extinct.
Coldwater fishes (fishes that live in glacial ecosystems) require the amount of oxygen carried by cold water to survive. The population of coldwater fishes has dropped in the last 100 years. Use this information and the information in Table 1 and Figure 1 to classify each scenario described below. Assume all other environmental factors remain the same. Effect on Fishes: Carbon dioxide levels increase
Coldwater fish populations will decrease.
Coldwater fish populations will increase.
Coldwater fish populations will remain the same.
Coldwater fish populations will migrate to warmer waters.
Coldwater fishes (fishes that live in glacial ecosystems) require the amount of oxygen carried by cold water to survive. The population of coldwater fishes has dropped in the last 100 years. Use this information and the information in Table 1 and Figure 1 to classify each scenario described below. Assume all other environmental factors remain the same. Effect on Temperature: Carbon dioxide levels decrease:
Glacial runoff streams will decrease in temperature.
Glacial runoff streams will increase in temperature.
Glacial runoff streams will remain the same temperature.
Glacial runoff streams will become more acidic.
Coldwater fishes (fishes that live in glacial ecosystems) require the amount of oxygen carried by cold water to survive. The population of coldwater fishes has dropped in the last 100 years. Use this information and the information in Table 1 and Figure 1 to classify each scenario described below. Assume all other environmental factors remain the same. Effect on Temperature: Carbon dioxide levels remain the same:
Glacial runoff streams will remain the same temperature.
Glacial runoff streams will increase in temperature.
Glacial runoff streams will decrease in temperature.
Glacial runoff streams will freeze completely.
Coldwater fishes (fishes that live in glacial ecosystems) require the amount of oxygen carried by cold water to survive. The population of coldwater fishes has dropped in the last 100 years. Use this information and the information in Table 1 and Figure 1 to classify each scenario described below. Assume all other environmental factors remain the same. Effect on Temperature: Carbon dioxide levels increase:
Glacial runoff streams will increase in temperature.
Glacial runoff streams will decrease in temperature.
Glacial runoff streams will remain the same temperature.
Glacial runoff streams will freeze completely.

Based on the Carbon Cycle Model, carbon moves from the atmosphere to plants and then to animals through which of the following processes?
Photosynthesis and consumption
Respiration and decomposition
Evaporation and condensation
Transpiration and precipitation
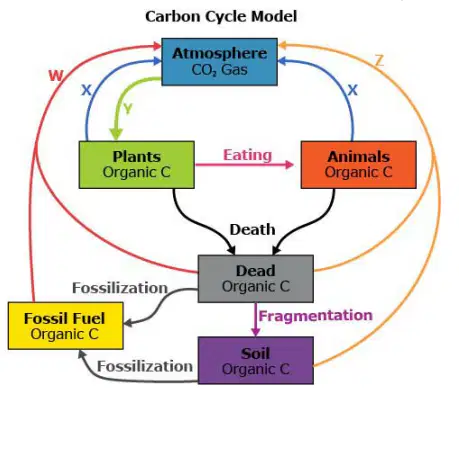
Which BEST describes the process represented by the letter Y in the diagram?
Letter Y represents carbon cycling between the atmosphere and the biosphere in the process of photosynthesis.
Letter Y represents carbon cycling between the hydrosphere and the biosphere in the process of respiration.
Letter Y represents carbon cycling between the geosphere and the hydrosphere in the process of photosynthesis.
Letter Y represents carbon cycling between the atmosphere and the geosphere in the process of respiration.
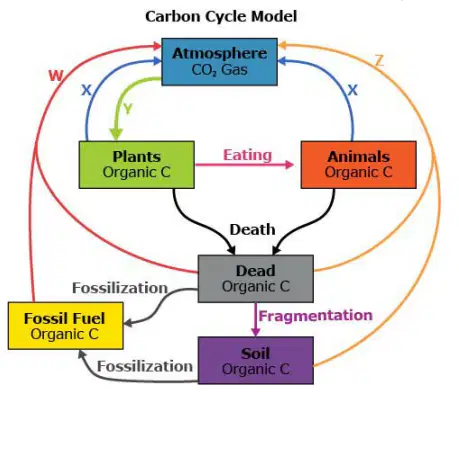
Which label would BEST complete the model to represent a human activity that has increased over the past century to result in increased concentrations of carbon dioxide in Earth's atmosphere?
label W; W = combustion
label Y; Y = respiration
label W; W = respiration
label Y; Y = combustion
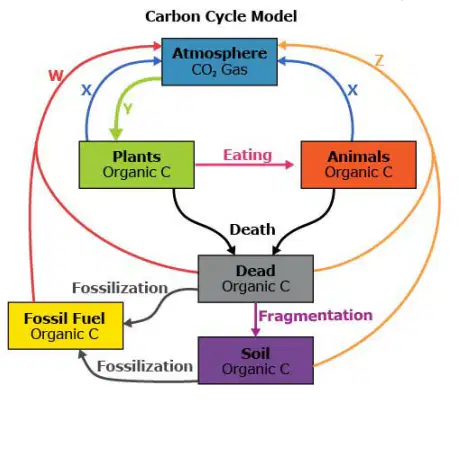
Which of the following describes what is represented by letter Z?
carbon cycling from the geosphere to the atmosphere through the process of fixation
carbon cycling from the atmosphere to the biosphere through the process of respiration
carbon cycling from the biosphere to the atmosphere through the process of decomposition
carbon cycling from the atmosphere to the geosphere through the process of photosynthesis
Read the passage: 'Climate and the Carbon Cycle' - and answer the following statement. Before the presence of fungi and land plants, Earth's atmosphere contained high levels of which gas, which kept Earth's surface temperature higher than it is today?
Oxygen
Nitrogen
Carbon dioxide
Methane
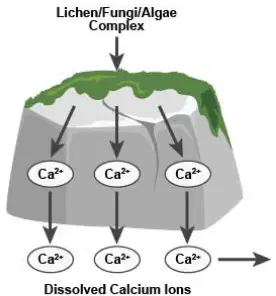
Which TWO statements are correct about interactions described in the passage?
Lichen dissolving rocks is an interaction between the biosphere and the geosphere.
Carbon dioxide reacting with calcium is an interaction between the atmosphere and biosphere.
Fungi and algae living together is an interaction between the geosphere and hydrosphere.
Plants using carbon dioxide for photosynthesis is an interaction between the biosphere and atmosphere.
Algae releasing oxygen for land organisms is an interaction between the hydrosphere and geosphere.
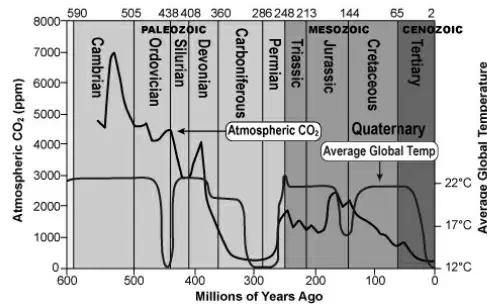
Read the passage - 'Climate and the Carbon Cycle' - and answer the question below: Which TWO descriptions of plants explain how they contributed to the carbon cycle?
A. Plants stored carbon in their tissues to use as energy.
B. Plants released calcium ions from rock to form calcium carbonate.
C. Plants combined calcium ions with carbon dioxide to make calcium carbonate.
D. Plants took in carbon dioxide and released oxygen through photosynthesis.
E. Plants broke down calcium carbonate in water to release carbon dioxide.
What are the two types of processes described in the carbon cycle on Earth?
Fast and slow processes
Photosynthesis and respiration
Combustion and decomposition
Evaporation and condensation
Which organisms play a major role in the fast carbon cycle by using carbon from the atmosphere to create food?
Plants and phytoplankton
Fungi and bacteria
Insects and worms
Fish and amphibians
The slow carbon cycle generally involves Earth's natural processes over a period of 100–200 million years.
True
False
What happens when rainfall increases according to the passage?
An increase in rainfall dissolves more rock and creates ions, which deposit more carbon onto the ocean floor when they are washed into Earth's oceans.
Rainfall increases the temperature of the ocean, causing more evaporation.
Increased rainfall leads to less erosion and fewer ions in the ocean.
Rainfall causes the ocean floor to rise above sea level.
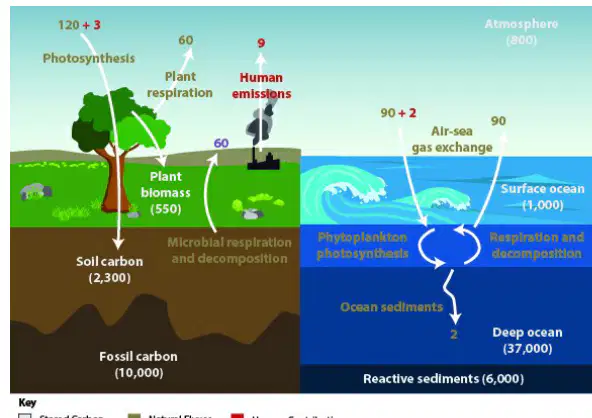
Refer to the diagram. Which process moves the most carbon from the atmosphere to the biosphere each year?
Plant respiration
Photosynthesis
Human emissions
Surface ocean exchange

Drag and drop the choices to complete the table to describe the movement of carbon. Each answer may be used once. Carbon flows from: Atmosphere | Carbon flows to: Biosphere | Process: Gap 1 Carbon flows from: Geosphere | Carbon flows to: Gap 2 | Process: Volcanic eruption Carbon flows from: Gap 3 | Carbon flows to: Atmosphere | Process: Cellular respiration Carbon flows from: Geosphere | Carbon flows to: Gap 4 | Process: Chemical weathering Carbon flows from: Biosphere | Carbon flows to: Geosphere | Process: Gap 5 Choices: Photosynthesis, Atmosphere, Biosphere, Hydrosphere, Fossilization of carbon What is the correct way to fill the gaps in the table?
Gap 1: Photosynthesis, Gap 2: Atmosphere, Gap 3: Biosphere, Gap 4: Hydrosphere, Gap 5: Fossilization of carbon
Gap 1: Cellular respiration, Gap 2: Biosphere, Gap 3: Hydrosphere, Gap 4: Atmosphere, Gap 5: Photosynthesis
Gap 1: Volcanic eruption, Gap 2: Hydrosphere, Gap 3: Geosphere, Gap 4: Biosphere, Gap 5: Chemical weathering
Gap 1: Chemical weathering, Gap 2: Fossilization of carbon, Gap 3: Atmosphere, Gap 4: Photosynthesis, Gap 5: Volcanic eruption
Which TWO ways does carbon directly enter the atmosphere?
eruption from a volcano
creation of ocean sediments
chemical weathering of rocks
photosynthesis from organisms
respiration from organisms
Based on the information in the passage, how are humans affecting Earth's carbon storage?
They are moving carbon from the fast cycle to the slow cycle, leading to an increase in the storage of carbon in Earth's biosphere and geosphere.
They are moving carbon from the slow cycle to the fast cycle, leading to an increase in the storage of carbon in Earth's biosphere and geosphere.
They are moving carbon from the slow cycle to the fast cycle, leading to an increase in the storage of carbon in Earth's atmosphere and hydrosphere.
They are moving carbon from the fast cycle to the slow cycle, leading to an increase in the storage of carbon in Earth's atmosphere and hydrosphere.

