
Font size
 Worksheets
untitled
Total questions: 105
Worksheet time: 2hrs 57mins




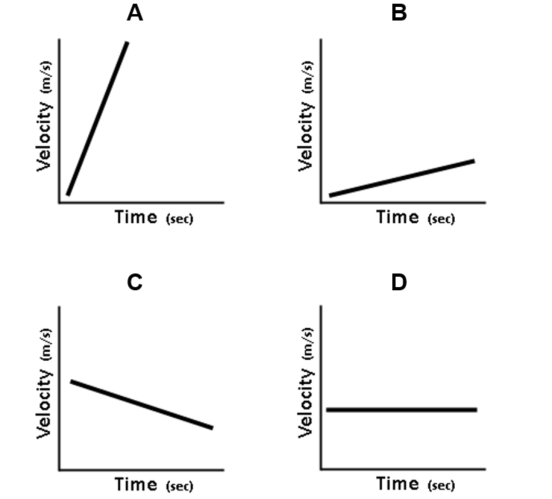
In which of the following graphs below are both runners moving at the same speed?


Why do the values on the graph form a straight line?
The speed is constant
The distance remains unchanged.
The direction of motion stays the same.
The speed gradually increases over time.

Describe the motion in the graph:
Constant Speed (positive slope)
Stopped (at rest)
Acceleration (increasing speed)
Return Home (negative slope)

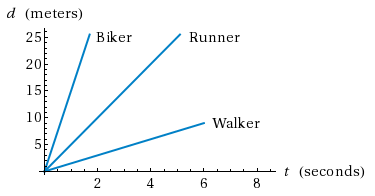
Which person moved the fastest in 3 seconds?
biker
runner
walker
they are all moving equally


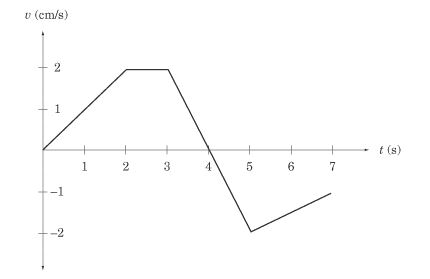
What is happening between 2 and 3 seconds?
The object is not moving.
The object is not accelerating.
The object is slowing down.
The object is speeding up.


During which segment did the car come to a complete stop?
Segment A to B
Segment B to C
Segment C to D
Segment D to E
During which segment did the car travel back toward its starting position?
Segment A to B
Segment B to C
Segment C to D
Segment D to E
During which segment did the car travel the fastest?
Segment A to B
Segment B to C
Segment C to D
Segment D to E

Choose the description that best describes this motion graph.
The object is accelerating at an increasing rate.
The object is moving at a constant velocity/speed.
The object moved at a constant speed, then stopped. After stopping, it returned to the beginning and then moved back in the original direction at a very fast constant speed.

Choose the description that best describes this motion graph.
The object is accelerating at an increasing rate.
The object is moving at a constant velocity/speed.
The object moved at a constant speed, then stopped. After stopping, it returned to the beginning and then moved back in the original direction at a very fast constant speed.

During which segment is the object increasing speed?
X
Y
Z
During which segment is the object decreasing speed?
X
Y
Z
During which segment is the object travelling at constant speed?
X
Y
Z

During which segment is the object moving at the fastest speed?
A
B
C
D
During which segment is the object moving at the slowest speed?
A
C
D
This graph shows decreasing speed. The moving object is decelerating.


Object is ...
stopped
constant speed
speeding up
Which pair of graphs shows the same motion?


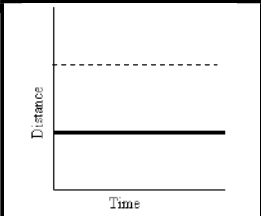
What does the solid line on this graph represent?
Constant speed
Acceleration
At rest
deceleration
During which segment is the object moving at the slowest speed?
A
C
D


Object is...
constant speed
speeding up
slowing down
stopped
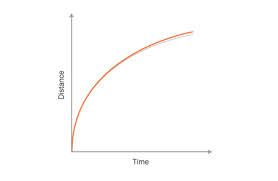
________ can be calculated if you know the distance an object traveled and the unit of time. (distance ÷ time)
Speed
Motion
Opportunity
Velocity
During which segment is the object moving at the fastest speed?
A
B
C
D

Object is ...
(check that "y" axis!)
stopped
constant speed
speeding up


Object is...
(1) speeding up,
(2) constant speed,
(3) speeding up
(1) constant speed.
(2) stopped,
(3) constant speed
During which segment is the object decreasing speed?
X
Y
Z
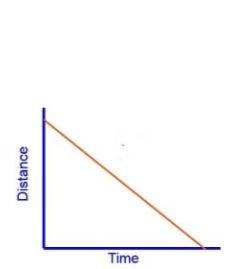
What is this line of this graph showing?
moving away from starting point at a constant speed
moving back towards the starting point at a constant speed
acceleration (getting faster)
deceleration (getting slower)
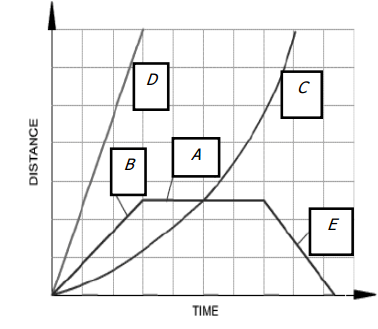

What happened during A to B point?
not moving
increasing speed at a constant rate
moving at a constant speed
acceleration

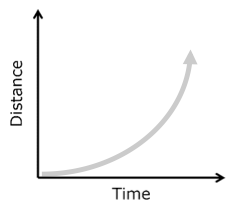


What is happening in this graph?
Constant Speed
At Rest
Object on Flat Road
Object changing position

Which statement about the graph is true?
The student walked faster in the first 5 minutes than in the next 5 minutes
The student walked up 2 hills, then on a flat road, then downhill
The student walked faster from 5-10 minutes than from 0-5 minutes
The student accelerated, then went at a constant speed, then slowed down

Which best describes the student’s walk?
The student walked at a steady pace and then returned to the starting point
The student went up a hill, and then down a hill.
The student walked quickly at the beginning but then slowed down
The student walked slowly at the beginning, and faster at the e

When is the biggest decrease in movement?
between seconds 0 and 1
between seconds 1 and 2
between seconds 2 and 5
between seconds 5 and 6

When did the earthworm move the greatest distance?
between 0 and 1 minutes
between 1 and 2 minute
between 2 and 3 minutes
between 3 and 4 minutes

Which statement describes BEST their movement?
The pig is traveling faster because it reached 500 meters in a shorter time
The human is faster because it reached 500 meters in a longer time
The cheetah, human, and pig all traveled at the same speed
The cheetah is faster because it reached 500 meters in shorter time

If the car continues to travel at a constant speed, how far will the car will have travel in 2 hours?
60 Miles
80 Miles
100 Miles
120 Miles

Which best explains the results of the race?
Car 1 traveled the fastest.
Car 2 traveled the fastest.
Car 1 traveled the farthest distance.
Car 2 traveled the shortest distance

Which statement best describes the motion of the object from second 3 to second 4?
The object is accelerating
The object is moving up a hill
The object is moving at a constant speed.
The object is at rest

Based on the graph, which is the estimated speed of the plane?
100 miles/hour
300 miles/hour
400 miles/hour
600 miles/hour

At which point in time, does this person turn around?
3 seconds
5 seconds
10 seconds
25 seconds

For which segment, is there a constant velocity of 10 m/s?
A-B
B-C
C-D
D-E

For which time period, is there no motion?
0-10 seconds
10-15 seconds
15-40 seconds
40-50 seconds

How many times does this object STOP moving?
None
Once
Twice
Three times

During which interval is the object slowing down?
A to B
D to E
E to F
B to C

During which interval is the object speeding up?
A to B
B to C
D to E
E to F

What happened during C to D point?
not moving
increasing speed at a constant rate
moving at a constant speed
moving at a constant acceleration

What happened during E to F point?
not moving
increasing speed at a constant rate
constant speed
acceleration

This motion graph represents:
A dog walking away from home, pausing to drink from a puddle, and then walking further away.
A dog walking towards home, pausing to smell a tree, and then walking further away.
A dog running up a flight of stairs at a constant speed.
A dog walking away from home, pausing to smell a tree, and then walking back towards home.

This motion graph represents:
Someone running home and then resting.
Someone walking home and then resting.
Someone leaving home, resting for a short period, and then running home.
Someone leaving home at a specific speed, walking faster away from home, and then running home.

During which interval is the object traveling at a constant velocity?
A to B
B to D
E to F
F to G
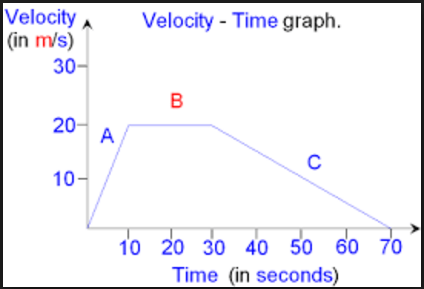
This is a velocity-time graph. What is the object doing in segment A?
Positive acceleration
Negative acceleration
Constant Velocity
Not moving
This is a velocity-time graph. What is the object doing in segment B?
Positive acceleration
Negative acceleration
Constant Velocity
Not moving
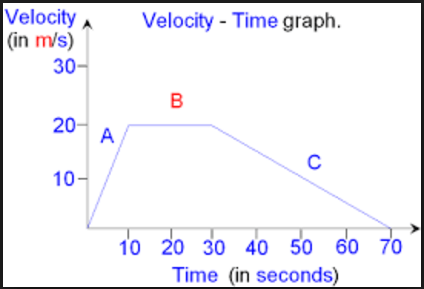
This is a velocity-time graph. What is the object doing in segment C?
Positive acceleration
Negative acceleration
Constant Velocity
Not moving
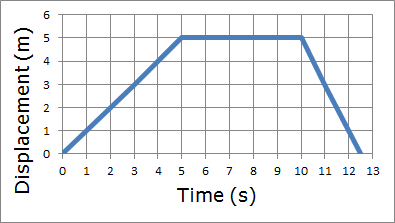
According to the graph how fast does the person travel in the first 5 seconds?
2 m/s
10 m/s
12.5 m/s
1 m/s

What is occurring on this graph? Select 2.
speeding up in the positive direction
moving at a constant speed in the positive direction
balanced forces
moving at a constant speed in the negative direction
unbalanced forces

What is occurring on this graph?
speeding up in the negative direction
moving at a constant speed in the positive direction
not moving
no net force

What is occurring on this graph?
slowing down in the positive direction
moving at a constant speed in the positive direction
positive change in momentum
negative net force

What is occurring on this graph? Select 2.
slowing down in the positive direction
moving at a constant speed in the positive direction
positive change in momentum
positive net force
negative net force

What is occurring on this graph? Select 2.
speeding up in the negative direction
slowing down in the negative direction
positive change in momentum
positive net force
negative change in momentum

What is occurring on this graph? Select 2.
speeding up in the negative direction
slowing down in the negative direction
positive net force
negative change in momentum

What is occurring on this graph? Select 2.
speeding up in the positive direction
no net force
positive displacement
no movement

What is occurring on this graph? Select 2.
constant negative velocity
no net force
positive displacement
negative change in momentum

What is occurring on this graph? Select 2.
speeding up in the negative direction
constant negative acceleration
constant positive acceleration
slowing down in the negative direction
positive change in momentum

What is occurring on this graph? Select 2.
slowing down in the negative direction
constant negative acceleration
constant positive acceleration
slowing down in the positive direction
positive change in momentum

What is occurring on this graph? Select 2.
no change in energy
constant negative acceleration
constant positive acceleration
slowing down in the positive direction
positive change in momentum

What is occurring on this graph? Select 2.
negative change in kinetic energy
constant negative acceleration
positive displacement
slowing down in the positive direction
positive change in momentum
These two graphs represent slowing down in the negative direction then speeding up in the positive direction.


These two graphs represent slowing down in the positive direction then speeding up in the positive direction.


These two graphs represent speeding up in the positive direction then slowing down in the positive direction.

These two graphs represent speeding up in the negative direction then slowing down in the negative direction.


These two graphs represent slowing down in the negative direction then speeding up in the negative direction.

These two graphs represent slowing down in the positive direction then speeding up in the positive direction.



