
 Worksheets
Microeconomics Midterm Exam Questions
Total questions: 90
Worksheet time: 45mins
The study of economics exists because people are confronted with the basic problem of
elasticity
negative externality
scarcity
overabundance
monopoly
Individuals in any society must make choices regarding the types of goods and services to be produced because
free markets do not always allocate resources efficiently
free markets only satisfy the demands of paying consumers
opportunity costs increase as more of a good or service is produced
resources are scarce and human wants are unlimited
resources must be allocated for the benefit of the entire society
A linear production possibilities curve indicates which of the following?
Constant opportunity costs
Decreasing opportunity costs
Increasing opportunity costs
Diminishing marginal returns
Labor-intensive production
Which of the following explains why a production possibilities curve is often represented as concave (bowed out) from the origin?
The law of demand
The law of supply
Constant returns to scale
Decreasing opportunity cost
Increasing opportunity cost
An outward shift of a production possibilities curve can be caused by
planting a more profitable farm crop
improving technology
using idle resources
changing consumer preferences
increasing the minimum wage
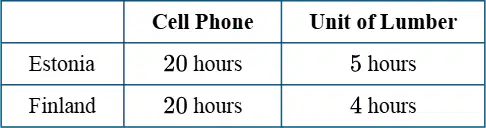
The table provided shows the number of labor hours required to produce a cell phone or a unit of lumber in Estonia and in Finland. Based on the information in the table, which of the following is true?
Estonia has a comparative advantage in producing lumber.
Finland has a comparative advantage in producing cell phones.
Finland has an absolute advantage in producing lumber.
Estonia has both the absolute and comparative advantages in producing lumber.
Neither country has a comparative advantage in producing cell phones.
A farmer in Country A can harvest 20 bushels of wheat or 10 bushels of corn in a day, while a farmer in Country B can harvest 8 bushels of wheat or 8 bushels of corn in a day. If Country A and Country B specialize and trade, Country A will
export wheat and import corn
export corn and import wheat
export both wheat and corn
import both wheat and corn
benefit more from trade than will Country B
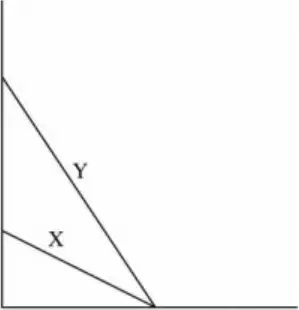
The diagram above shows the production possibilities curves for two countries, Country X and Country Y. Assume that both countries use equal amounts of resources in production. If the two countries engage in trade, both would be better off under which of the following conditions?
Country X produced both cars and planes, because it has an absolute advantage in the production of both goods.
Country Y produced both cars and planes, because it has a comparative advantage in the production of both goods.
Country X specialized in the production of cars, because it has an absolute advantage in the production of cars.
Country X specialized in the production of cars, because it has a comparative advantage in the production of cars.
Country Y specialized in the production of cars, because it has a comparative advantage in the production of cars.
Which of the following will decrease the demand for beef?
An increase in the price of pork, if pork and beef are substitute goods
An increase in the price of potatoes, if potatoes and beef are complementary goods
A decrease in the cost of transporting beef to consumers
An increase in the income levels of most consumers, if beef is a normal good
Research showing beef is better for your health than chicken
Which of the following will cause the demand curve for good X to shift to the right?
An increase in the price of good Z, a complement to good X
An increase in the price of good Y, a substitute for good X
An increase in the consumer’s income, if good X is an inferior good
A decrease in the price of good X
An increase in the supply of good X
Which of the following best describes the law of demand?
The price of a good increases when the demand for the good increases.
The price of a good decreases when the supply of the good decreases.
When the price of a good increases, its demand decreases.
When the price of a good decreases, its quantity demanded increases.
Demand creates its own supply.
Suppose hot dogs and hamburgers are substitutes in consumption. If the supply of hot dogs decreases, which of the following will happen in the market for hamburgers?
The supply curve for hamburgers will shift to the right.
The supply curve for hamburgers will shift to the left.
The demand curve for hamburgers will shift to the right.
The demand curve for hamburgers will shift to the left.
Both the demand curve and supply curve for hamburgers will shift to the left.
Which of the following will shift the supply curve for apples to the right?
An increase in consumers’ income
An increase in the price of apples
An increase in the wages of apple pickers
A decrease in the rental price for apple harvesting equipment
A decrease in the demand for oranges, a substitute in consumption
Which of the following changes will lead to an increase in the supply of good X?
An increase in the price of good X
An increase in the wages of labor used to produce good X
A decrease in the price of energy, a key input to the production of good X
An increase in the demand for good X
A decrease in the number of sellers of good X
Assume that demand for bottled water is relatively price elastic. An increase in supply of bottled water will result in which of the following?
A decrease in price, leading to an increase in total revenue
A decrease in price, leading to a decrease in total revenue
An excess supply of bottled water
An excess demand for bottled water
A relatively small decrease in price and no change in equilibrium quantity
If a 10 percent increase in the price of good X results in a 20 percent decrease in the quantity of good Y demanded, which of the following is true?
Good X and good Y are complementary goods, and the cross-price elasticity is −0.5.
Good X and good Y are substitute goods, and the income elasticity is +2.
Good X and good Y are complementary goods, and the cross-price elasticity is −2.
Good X and good Y are normal goods, and the income elasticity is +2.
Good X and good Y are substitute goods, and the cross-price elasticity is −2.
Which of the following is true of the cross-price elasticity of demand?
It can indicate if a good is a necessity or a luxury.
It is greater than zero for two goods that are substitutes.
It is close to zero if the two goods are closely related.
It is always negative because demand curves are downward sloping.
It increases as income increases.
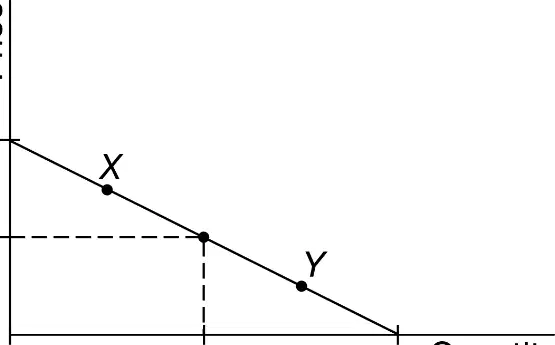
Which of the following statements is true about the demand curve above?
Demand is elastic at each given price because the slope is constant and equal to −2.
The elasticity of demand decreases when moving from point X to point Y.
The elasticity of demand increases when moving from point X to point Y.
Demand is inelastic between quantities 0 and 4.
Demand is elastic between quantities 4 and 8.
Which of the following combinations is most likely to result in the demand for a product being highly price inelastic?
The product has few close substitutes and represents a small percentage of a consumer’s income.
The product has few close substitutes and represents a large percentage of a consumer’s income.
The product has many close substitutes and represents a small percentage of a consumer’s income.
The product has many close substitutes and represents a moderate percentage of a consumer’s income.
The product has many close substitutes and represents a large percentage of a consumer’s income.
Cross-price elasticity of demand for honey with respect to yogurt is –4. At the current equilibrium, consumers are buying 100 containers of yogurt per week and 20 containers of honey per week. If the price of yogurt increases by 10 percent per container, what will be the new quantity demanded of honey?
4 containers
8 containers
10 containers
12 containers
40 containers
A 10 percent increase in Sandra’s income causes Sandra’s consumption of milk to decrease from 10 cartons to 6 cartons. Sandra’s income elasticity of demand for milk is
greater than zero and therefore milk is a necessity
greater than zero and therefore milk is a normal good
less than zero and therefore milk is a normal good
less than zero and therefore milk is an inferior good
greater than one and therefore milk is a necessity
In which of the following cases would a firm’s total revenue increase?
Price increases and demand is elastic.
Price decreases and supply is inelastic.
Price decreases and demand is elastic.
Price decreases and supply is elastic.
Price decreases and demand is inelastic.
At the market equilibrium price, what are the consumer surplus and the producer surplus?
Consumer surplus is 200;producersurplusis 200
Consumer surplus is 100;producersurplusis 100
Consumer surplus is 50;producersurplusis 50
Consumer surplus is 45;producersurplusis 15
Consumer surplus is 10;producersurplusis 10
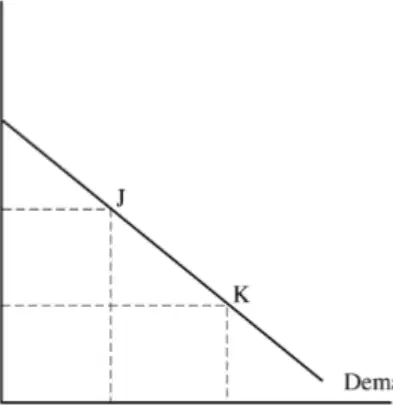
The difference between the price a consumer would be willing to pay for a cone of ice cream and the actual market price that she pays gives a measure of her
consumer surplus
producer surplus
marginal utility
marginal cost
ability to pay
Given the demand curve, if price decreases from 8to 4 per unit, total consumer surplus will
increase by $4
increase by $8
increase by $12
increase by $18
remain constant at $24
If the market demand for a good is inelastic and the supply is elastic, which of the following is true when there is an increase in sales tax?
Consumers will bear most of the burden of the tax.
Producers will bear all of the burden of the tax.
Producers will bear most of the burden of the tax or risk losing sales.
Both consumers and producers will share the burden of the tax equally.
The price of the good will not change.
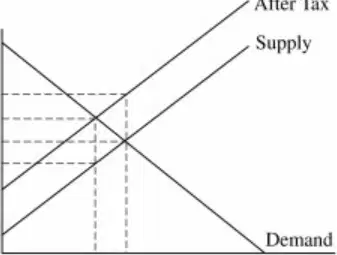
According to the diagram, what is the dollar amount of the unit tax?
$0.00
$0.45
$0.55
$1.00
$1.45
Which of the following will occur if the government imposes a price ceiling below the equilibrium price of a good?
The quantity sold will exceed the equilibrium quantity.
Firms’ total revenues will increase if demand is price elastic.
There will be a shortage in the market.
All firms will shut down, since price is below the equilibrium price.
Price will exceed the marginal cost of producing the last unit sold.
Assume that the current market equilibrium price for milk is 2.80pergallonandthat5milliongallonsaresoldperday.Ifthegovernmentsetsapriceceilingof 2.00 per gallon, which of the following is true?
The demand for milk will increase.
The supply of milk will decrease.
There will be an excess supply of milk in the market.
More than 5 million gallons of milk will be sold.
Less than 5 million gallons of milk will be sold.
An effective price floor placed on a market for a good will have which of the following effects on the quantity purchased by consumers and the consumer surplus?
Quantity will exceed, and consumer surplus will increase
Quantity will decrease, and consumer surplus will decrease
Quantity will increase, and consumer surplus will not change
Quantity will increase, and consumer surplus will increase
Quantity will not change, and consumer surplus will decrease
If the demand for a good is perfectly price inelastic in the short run and the supply curve is upward sloping, imposing a sales tax on the good will
leave the price paid by consumers unchanged
decrease the after-tax revenues received by suppliers
increase the after-tax revenues received by suppliers
not change the after-tax revenues received by suppliers
not change the total expenditures by consumers on the good
Assume that the market for a good is characterized by a downward-sloping demand curve and an upward-sloping supply curve. Suppose that there is an improvement in technology for producing the good. Which of the following would occur?
The impact on consumer surplus would be indeterminate, because of the offsetting impact of the changes in equilibrium price and quantity.
The change in equilibrium price would cause producer surplus to increase.
The total economic surplus in the market would increase.
The demand curve would shift right in response to an increase in the equilibrium price.
The supply curve would shift up resulting in an increase in the equilibrium price and the producer surplus.
If the supply of fish increases, there will be
an increase in the demand for chicken, a substitute good
an increase in the demand for fish
an increase in the price of fish tacos
a decrease in the price of fish
a decrease in the supply of potatoes, a complementary good
Assume that more corn is used to produce ethanol. Simultaneously, more effective control of pests and weeds occurs in farming. Which of the following will definitely occur in the corn market?
The price of corn will increase.
The quantity of corn will decrease.
The price of corn will decrease.
The quantity of corn will increase.
The supply of corn will decrease.
The market for goldfish is perfectly competitive. From year 1 to year 2, both the price and the quantity of goldfish sold increase. This is most likely caused by
an increase in the supply
a decrease in the supply
an increase in the demand
a decrease in the demand
a decrease in both the demand and the supply
Assume that mustard and ketchup are considered substitutes by consumers. If the price of mustard increases, which of the following graphs represents the most likely response in the ketchup market?
[Graph: Demand curve shifts right from Q1 to Q2, price increases from P1 to P2]
[Graph: Demand curve shifts left from Q1 to Q2, price decreases from P1 to P2]
[Graph: Demand curve shifts right from Demand1 to Demand2, supply unchanged]
[Graph: Demand curve shifts left from Demand1 to Demand2, supply unchanged]
[Graph: Supply curve shifts right from Supply1 to Supply2, demand unchanged]
Which of the following would most likely result in a decrease in the equilibrium price of oranges?
The weather during this orange-growing season is not as good as it was last year.
The price of apples, a substitute for oranges, is higher this year than last year.
New studies suggest that oranges contain traces of cancer-causing substances due to pesticide residue.
A tree-killing fungus spreads through orange orchards across the country.
Firms in the orange industry launch an effective advertising campaign.
Assume the market for a good is in equilibrium. An increase in the market supply of the good will result in
a shortage at the original price of the good, which causes the market price to decrease
a shortage at the original price of the good, which causes the market price to increase
a surplus at the original price of the good, which causes the market price to decrease
a surplus at the original price of the good, which causes the market price to increase
neither a surplus nor a shortage
If both supply and demand for wheat increase, the equilibrium price and quantity of wheat will most likely change in which of the following ways?
Price: Decrease, Quantity: Decrease
Price: Decrease, Quantity: Increase
Price: Indeterminate, Quantity: Increase
Price: Increase, Quantity: Decrease
Price: Increase, Quantity: Indeterminate
Assume that the market for beef is perfectly competitive and in equilibrium. Which of the following would most likely result in an increase in both the equilibrium price and the equilibrium quantity of beef?
An increase in the supply of chicken, a substitute good
A decrease in consumers’ income, assuming that beef is a normal good
An increase in the supply of potatoes, a complementary good
An increase in the price of corn, an input in the production of beef
An announcement by the medical community that consumption of beef increases the risk of heart disease
The table provided shows the market demand and supply schedules for wheat. Which of the following is true?
At a price of $1, there is excess supply of wheat and the price will decrease.
At a price of $2, there is excess demand for wheat and the price will decrease.
At a price of $3, there is excess demand for wheat and the price will increase.
At a price of $4, there is excess supply of wheat and the price will decrease.
At a price of $5, there is excess demand for wheat and the price will increase.
Which of the following is most likely to occur when a competitive market adjusts from one equilibrium to another?
A decrease in demand will cause the equilibrium price, equilibrium quantity, and total surplus to increase.
An increase in demand will cause the equilibrium price, equilibrium quantity, and producer surplus to increase.
A decrease in supply will cause the equilibrium price to decrease, the equilibrium quantity to increase, and consumer surplus to decrease.
An increase in supply will cause the equilibrium price to increase, the equilibrium quantity to decrease, and consumer surplus to increase.
A decrease in supply and increase in demand will cause the equilibrium quantity to decrease but the equilibrium price to be indeterminate.
Total economic surplus will be maximized at which of the following price and quantity combinations?
P3 and Q3
P3 and Q1
P2 and Q2
P1 and Q1
P1 and Q3
In the market described by the diagram above, the total economic surplus will be maximized at which of the following price and quantity combinations?
P3 and Q1
P3 and Q3
P2 and Q2
P1 and Q1
P1 and Q3
In the absence of market failures, a perfectly competitive market equilibrium is efficient for which of the following reasons?
Consumer surplus is maximized and consumers are better off relative to producers.
Producer surplus is maximized and producers are better off relative to consumers.
Total economic surplus is maximized and all mutually beneficial transactions are exhausted.
Total economic surplus is distributed equally between producers and consumers.
The quantity of output is produced at a constant cost so that every consumer pays the same price.
What number is shown in the table?
1
2
3
4
What number is shown in the table?
2
5
8
10
What number is shown in the table?
3
5
7
9
What number is shown in the table?
4
2
7
9
What number is shown in the table?
5
3
7
9
What number is shown in the table?
6
3
8
12
What number is shown in the table?
7
3
5
9
What number is shown in the table?
8
5
12
3
What number is shown in the table?
9
5
12
7
What number is shown in the table?
10
5
7
12
What number is shown in the table?
11
7
15
22
What number is shown in the table?
12
8
15
20
What number is shown in the table?
13
7
21
9
What number is shown in the table?
14
12
18
20
What number is shown in the table?
15
12
18
21
What number is shown in the table?
16
12
24
8
What number is shown in the table?
17
23
12
8
What number is shown in the table?
18
12
25
30
What number is shown in the table?
19
12
25
34
What number is shown in the table?
20
15
25
30
What number is shown in the table?
21
15
34
8
What number is shown in the table?
22
15
34
47
What number is shown in the table?
23
15
42
67
What number is shown in the table?
24
12
36
48
What number is shown in the table?
25
12
37
48
What number is shown in the table?
26
14
32
47
What number is shown in the table?
27
15
34
42
What number is shown in the table?
28
15
42
63
What number is shown in the table?
29
15
42
63
What number is shown in the table?
30
25
40
12
What number is shown in the table?
31
24
45
12
What number is shown in the table?
32
25
18
40
What number is shown in the table?
33
21
45
17
What number is shown in the table?
34
21
56
89
What number is shown in the table?
35
27
42
18
What number is shown in the table?
36
24
48
15
What number is shown in the table?
37
24
51
89
What number is shown in the table?
38
24
56
71
What number is shown in the table?
39
27
45
52
What number is shown in the table?
40
25
52
67
What number is shown in the table?
41
32
56
27
What number is shown in the table?
42
17
56
89
What number is shown in the table?
43
27
56
89
What number is shown in the table?
44
32
56
27
What number is shown in the table?
45
32
67
12

