
NEW
Font size
 Worksheets
Aggregate Demand and Aggregate Supply Analysis
Total questions: 20
Worksheet time: 10mins

Given the topic "Aggregate demand and aggregate supply analysis," devise a scenario where a government increases its spending. Using strategic reasoning, explain how this action could affect both aggregate demand and aggregate supply in the macroeconomy.
Government spending increases aggregate demand, which may lead to higher output and prices, and could also incentivize firms to increase aggregate supply in the long run.
Government spending decreases aggregate demand, leading to lower output and prices, and reduces aggregate supply.
Government spending has no effect on aggregate demand or aggregate supply.
Government spending only affects aggregate supply, not aggregate demand.

Given a scenario where the price level in an economy increases, explain how this change would be represented on an aggregate demand (AD) and aggregate supply (AS) diagram. What reasoning would you use to determine whether the movement is along the curve or a shift of the curve?
The change is represented by a movement along the AD and AS curves, as price level changes do not shift the curves.
The change is represented by a rightward shift of the AD curve, as price level increases always shift demand.
The change is represented by a leftward shift of the AS curve, as price level increases always reduce supply.
The change is represented by simultaneous shifts of both AD and AS curves, regardless of the cause.
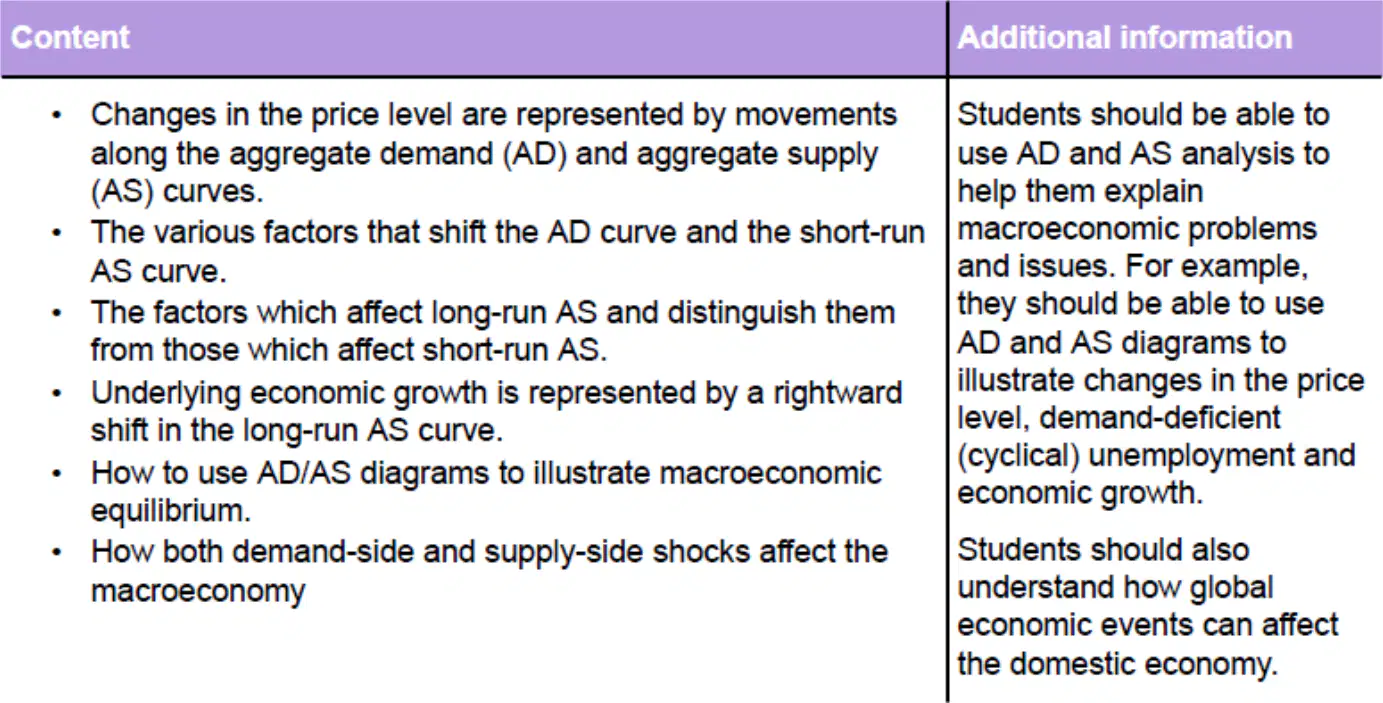
Using AD/AS diagrams, plan how you would illustrate the impact of a demand-side shock versus a supply-side shock on macroeconomic equilibrium. What evidence would you use to support your analysis?
A demand-side shock shifts the AD curve, affecting output and price level, while a supply-side shock shifts the AS curve, impacting output and price level differently; evidence includes changes in consumer confidence or production costs.
Both demand-side and supply-side shocks only shift the AD curve, with no effect on the AS curve.
Demand-side shocks only affect unemployment, while supply-side shocks only affect inflation.
Demand-side shocks shift the AS curve, while supply-side shocks shift the AD curve.

Evaluate how global economic events can strategically impact the domestic economy using AD and AS analysis. What reasoning would you use to explain these effects?
Global economic events can shift both AD and AS curves in the domestic economy, depending on factors such as trade, investment flows, and resource availability; reasoning involves analyzing how external shocks affect domestic demand and supply.
Global economic events only affect the domestic economy’s price level, with no impact on output or employment.
Global economic events have no effect on the domestic economy if the country is self-sufficient.
Global economic events only shift the AD curve, never the AS curve.
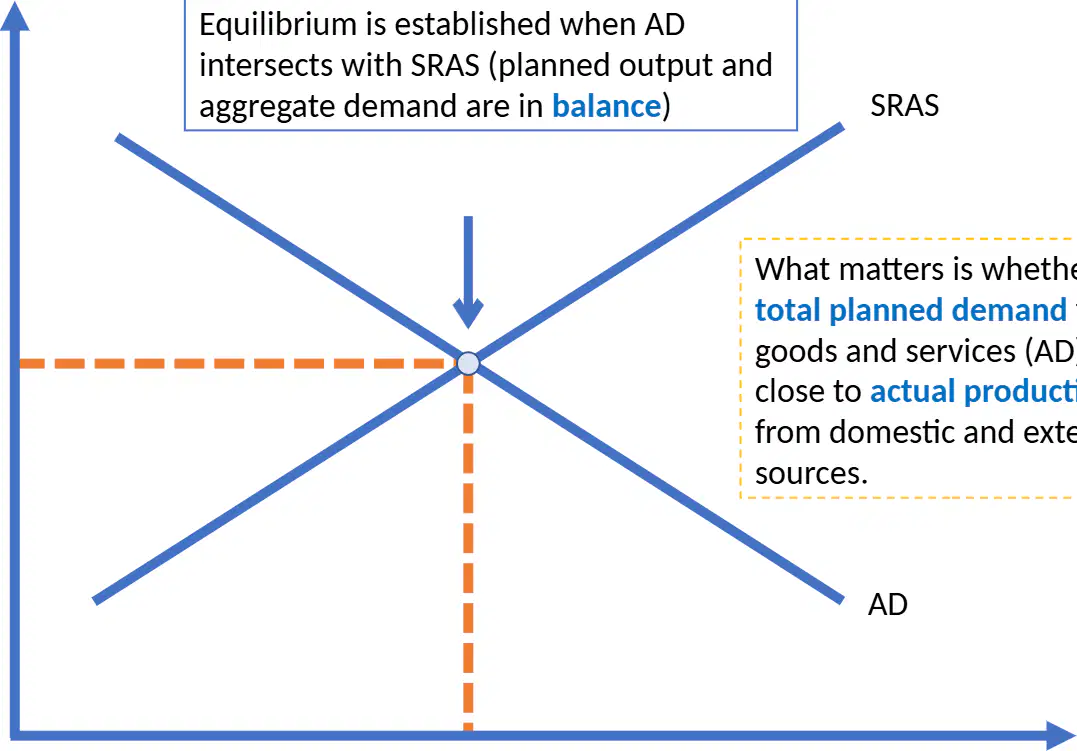
Using the AD-AS analysis, explain why equilibrium GDP is established at the intersection of AD and SRAS, and discuss the implications if total planned demand is not close to actual production.
Equilibrium GDP is established at the intersection because planned output and aggregate demand are balanced; if demand is not close to production, there will be either excess supply or excess demand, leading to changes in output or price level.
Equilibrium GDP is established at the intersection because only aggregate demand matters; if demand is not close to production, nothing changes.
Equilibrium GDP is established at the intersection because SRAS is always greater than AD; if demand is not close to production, prices remain constant.
Equilibrium GDP is established at the intersection because real GDP is always fixed; if demand is not close to production, output cannot change.
Explain how a shift in the Aggregate Demand (AD) or Long Run Aggregate Supply (LRAS) curves would affect the long run equilibrium in an economy. Use reasoning and evidence to support your answer.
The equilibrium remains unchanged regardless of shifts in AD or LRAS.
The equilibrium changes to a new position when either AD or LRAS shifts.
Only shifts in AD affect the equilibrium, not LRAS.
The equilibrium disappears if either curve shifts.
Evaluate the impact of an increase in Aggregate Demand (AD) when the economy is near full employment, but some spare capacity still exists (the 'intermediate zone' of LRAS). What is the most likely outcome?
Output increases without any limitation.
Output increases, but the effect is limited due to reduced spare capacity.
Output decreases as AD increases.
Output remains constant regardless of AD changes.
Strategically reason what happens when Aggregate Demand (AD) increases at full employment in the context of long run equilibrium. What is the expected result?
Output increases significantly with no constraints.
Output remains unchanged, but prices may rise due to no spare capacity.
Output decreases and unemployment rises.
Output and prices both remain unchanged.
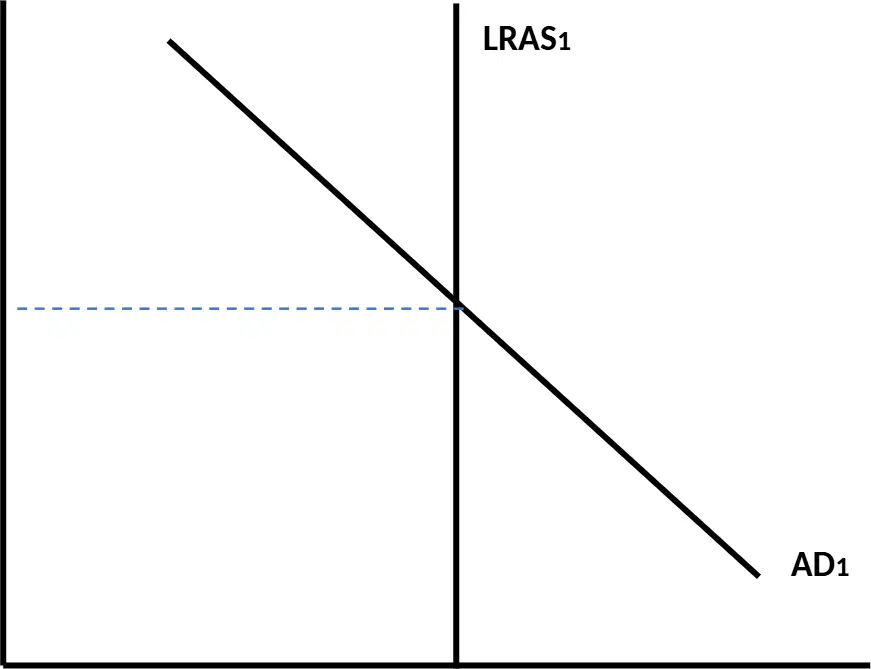
Strategically analyze what would happen to the long-run equilibrium if the LRAS curve shifted to the right in the classical model. What evidence supports your conclusion?
Real GDP would increase, and the economy would achieve a higher level of full employment output.
Price level would decrease, but real GDP would remain unchanged.
The economy would move into a recession, with lower output.
Aggregate demand would decrease, causing a lower equilibrium price level.
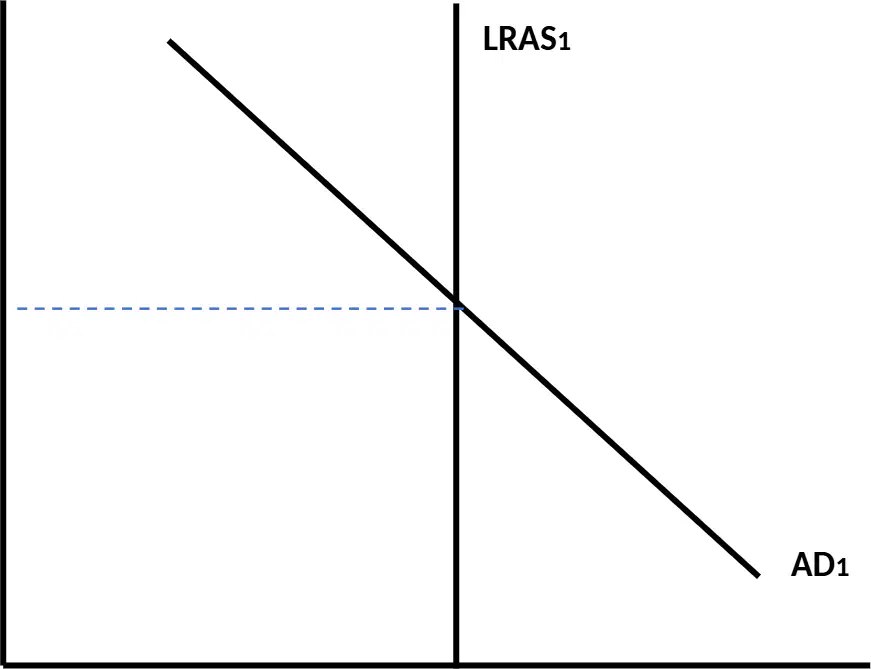
Given the classical model diagram, reason how a change in aggregate demand (AD) would affect the price level and output in the long run. Use evidence from the model to support your answer.
A change in AD will only affect the price level, not the output, in the long run.
A change in AD will increase both price level and output permanently.
A change in AD will decrease both price level and output permanently.
A change in AD will have no effect on either price level or output.
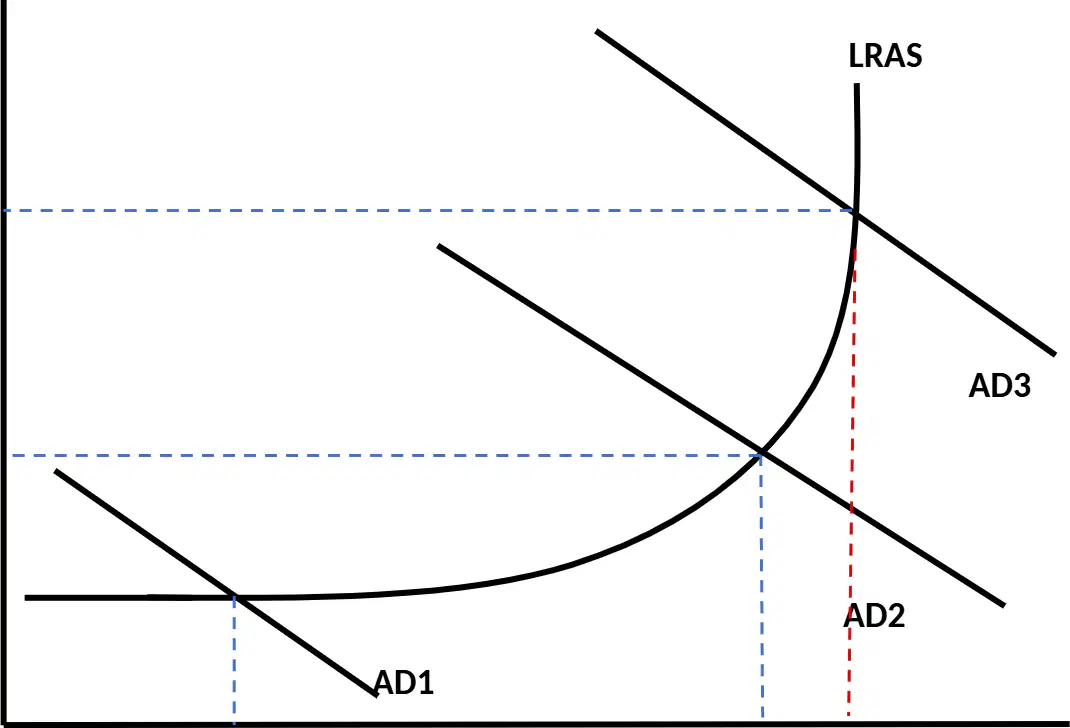
Using the diagram provided, analyze how the movement from AD1 to AD3 affects spare capacity and employment in the economy. What reasoning can you provide for the changes observed as AD increases?
As AD increases from AD1 to AD3, spare capacity decreases and employment rises, eventually reaching full employment at AD3.
As AD increases from AD1 to AD3, spare capacity increases and employment falls.
As AD increases from AD1 to AD3, both spare capacity and employment remain unchanged.
As AD increases from AD1 to AD3, spare capacity increases but employment remains constant.
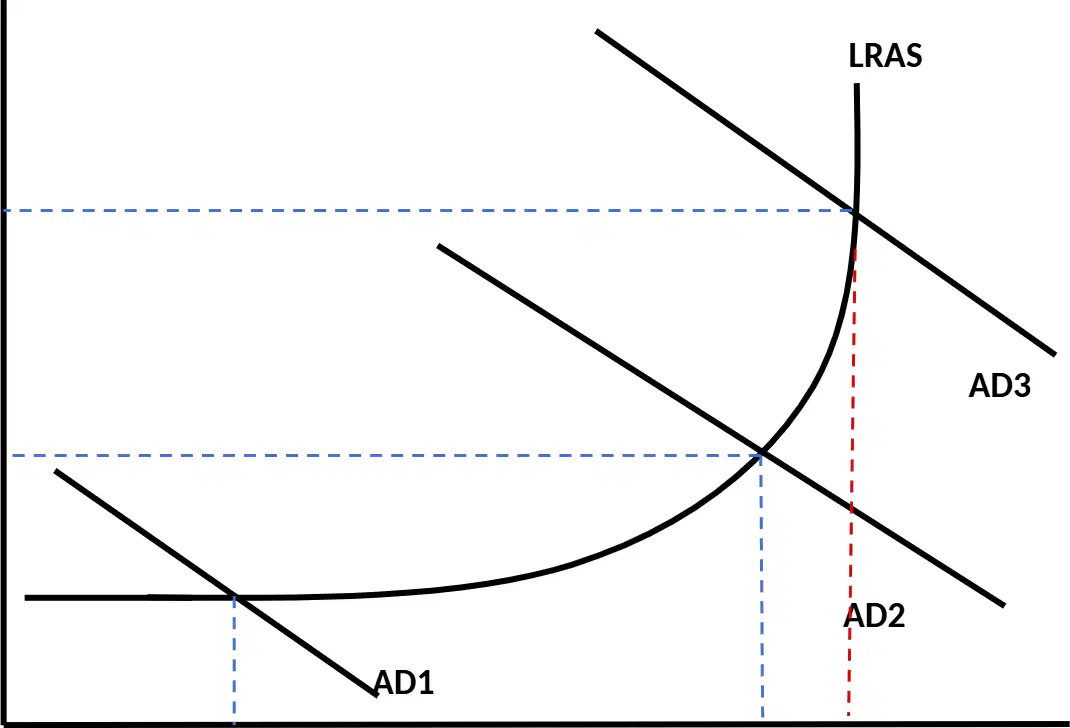
Strategically evaluate why the economy experiences significant spare capacity at AD1 and limited spare capacity at AD2, using evidence from the diagram and your understanding of macroeconomic principles.
At AD1, the economy is in deep recession with low output, leading to significant spare capacity; at AD2, output increases and spare capacity is reduced but not eliminated.
At AD1, the economy is at full employment, so there is no spare capacity; at AD2, spare capacity increases as output falls.
At AD1, spare capacity is limited due to high employment; at AD2, spare capacity becomes significant as unemployment rises.
At AD1, the economy is at equilibrium with no spare capacity; at AD2, spare capacity remains unchanged.
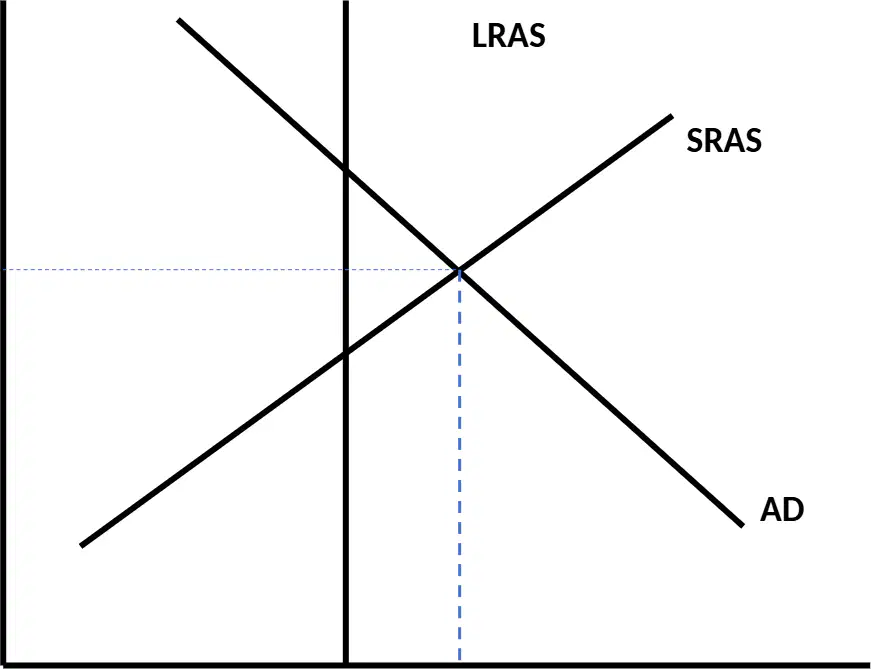
Using the diagram provided, explain what happens to the Short Run Aggregate Supply (SRAS) curve when there is a positive output gap and why this adjustment occurs. What is the long-term implication for the economy?
The SRAS curve shifts to the left because prices and wages fall, leading to a deflationary gap and long-term economic growth.
The SRAS curve shifts to the right because prices and wages rise, leading to a new equilibrium at a higher output level.
The SRAS curve shifts to the left because prices and wages rise, increasing costs of production, and the economy returns to equilibrium at the LRAS curve, making the positive output gap unsustainable in the long run.
The SRAS curve remains unchanged, and the positive output gap persists indefinitely, with no impact on prices or wages.
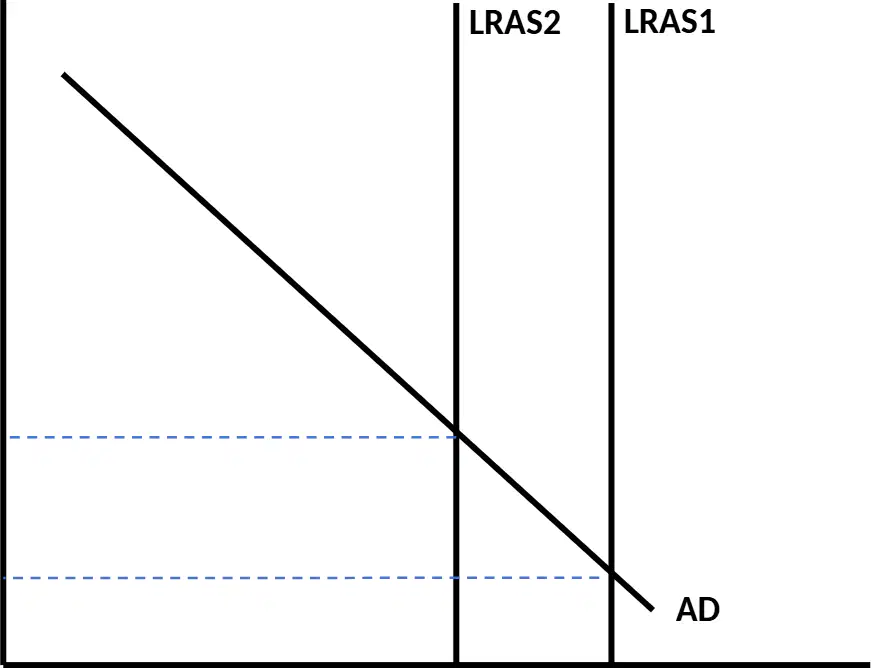
Using the classical model diagram provided, analyze the impact of a decrease in long run aggregate supply (LRAS) on the equilibrium price level and real national output. What reasoning supports your answer?
The equilibrium price level decreases and real national output increases.
The equilibrium price level increases and real national output decreases.
Both equilibrium price level and real national output increase.
Both equilibrium price level and real national output remain unchanged.
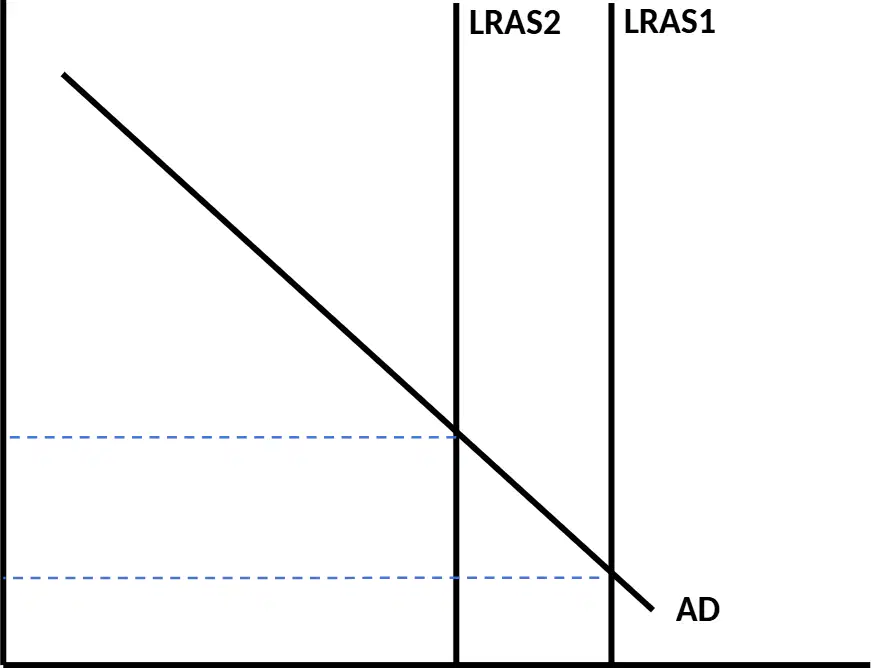
Strategically evaluate why a decrease in long run aggregate supply (LRAS) in the classical model leads to a higher price level, using evidence from the diagram.
Because aggregate demand increases, pushing prices up.
Because the reduction in productive capacity causes scarcity, raising prices.
Because government spending automatically increases.
Because the money supply is reduced by the central bank.
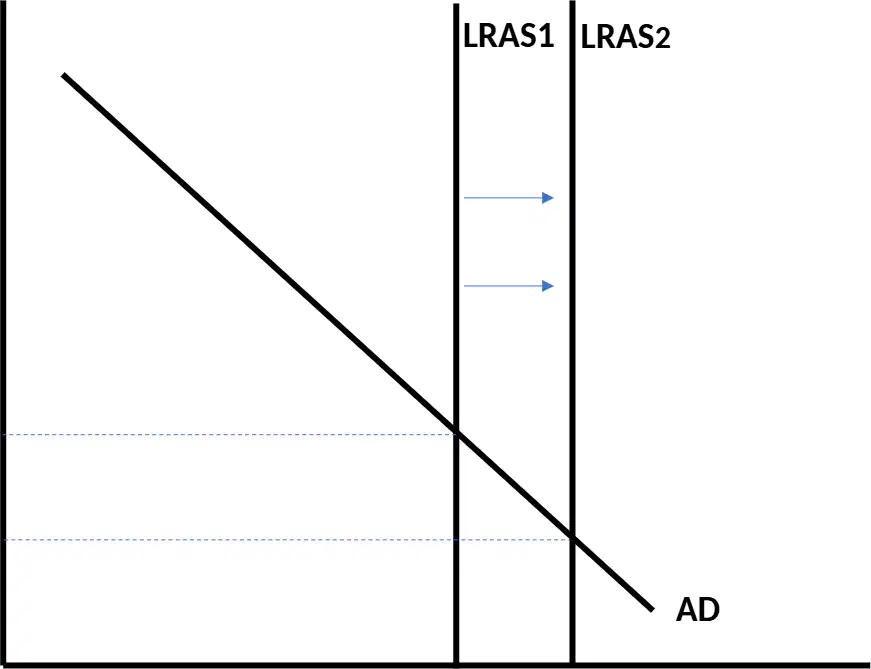
Using the classical model diagram provided, explain the strategic reasoning behind how an increase in long run aggregate supply (LRAS) affects both the price level and real national output. What evidence from the diagram supports your explanation?
An increase in LRAS leads to a higher price level and lower real national output, as shown by the leftward shift of LRAS.
An increase in LRAS leads to a lower price level and higher real national output, as shown by the rightward shift of LRAS.
An increase in LRAS leads to no change in price level or real national output, as LRAS does not affect these variables.
An increase in LRAS leads to a higher price level and higher real national output, as shown by the upward movement of the AD curve.
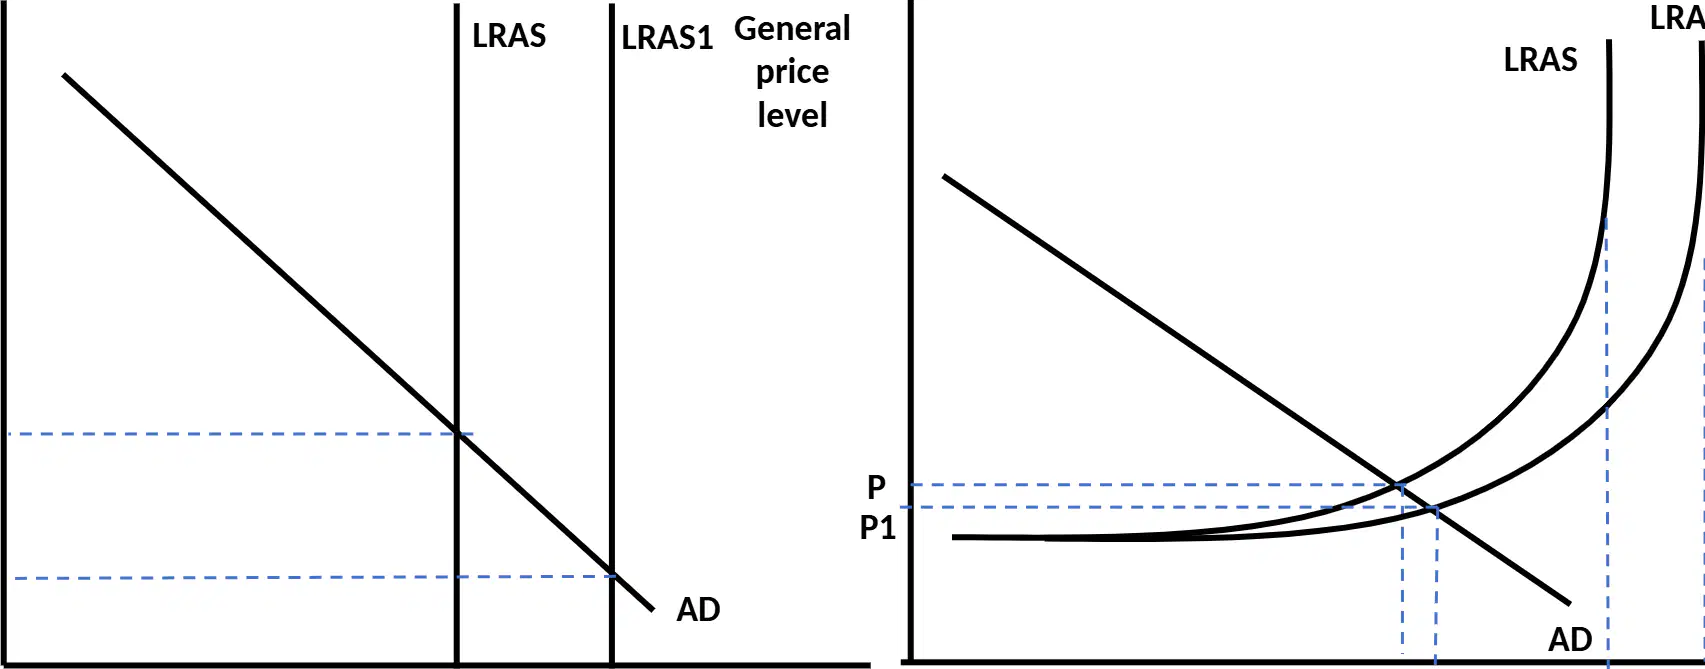
Using the diagrams provided, analyze how an increase in the productive potential of the economy affects the general price level and real GDP in both the classical and Keynesian models. Explain the reasoning behind the differences in outcomes between the two models.
In both models, an increase in productive potential only increases the general price level, with no change in real GDP.
In the classical model, an increase in productive potential increases real GDP and decreases the general price level, while in the Keynesian model, it increases real GDP with little change in the price level until full employment is reached.
In the Keynesian model, an increase in productive potential decreases real GDP and increases the general price level, while in the classical model, it increases both.
Both models show no change in general price level or real GDP when productive potential increases.
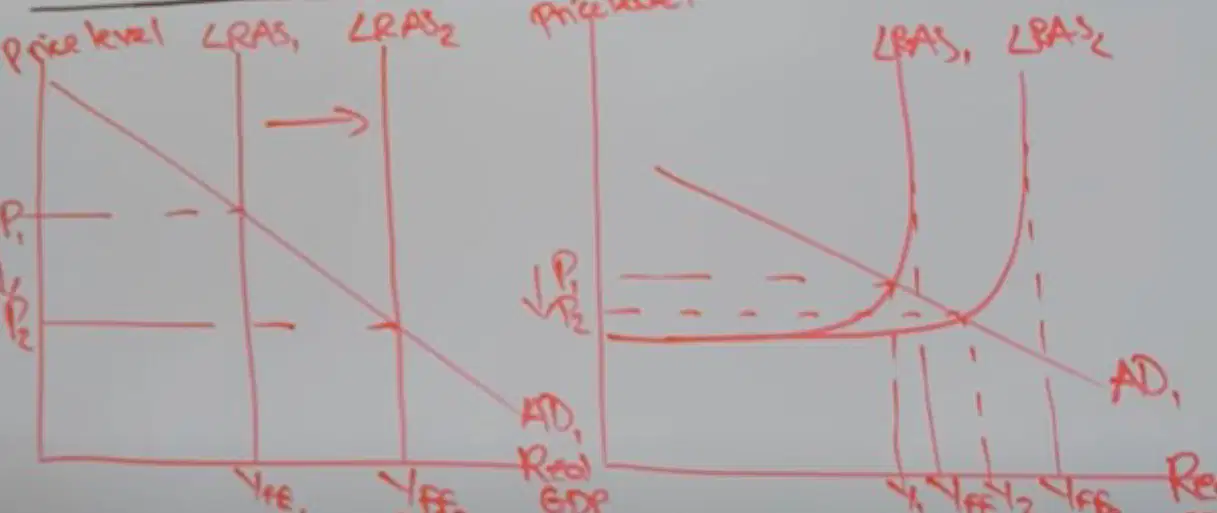
Strategically evaluate the impact of a leftward shift in the LRAS curve on the economy using evidence from both the Classical and Keynesian models. What are the likely outcomes for output and prices?
Output decreases and price levels rise, indicating reduced productive capacity in both models.
Output increases and price levels fall, showing improved productive capacity.
Output and price levels remain unchanged in both models.
Output decreases but price levels fall, indicating deflation.
Consider the Keynesian long run equilibrium. How does the existence of significant spare capacity during a deep recession affect the impact of an increase in aggregate supply (AS)? Use reasoning and evidence to support your answer.
The increase in AS leads to a large rise in output with little change in price level.
The increase in AS leads to a large rise in price level with little change in output.
The increase in AS has no effect on output or price level.
The increase in AS leads to a decrease in output and price level.
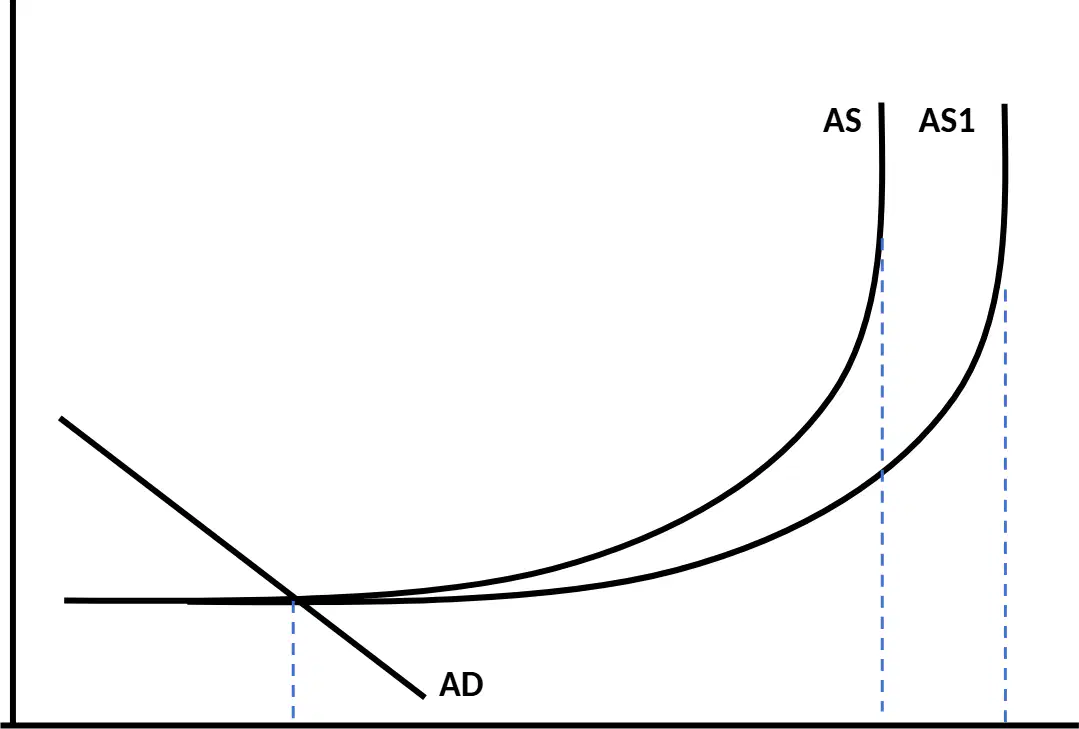
Strategically evaluate how the position of Yfe and Yfe1 in the diagram reflects changes in the economy’s full employment level of output. What evidence from the diagram supports your reasoning?
The shift from Yfe to Yfe1 indicates an increase in the full employment level of output, supported by the rightward shift of the AS curve.
The shift from Yfe to Yfe1 indicates a decrease in the full employment level of output, supported by the leftward shift of the AS curve.
The position of Yfe and Yfe1 shows no change in the full employment level of output, as the AS curve remains unchanged.
The position of Yfe and Yfe1 indicates a decrease in aggregate demand, supported by the downward slope of the AD curve.

