


Correlation vs Causation Presentations
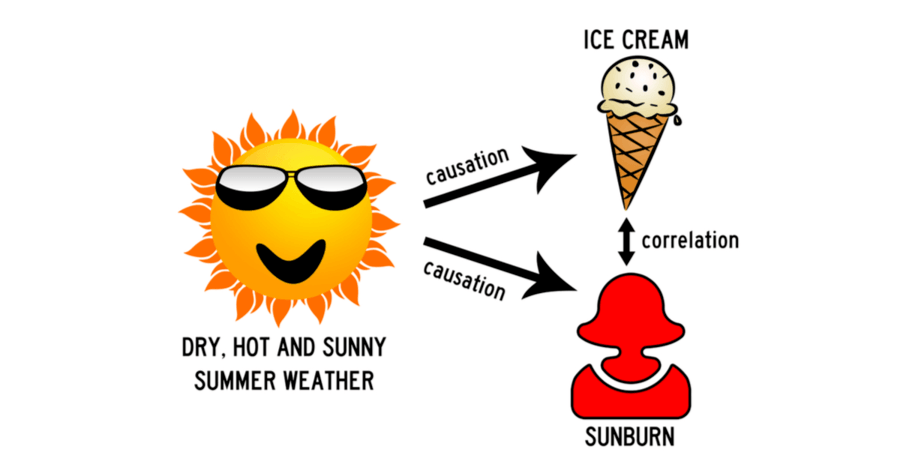
This comprehensive mathematics presentation explains the critical difference between correlation and causation through visual learning and structured instruction. Students will master identifying when variables are merely related versus when one actually causes another, preventing common statistical interpretation errors.

18 questions
Causation

Presentation
•
9th Grade

45 questions
Linear Models in Data
Presentation
•
9th - 12th Grade
45 questions
Using Linear Models
Presentation
•
9th - 12th Grade
42 questions
Correlation & Causation (Asynchronous)
Presentation
•
7th - 12th Grade

24 questions
10.2 - Causation (Wednesday)
Presentation
•
9th - 12th Grade

13 questions
Correlation
Presentation
•
9th Grade
45 questions
EOC Review: Scatter Plots & Correlation
Presentation
•
9th - 12th Grade
10 questions
Causation Warm-Up
Presentation
•
9th Grade
25 questions
Correlation Coefficient
Presentation
•
9th Grade
17 questions
4/3 Misc Review-Calculator, Factoring, Association/Causation
Presentation
•
9th Grade
44 questions
Correlation Coefficient
Presentation
•
9th Grade
23 questions
Pearson's Product - Bivariate Linear Correlation
Presentation
•
11th Grade
Browse by grade
Explore Correlation vs Causation Presentations
Correlation vs causation presentations provide mathematics educators with comprehensive visual learning tools that clarify one of the most critical distinctions in probability and statistics. These structured instructional resources guide students through the fundamental difference between statistical relationships and true cause-and-effect connections, using real-world examples and clear concept explanations to build analytical thinking skills. Students develop the ability to critically evaluate data interpretations, distinguish between coincidental patterns and meaningful relationships, and apply logical reasoning to statistical claims they encounter in academic work and daily life. Wayground's extensive collection of teacher-created presentations offers millions of correlation vs causation resources with robust search and filtering capabilities that help educators locate materials perfectly aligned to their curriculum standards and student needs. Teachers can customize these digital presentations to support differentiated instruction, whether providing foundational concept explanations for struggling learners or advanced statistical analysis challenges for gifted students. The platform's flexible delivery formats enable seamless integration into lesson planning, targeted remediation sessions, and enrichment activities, while comprehensive customization tools allow educators to modify content, adjust complexity levels, and incorporate school-specific examples that reinforce proper statistical reasoning and critical evaluation skills across diverse learning environments.

Accessibility
Features
Wayground Super
School & District
Wayground for Business
Create a quiz
Create a presentation
Wayground AI
Subjects
Mathematics
Social Studies
Science
Physics
Chemistry
Biology
About
Our Story
Wayground Blog
Media Kit
Careers
Support
F.A.Q.
Help & Support
Privacy Policy
Terms of Service
Teacher Resources
2026 Wayground


Get our app

