Bivariate Data: scatter plots, trends, and line of best fit QUIZ - พิมพ์ได้ เส้นที่พอดีที่สุด เวิร์กชีท - Quizizz
Bivariate Data: scatter plots, trends, and line of best fit QUIZ

12 คิว

8th

Scatter Lot, Line of Best Fit, Outliers - พิมพ์ได้ เส้นที่พอดีที่สุด เวิร์กชีท - Quizizz
Scatter Lot, Line of Best Fit, Outliers

15 คิว

8th - Uni

CW: Line of Best Fit - พิมพ์ได้ เส้นที่พอดีที่สุด เวิร์กชีท - Quizizz
CW: Line of Best Fit

34 คิว

8th

Statistics - Line of Best Fit - พิมพ์ได้ เส้นที่พอดีที่สุด เวิร์กชีท - Quizizz
Statistics - Line of Best Fit

18 คิว

10th

Scatter Plots and Line of Best Fit Review - พิมพ์ได้ เส้นที่พอดีที่สุด เวิร์กชีท - Quizizz
Scatter Plots and Line of Best Fit Review

20 คิว

8th - Uni

Scatterplot Correlation Coefficients and Line of Best Fit - พิมพ์ได้ เส้นที่พอดีที่สุด เวิร์กชีท - Quizizz
Scatterplot Correlation Coefficients and Line of Best Fit

20 คิว

9th - Uni

Scatter Plots and Line of Best Fit Review - พิมพ์ได้ เส้นที่พอดีที่สุด เวิร์กชีท - Quizizz
Scatter Plots and Line of Best Fit Review

15 คิว

8th - Uni

Review: Scatterplots and Line of Best Fit - พิมพ์ได้ เส้นที่พอดีที่สุด เวิร์กชีท - Quizizz
Review: Scatterplots and Line of Best Fit

17 คิว

12th

Correlation Line of Best Fit - พิมพ์ได้ เส้นที่พอดีที่สุด เวิร์กชีท - Quizizz
Correlation Line of Best Fit

17 คิว

KG - Uni

Line of Best Fit - พิมพ์ได้ เส้นที่พอดีที่สุด เวิร์กชีท - Quizizz
Line of Best Fit

20 คิว

8th - Uni

Line of Best Fit - พิมพ์ได้ เส้นที่พอดีที่สุด เวิร์กชีท - Quizizz
Line of Best Fit

10 คิว

8th - Uni

Line of Best Fit and Scatter Plots - พิมพ์ได้ เส้นที่พอดีที่สุด เวิร์กชีท - Quizizz
Line of Best Fit and Scatter Plots

13 คิว

7th

Trend Lines (Line of Best Fit) - พิมพ์ได้ เส้นที่พอดีที่สุด เวิร์กชีท - Quizizz
Trend Lines (Line of Best Fit)

25 คิว

6th - 8th

Line of Best Fit - พิมพ์ได้ เส้นที่พอดีที่สุด เวิร์กชีท - Quizizz
Line of Best Fit

14 คิว

8th - Uni

Line of Best Fit - พิมพ์ได้ เส้นที่พอดีที่สุด เวิร์กชีท - Quizizz
Line of Best Fit

15 คิว

8th - Uni

Friday, 4/22: Line of Best Fit - พิมพ์ได้ เส้นที่พอดีที่สุด เวิร์กชีท - Quizizz
Friday, 4/22: Line of Best Fit

21 คิว

8th

Line of Best Fit Review - พิมพ์ได้ เส้นที่พอดีที่สุด เวิร์กชีท - Quizizz
Line of Best Fit Review

20 คิว

9th - 12th

Slope and Y-Intercept of the Line of Best Fit - พิมพ์ได้ เส้นที่พอดีที่สุด เวิร์กชีท - Quizizz
Slope and Y-Intercept of the Line of Best Fit

15 คิว

9th - Uni

Associations and Line of Best Fit Quiz - พิมพ์ได้ เส้นที่พอดีที่สุด เวิร์กชีท - Quizizz
Associations and Line of Best Fit Quiz

15 คิว

8th

Predictions Line of Best Fit - พิมพ์ได้ เส้นที่พอดีที่สุด เวิร์กชีท - Quizizz
Predictions Line of Best Fit

12 คิว

9th - Uni

Find Line of Best Fit - พิมพ์ได้ เส้นที่พอดีที่สุด เวิร์กชีท - Quizizz
Find Line of Best Fit

13 คิว

9th - Uni

Scattered Plot and Line of Best Fit - พิมพ์ได้ เส้นที่พอดีที่สุด เวิร์กชีท - Quizizz
Scattered Plot and Line of Best Fit

11 คิว

8th

Slope Line of Best Fit - พิมพ์ได้ เส้นที่พอดีที่สุด เวิร์กชีท - Quizizz
Slope Line of Best Fit

15 คิว

8th - Uni

Line of Best Fit Scatterplots - พิมพ์ได้ เส้นที่พอดีที่สุด เวิร์กชีท - Quizizz
Line of Best Fit Scatterplots

20 คิว

8th - Uni

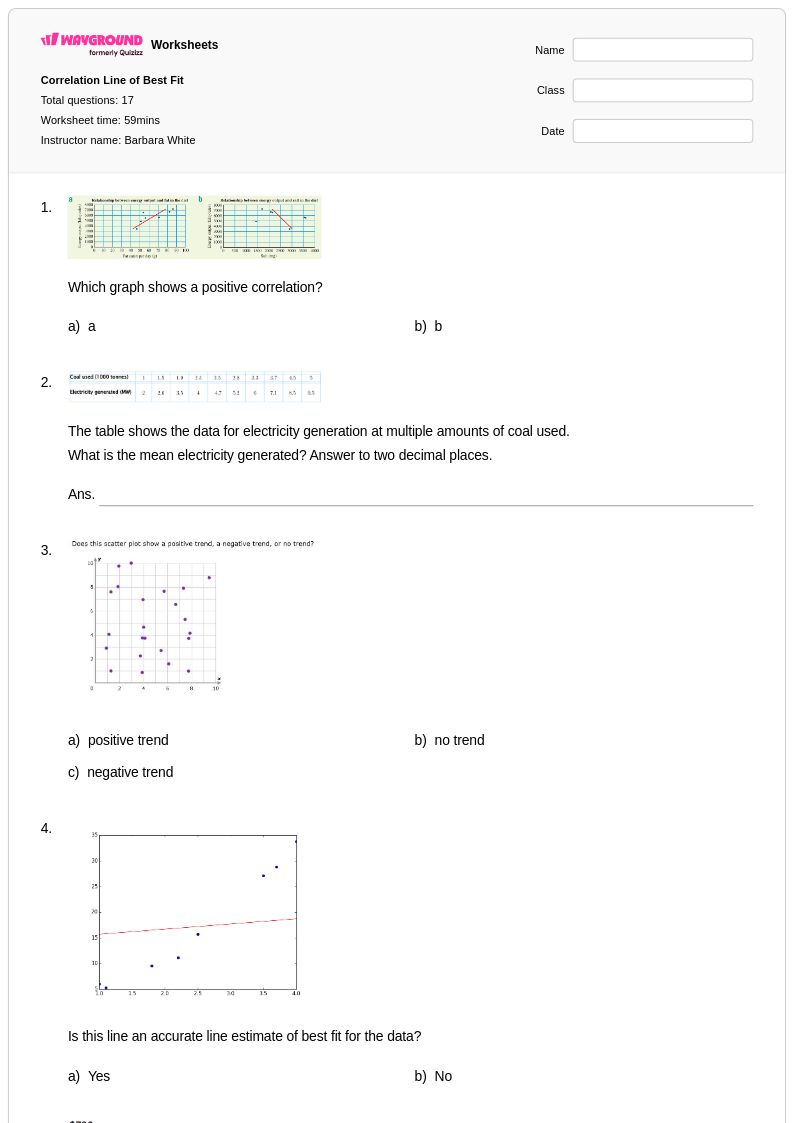
สำรวจแผ่นงาน เส้นที่พอดีที่สุด ที่พิมพ์ได้

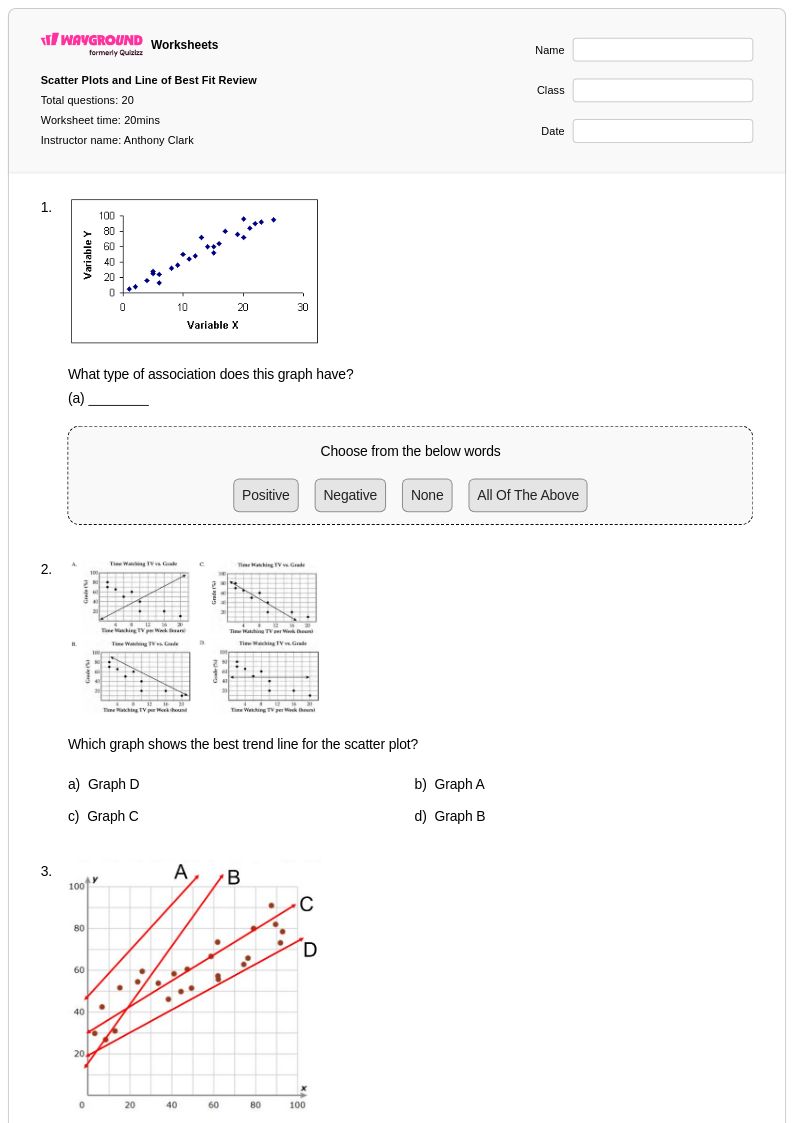
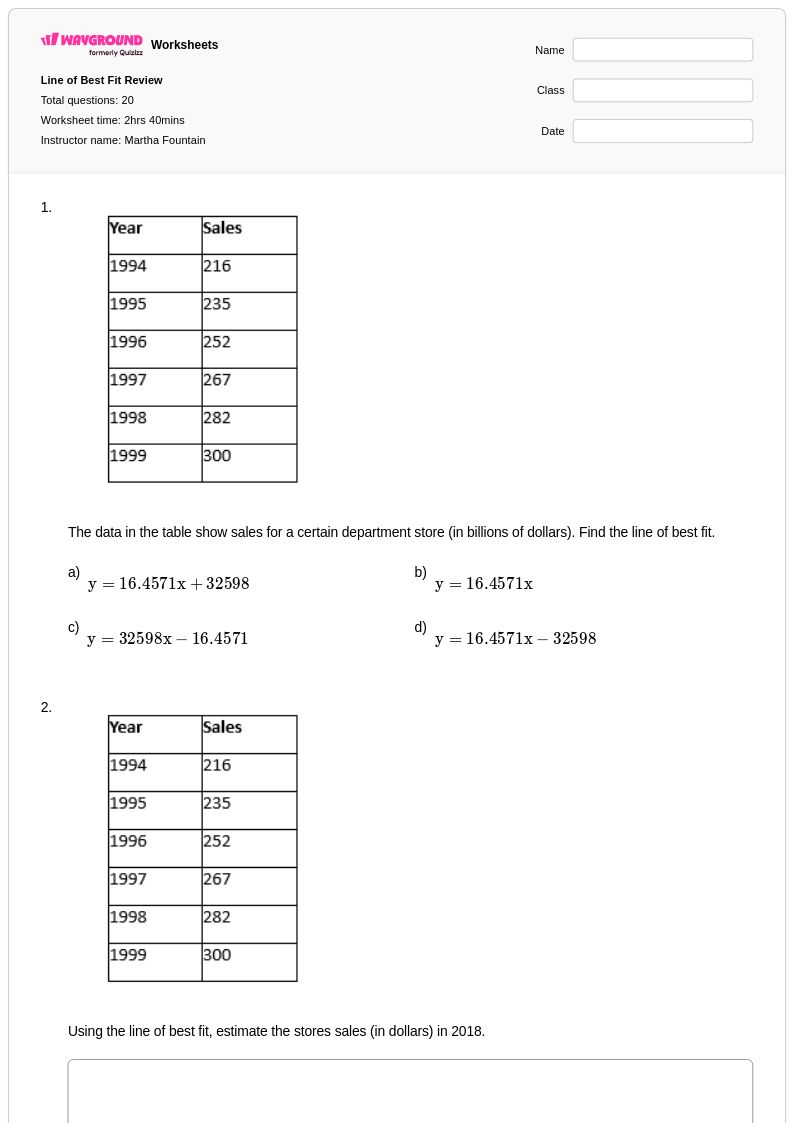
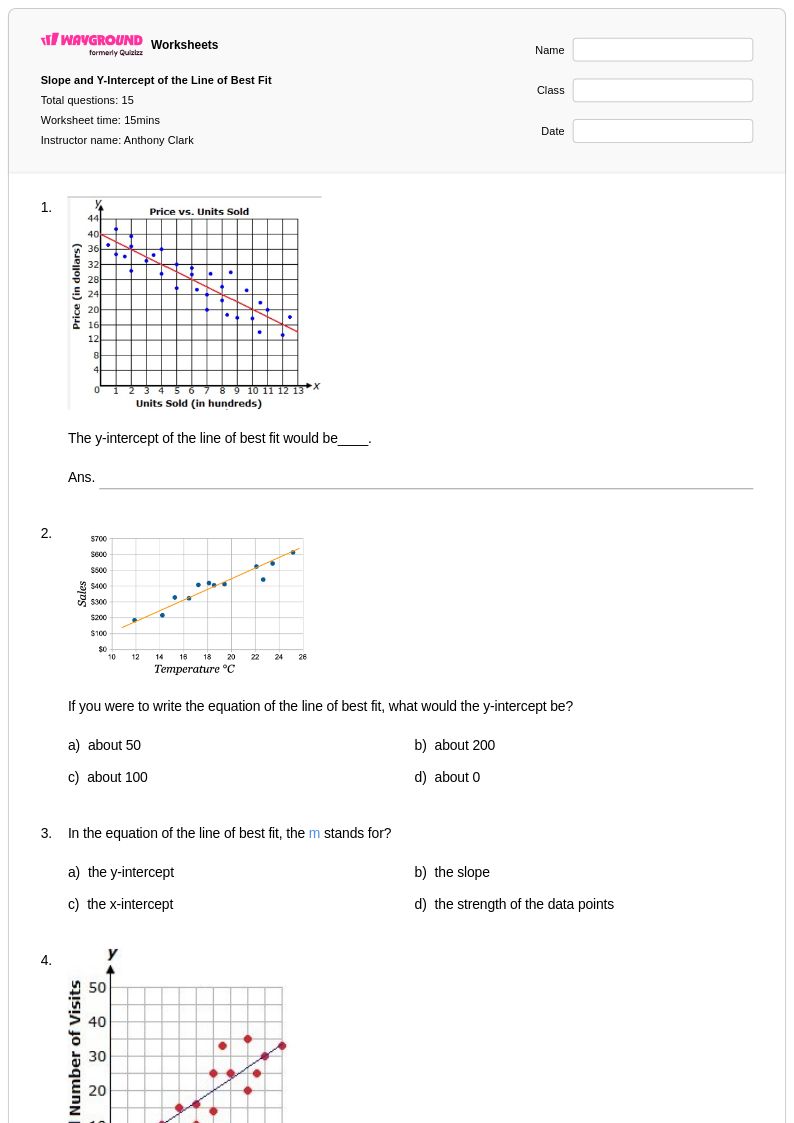
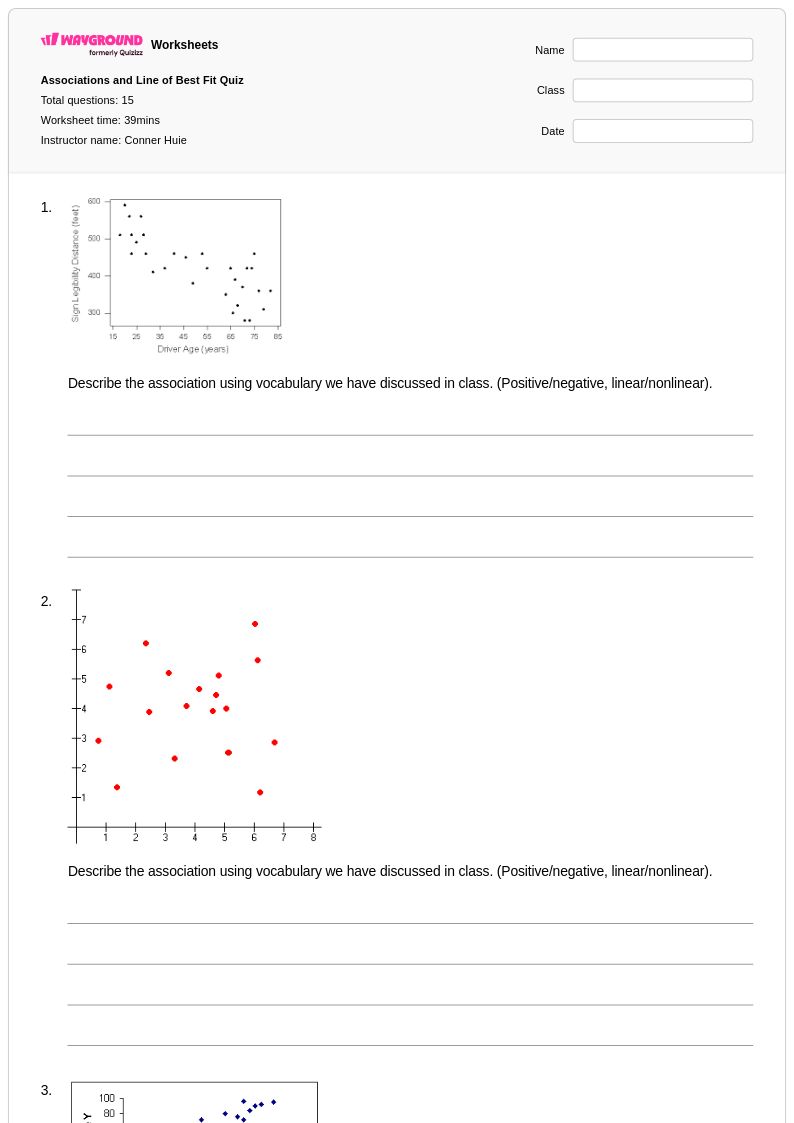
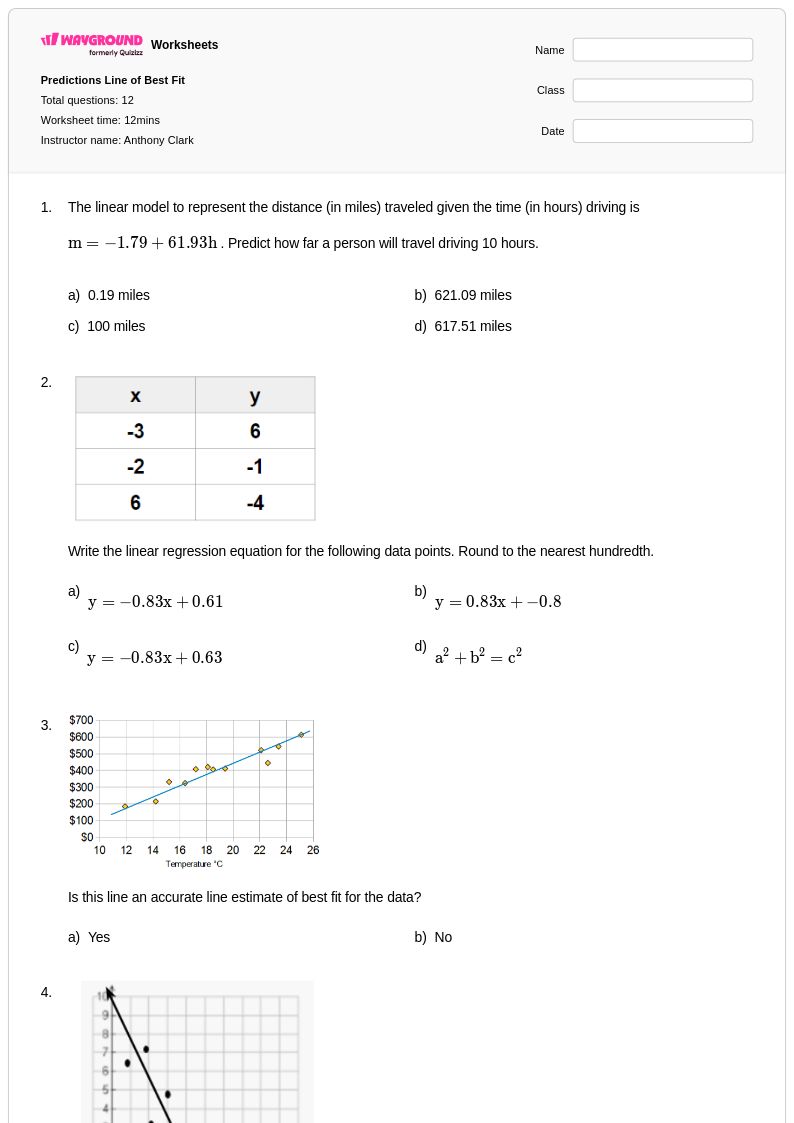
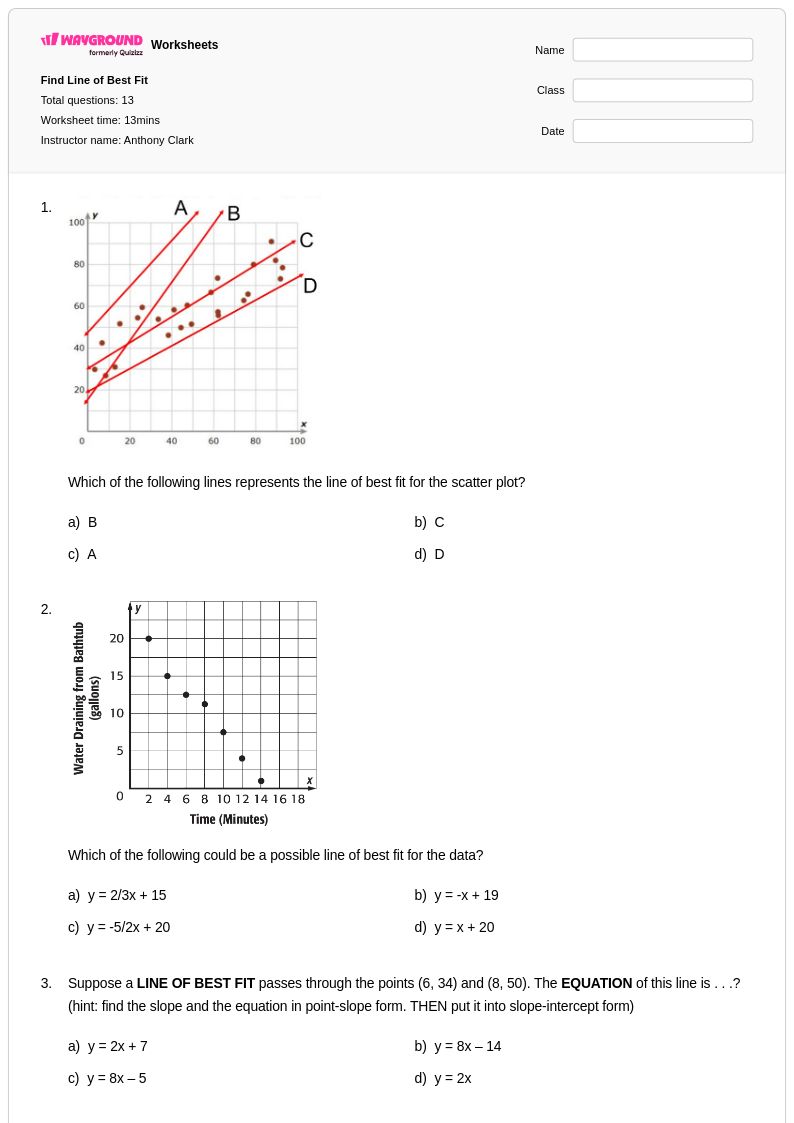
แบบฝึกหัดการหาเส้นแนวโน้มที่ดีที่สุด (Line of best fit) จาก Wayground (เดิมคือ Quizizz) เป็นแบบฝึกหัดที่ครอบคลุมสำหรับนักเรียนที่กำลังเรียนรู้การวิเคราะห์แผนภาพกระจายและการหาความสัมพันธ์เชิงเส้นในชุดข้อมูล แหล่งข้อมูลทางคณิตศาสตร์เหล่านี้มุ่งเน้นการพัฒนาทักษะที่สำคัญในการสร้างเส้นแนวโน้ม การคำนวณสัมประสิทธิ์สหสัมพันธ์ การตีความค่าความชันและค่าจุดตัดแกน y และการคาดการณ์โดยใช้แบบจำลองเชิงเส้น นักเรียนจะได้ทำแบบฝึกหัดที่หลากหลาย ตั้งแต่การลงจุดและลากเส้นแนวโน้มที่ดีที่สุดโดยประมาณด้วยมือ ไปจนถึงการใช้วิธีทางสถิติเพื่อหาค่าสมการที่แม่นยำ แบบฝึกหัดแต่ละชุดมีเฉลยคำตอบโดยละเอียดที่ช่วยแนะนำนักเรียนทีละขั้นตอนในการวิเคราะห์ความสัมพันธ์ของข้อมูล และยังมีไฟล์ PDF ที่พิมพ์ได้ฟรี ช่วยให้เข้าถึงได้ง่ายสำหรับการใช้งานในห้องเรียนและการเรียนรู้ด้วยตนเอง

Wayground (เดิมคือ Quizizz) สนับสนุนครูผู้สอนคณิตศาสตร์ด้วยชุดแบบฝึกหัดการหาเส้นแนวโน้มที่ดีที่สุดที่สร้างโดยครูผู้สอนนับล้านชุด ซึ่งช่วยให้การวางแผนบทเรียนและการพัฒนาทักษะเป็นไปอย่างราบรื่น แพลตฟอร์มนี้มีฟังก์ชันการค้นหาและการกรองขั้นสูง ช่วยให้ครูสามารถค้นหาแบบฝึกหัดที่สอดคล้องกับมาตรฐานหลักสูตรเฉพาะ ในขณะที่เครื่องมือการปรับให้เหมาะสมกับระดับความสามารถของนักเรียนแต่ละคน ช่วยให้สามารถปรับแต่งได้ตามความต้องการและระดับความเชี่ยวชาญของนักเรียน ครูสามารถเข้าถึงสื่อการเรียนการสอนได้ทั้งในรูปแบบไฟล์ PDF ที่พิมพ์ได้และไฟล์ดิจิทัล ทำให้ง่ายต่อการแก้ไขปัญหาเฉพาะหน้าสำหรับนักเรียนที่ประสบปัญหาเกี่ยวกับแนวคิดเรื่องความสัมพันธ์ หรือจัดกิจกรรมเสริมสำหรับผู้เรียนระดับสูงที่พร้อมจะสำรวจการวิเคราะห์การถดถอยหลายตัวแปร ทรัพยากรที่ยืดหยุ่นเหล่านี้สนับสนุนวิธีการสอนที่หลากหลาย ตั้งแต่การฝึกฝนแบบมีผู้แนะนำไปจนถึงแบบฝึกหัดสร้างทักษะด้วยตนเอง ทำให้มั่นใจได้ว่านักเรียนจะพัฒนาความเข้าใจพื้นฐานที่แข็งแกร่งเกี่ยวกับการวิเคราะห์ความสัมพันธ์ทางสถิติ