Search Header Logo
  1. Resource Library
  2. Science
  3. Chemistry
  4. Heating Curve
  5. Heating Curves
Heating Curves

Heating Curves

Assessment

Presentation

Science

9th - 12th Grade

Medium

NGSS
MS-PS1-4, MS-PS3-4

Standards-aligned

Created by

Stacy Kowlsen

Used 19+ times

FREE Resource

11 Slides • 9 Questions

1

media

Copyright © 2011 MsRazz ChemClass

Bell Ringer

Complete the handout
while watching the video.
Use the word bank to help
with labeling the heating
curve

Word Bank:
Solid, Liquid,
Gas, Freezing,
Melting,
Vaporization,
and
condensation.

2

media

Copyright © 2011 MsRazz ChemClass

Video

https://www.bing.com/videos/search?q=tyler+de

witt+phase+changes&&view=detail&mid=C6B29
A29C817C2B5C584C6B29A29C817C2B5C584&&F
ORM=VRDGAR&ru=%2Fvideos%2Fsearch%3Fq%3D
tyler%2520dewitt%2520phase%2520changes%26q
s%3DMM%26form%3DQBVR%26sp%3D1%26pq%3D
tyler%2520dewitt%2520phases%26sc%3D1-
19%26cvid%3DAD19A0212B3F4AB4AA40C6EB2446
4693

3

media

Copyright © 2011 MsRazz ChemClass

Essential
Question

Using your picture of the heating curve,

answer what happens to the
temperature of the material when it is
undergoing a phase change?

4

media

Copyright © 2011 MsRazz ChemClass

Standard
SC.912.P.10.7

DISTINGUISH BETWEEN ENDOTHERMIC AND EXOTHERMIC
CHEMICAL PROCESSES.

5

media

Copyright © 2011 MsRazz ChemClass

After today, you should be able to…

Explain what thermochemistry is

List different types of energy

Explain what happens to particle

motion when heat energy is added

Convert between units of calories

(cal), Joules (J) , and kilo-Joules (kJ)

6

media

Copyright © 2011 MsRazz ChemClass

After today you should be able to…

Explain what occurs on each

point of a heating curve

Explain the phase changes as

endothermic or exothermic

7

Copyright © 2011 MsRazz ChemClass

Heating
Curves

When a solid substance is
heated (A), its temperature
will increase until it reaches
its melting point (m.p.).

Temperature will then stay

constant during the melting
process. (C = liquid) (phase
change=constant
temperature)

8

media

Copyright © 2011 MsRazz ChemClass

Heating Curves

A heating curve is a graph of
temperature versus time.
It describes the enthalpy
changes that take place
during phase changes.

9

media

Copyright © 2011 MsRazz ChemClass

10

media

Copyright © 2011 MsRazz ChemClass

Endothermic and
Exothermic & Phase
Changes

Sublimation, when a solid
transforms into a gas, is
an endothermic phrase change,

Deposition, when a gas transforms
to a solid, is an exothermic phase
change.

There are a total of
six phase changes in matter, and
three are endothermic and three
are exothermic

11

media

Copyright © 2011 MsRazz ChemClass

Heating
Curves

When a substance is
completely melted, its
temperature will again
increase until it has
reached its boiling point
(b.p.).

Temperature stays

constant during boiling.

Once completely

vaporized, the
temperature will again
increase. (E=gas)

12

Multiple Choice

Question image

Which letter indicates where water is in both the solid and liquid phase at the same time?

1

A

2

B

3

C

4

D

5

E

13

Multiple Choice

Question image

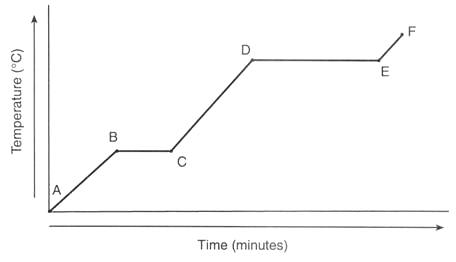
Between which points is the temperature of the substance remaining constant?

1

A-B only

2

A-B, C-D, and E-F

3

B-C only

4

B-C and D-E

14

Multiple Choice

A measure of the average kinetic energy of the particles in an object is called

1

Heat

2

Temperature

3

Kinetic energy

4

Enthalpy

15

Multiple Choice

Question image

In which region(s) does temperature increase?

1

Region C only

2

Regions B and D

3

Regions A, C, and E

4

Regions A and B

16

Multiple Choice

The energy transferred between objects that are at different temperatures is called

1

Heat

2

Temperature

3

Energy

4

Friction

17

Multiple Choice

Question image

Describe the substance at letter A.

1

Solid

2

Liquid

3

Melting

4

Evaporating

18

Multiple Choice

Question image

At which letter is the substance changing its state of matter?

1

A only

2

A, C, and E

3

D and E

4

B and D

19

Multiple Choice

Question image

The melting point of the sample is

1

-60 ºC

2

20 ºC

3

60 ºC

4

100 ºC

20

Multiple Choice

__________ show the change in state of matter as heat is added.

1

Phase diagrams

2

Heating curves

3

Density graphs

4

Temperature plots

media

Copyright © 2011 MsRazz ChemClass

Bell Ringer

Complete the handout
while watching the video.
Use the word bank to help
with labeling the heating
curve

Word Bank:
Solid, Liquid,
Gas, Freezing,
Melting,
Vaporization,
and
condensation.

Show answer

Auto Play

Slide 1 / 20

SLIDE