
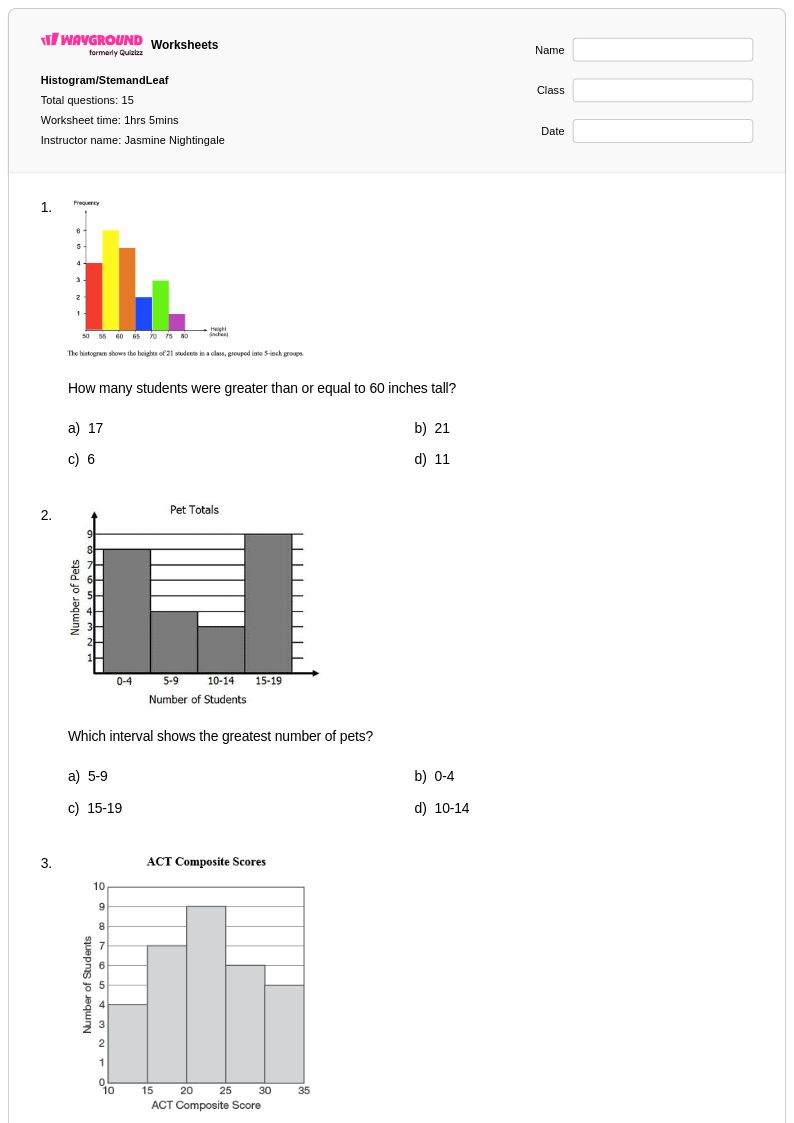
15Q
6th - 8th
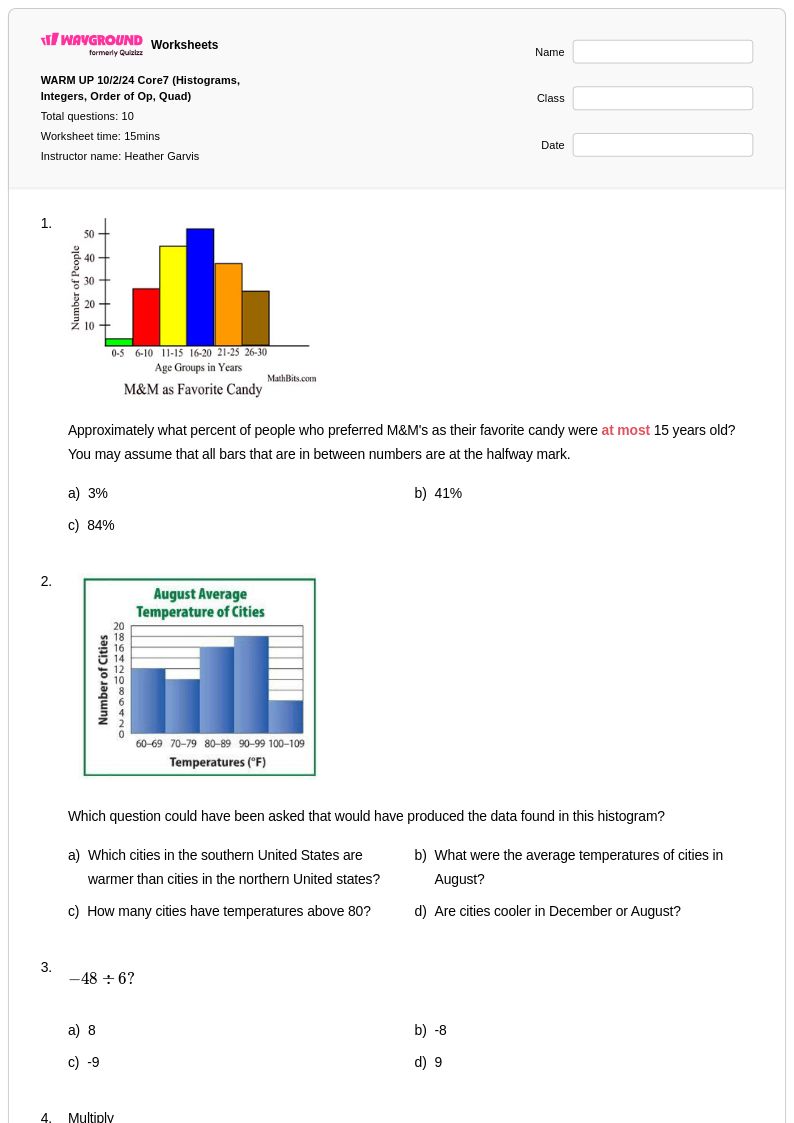
10Q
6th - 8th
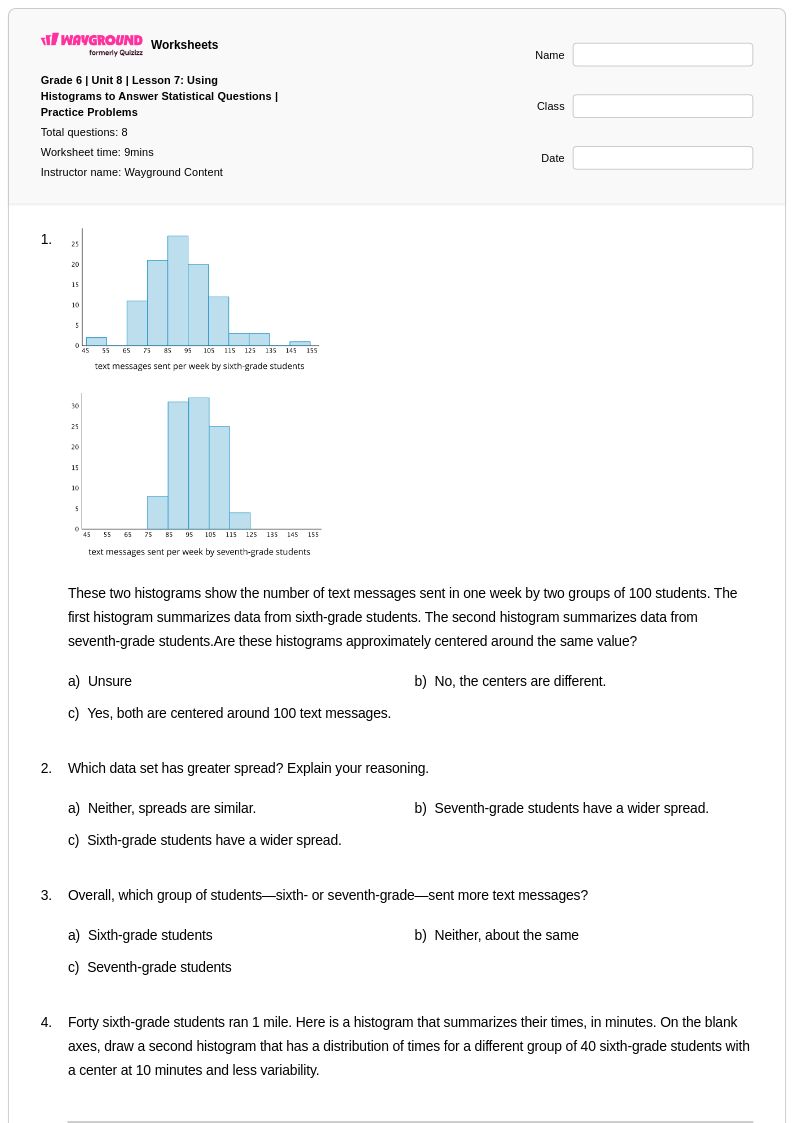
8Q
6th - Uni
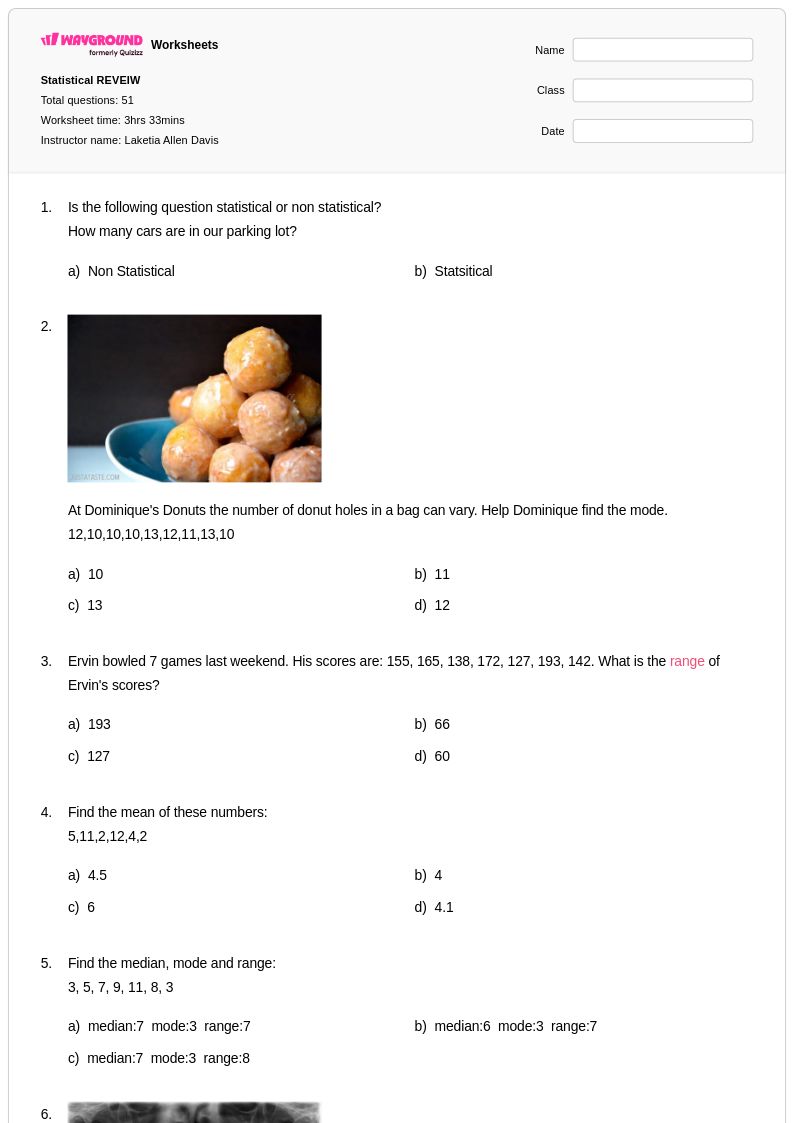
51Q
6th - 8th
20Q
8th
30Q
8th - 10th
15Q
7th - 8th
10Q
6th - 8th
13Q
8th - 12th
12Q
6th - 8th
19Q
6th - Uni
15Q
6th - 8th
15Q
7th - Uni
15Q
8th - Uni
20Q
8th
20Q
8th
13Q
6th - Uni
10Q
6th - 8th
35Q
8th
46Q
8th
13Q
7th - 8th
27Q
8th
10Q
6th - 8th
20Q
8th - Uni
Explore outras planilhas de assuntos para year 8
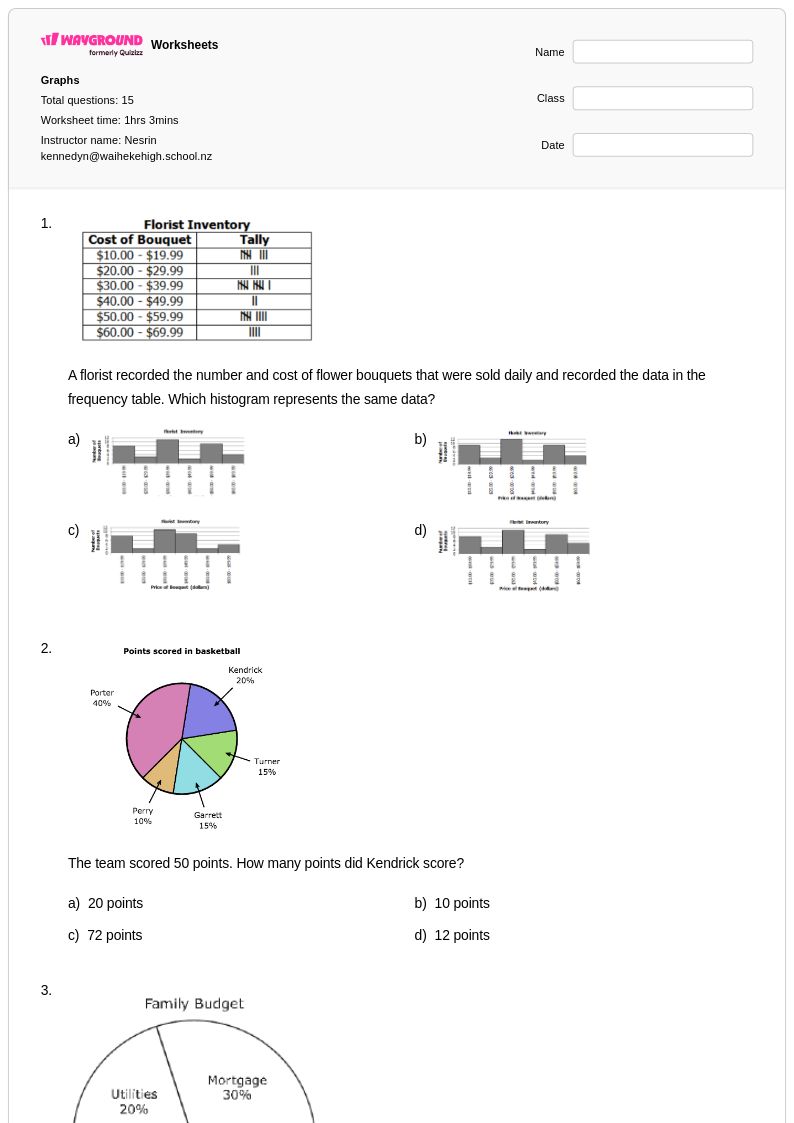
Explore printable Histogram Interpretation worksheets for Year 8
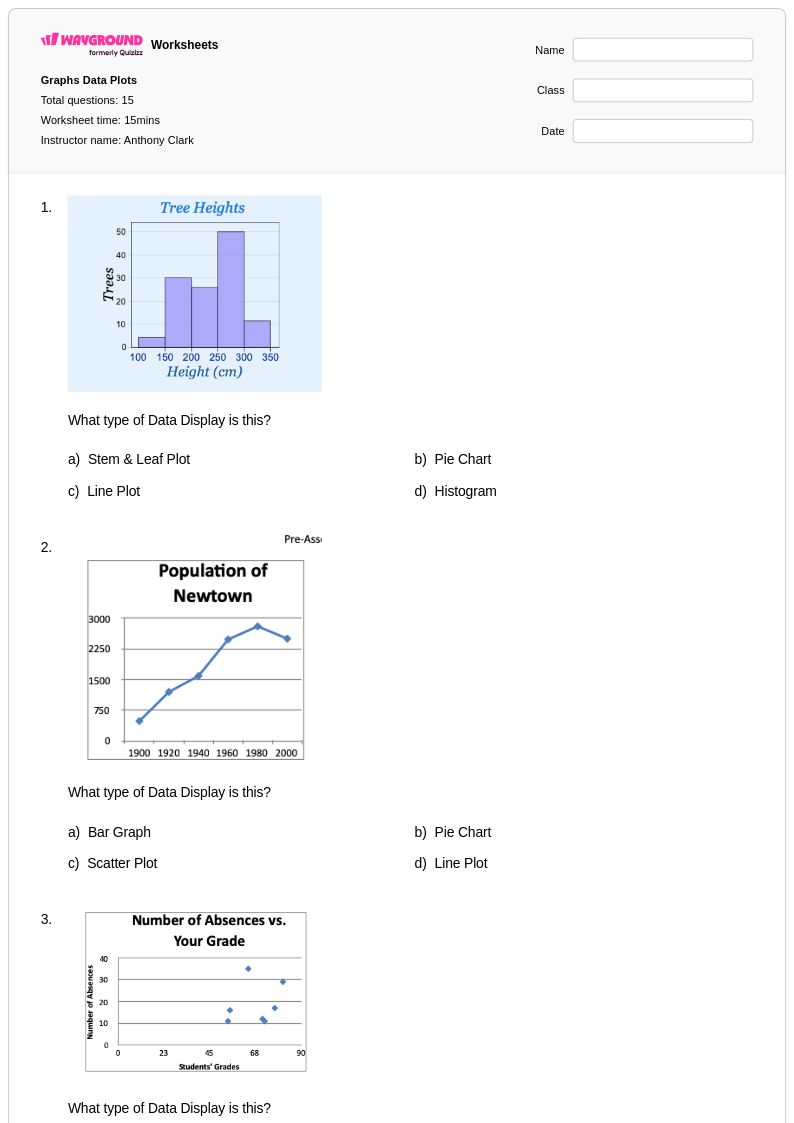
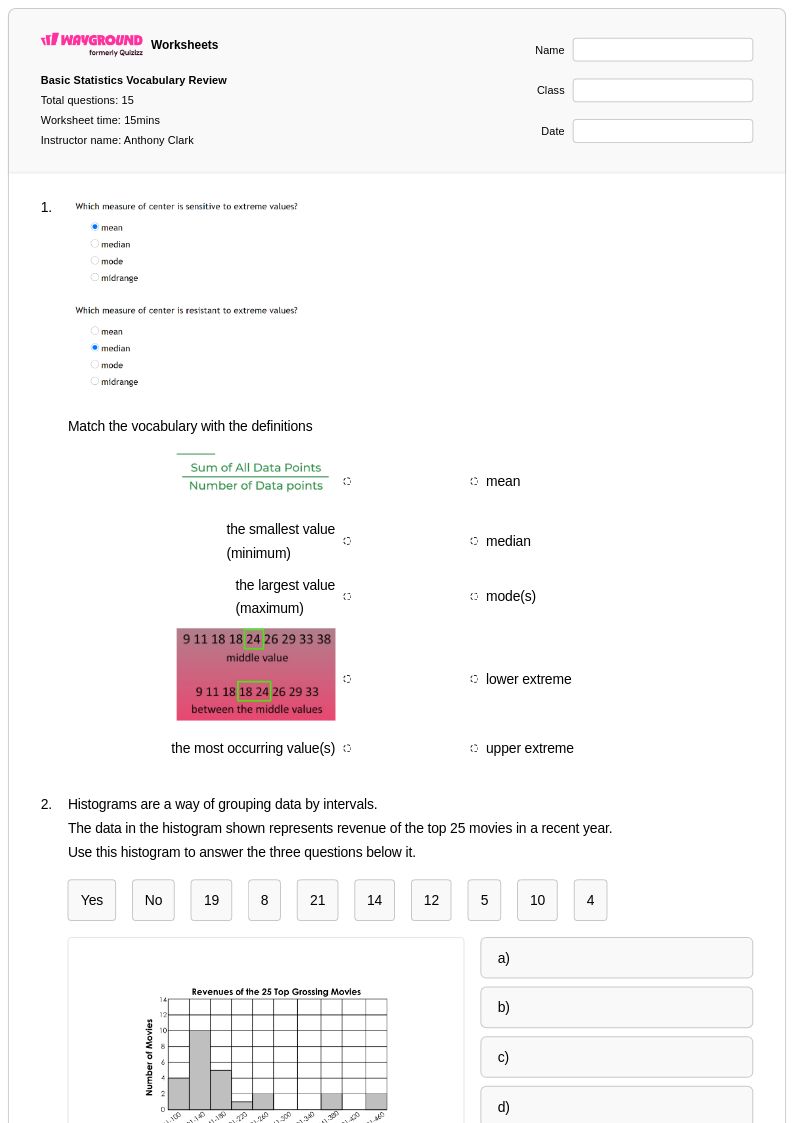
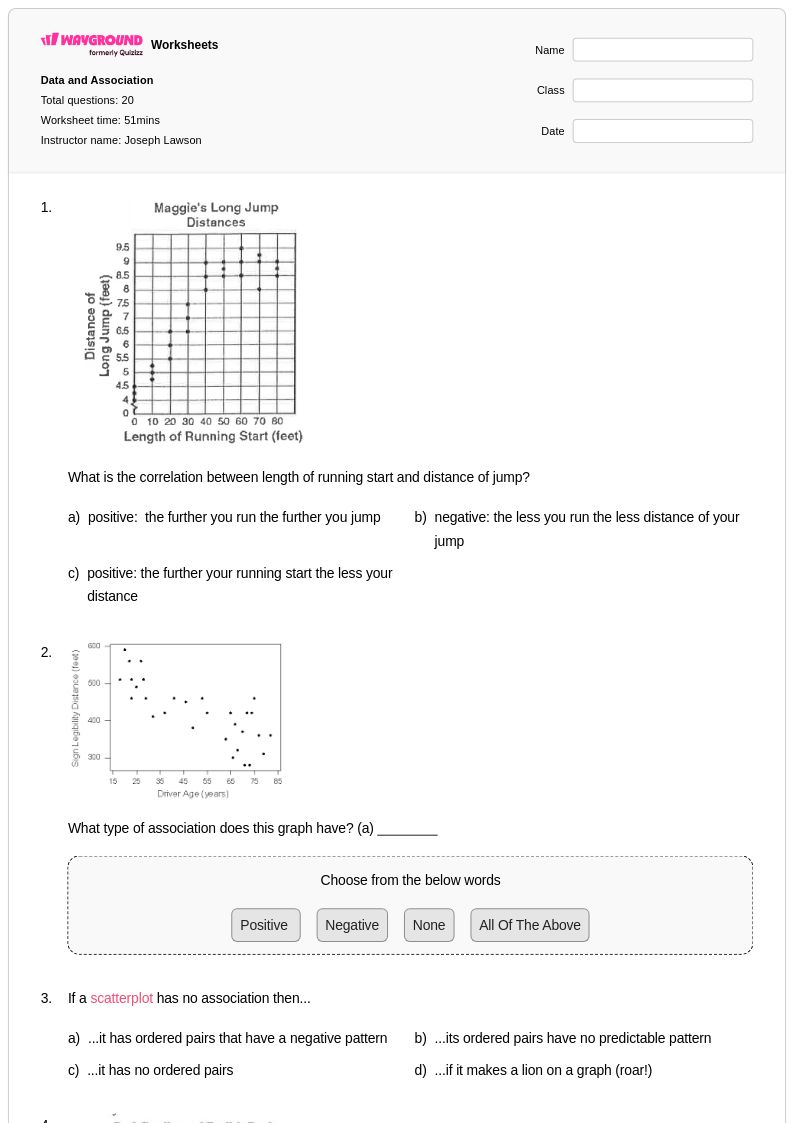
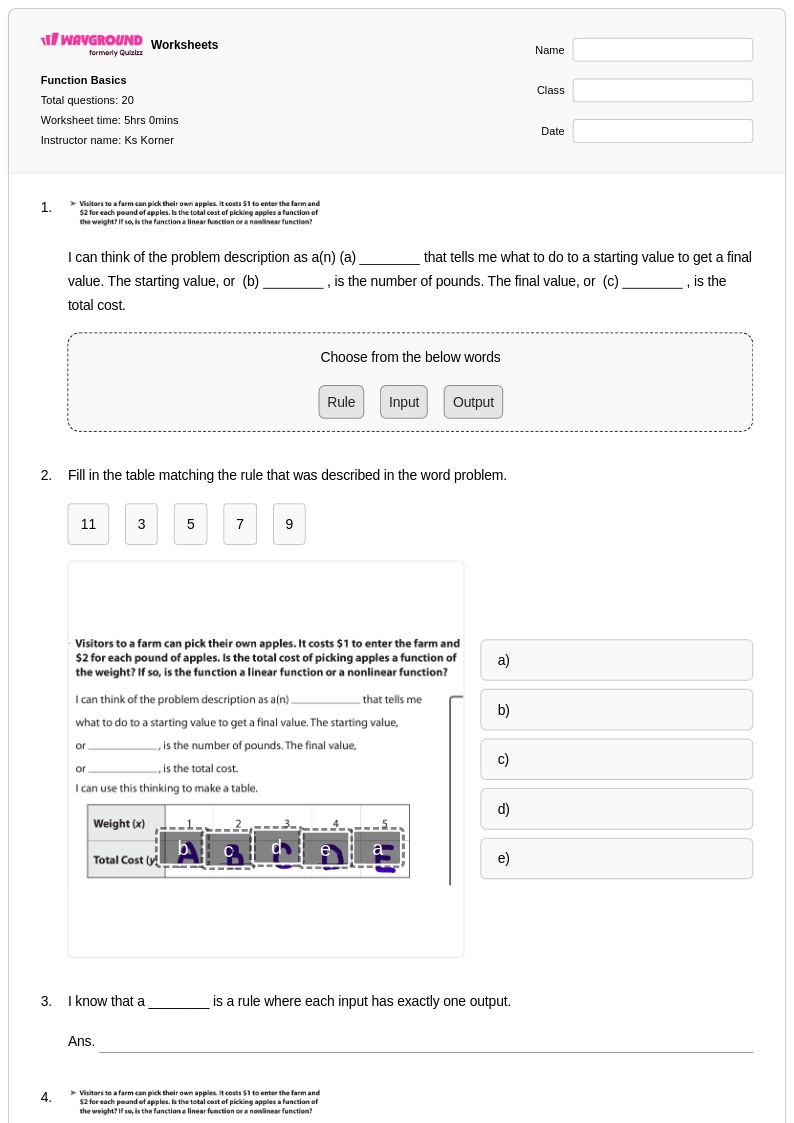
Histogram interpretation worksheets for Year 8 students provide essential practice in analyzing and understanding data visualization through bar-style graphs that display frequency distributions. These comprehensive worksheets available through Wayground (formerly Quizizz) help students develop critical skills in reading histogram axes, identifying intervals, calculating frequencies, and drawing meaningful conclusions from grouped data sets. Students work through practice problems that challenge them to interpret real-world scenarios presented in histogram format, from analyzing test score distributions to examining population demographics. Each worksheet collection includes detailed answer keys and comes in convenient pdf format as free printables, allowing educators to seamlessly integrate histogram analysis into their mathematics curriculum while building students' data literacy foundations.
Wayground (formerly Quizizz) empowers teachers with millions of educator-created histogram interpretation resources specifically designed for Year 8 mathematics instruction. The platform's robust search and filtering capabilities enable teachers to quickly locate worksheets aligned with specific learning standards and differentiate instruction based on individual student needs. Teachers can customize existing materials or create new practice sets, with flexible options for both printable pdf worksheets and interactive digital formats that accommodate diverse classroom environments. These comprehensive tools support systematic lesson planning while providing targeted resources for remediation and enrichment, ensuring students receive appropriate histogram interpretation practice whether they need foundational skill building or advanced analytical challenges in data visualization.