Explore Year 7 phase change worksheets and printables from Wayground that help students master state transitions through engaging practice problems, free PDFs, and comprehensive answer keys.
Explore printable Phase Change worksheets for Year 7
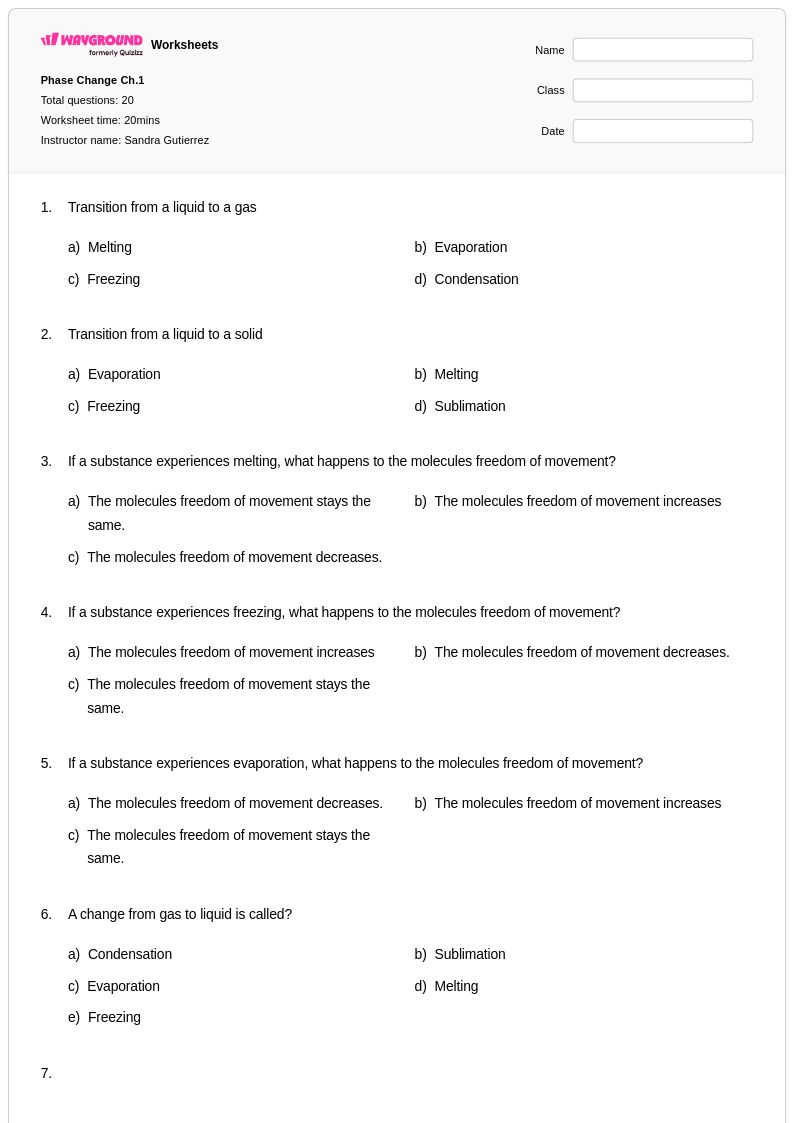
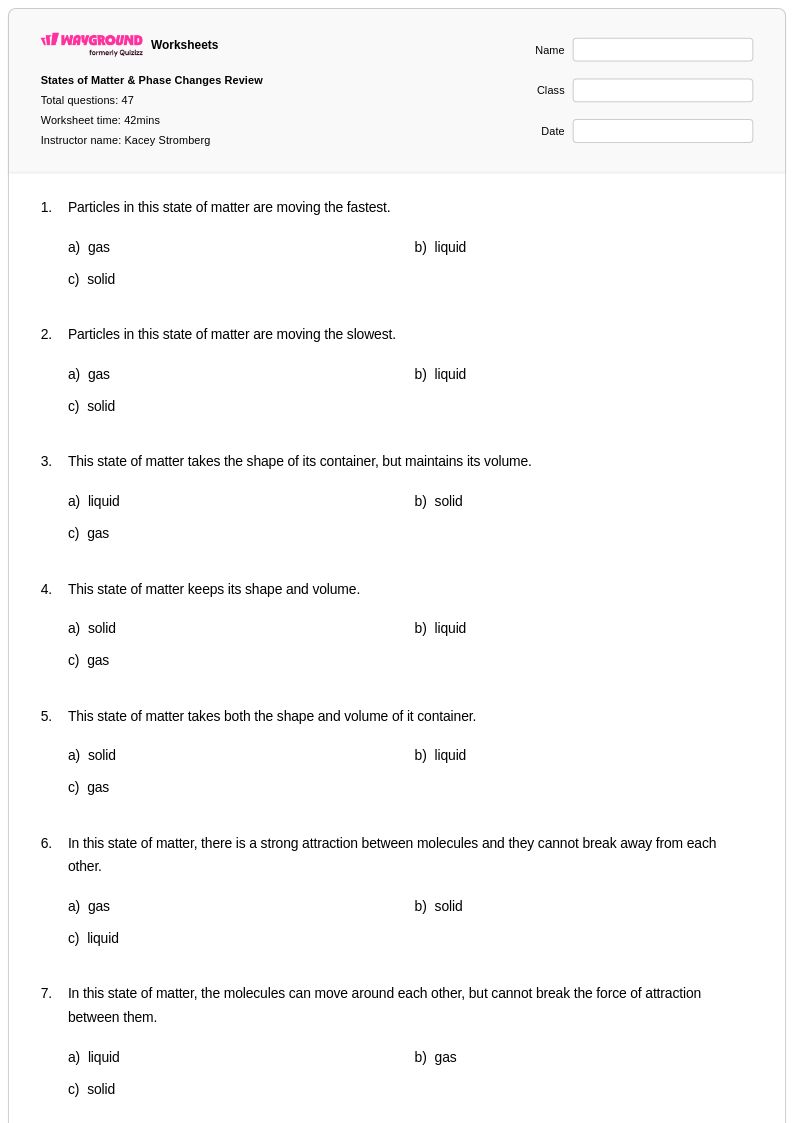
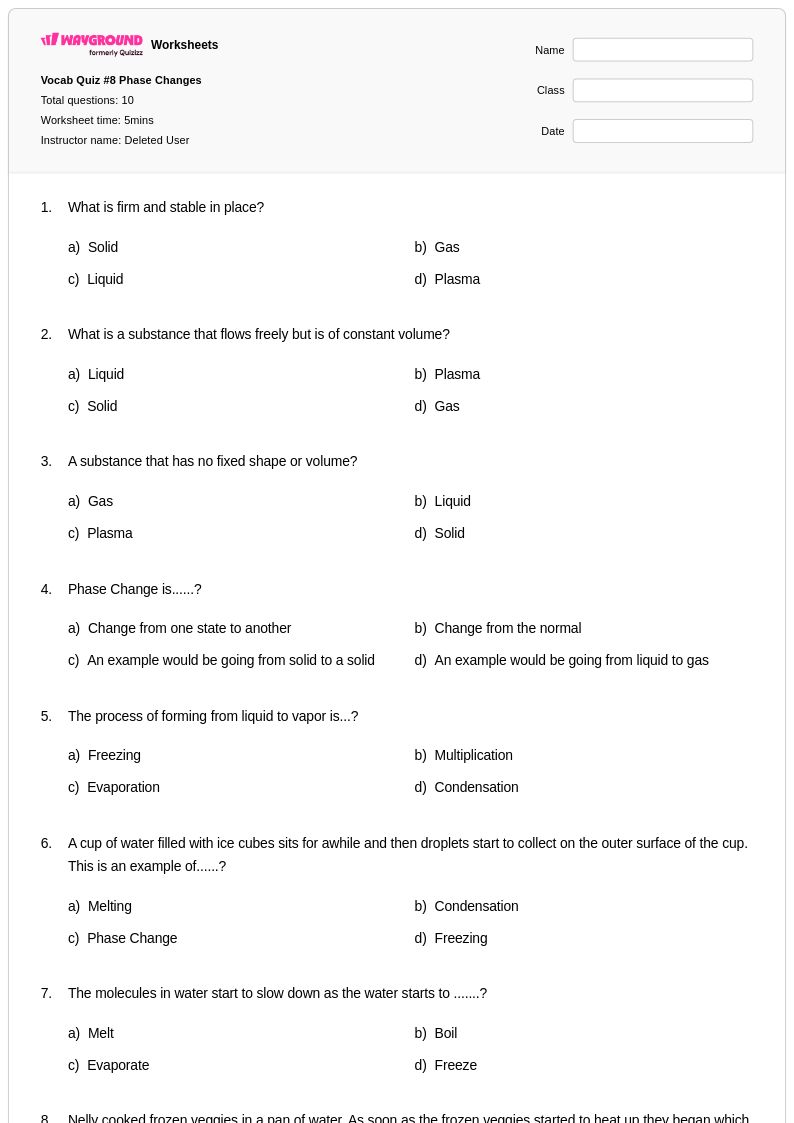
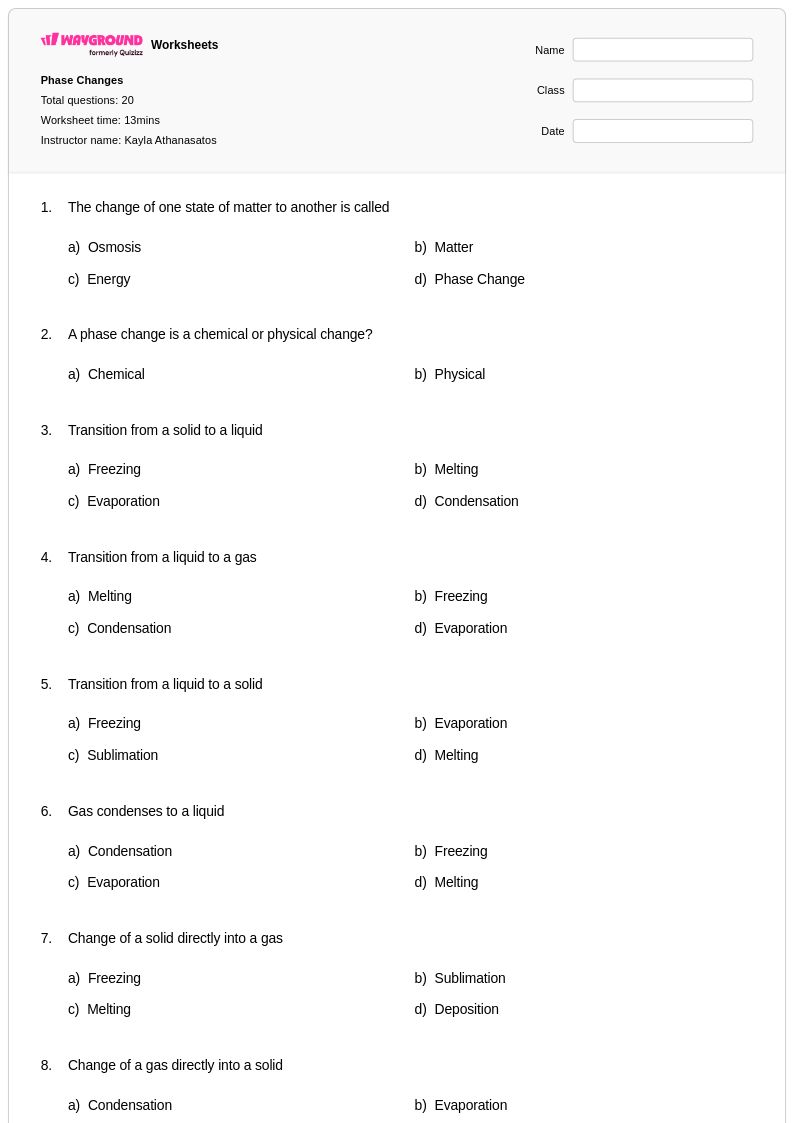
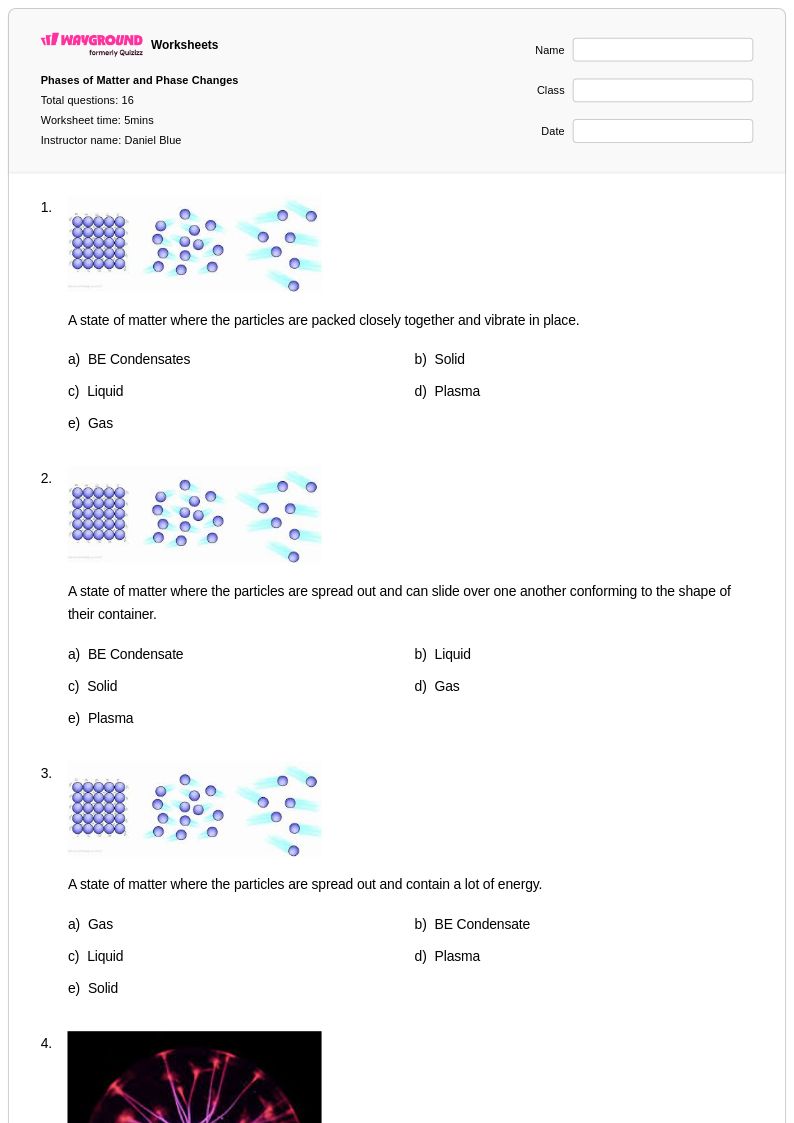
Year 7 phase change worksheets available through Wayground (formerly Quizizz) provide comprehensive coverage of how matter transitions between solid, liquid, and gas states, focusing on the molecular behavior and energy changes that occur during these transformations. These expertly designed worksheets strengthen students' understanding of melting, freezing, vaporization, condensation, sublimation, and deposition while developing critical thinking skills around temperature, pressure, and particle movement. Each worksheet includes detailed answer keys and is available as free printables in convenient pdf format, featuring practice problems that range from identifying phase transitions in everyday scenarios to analyzing heating and cooling curves that demonstrate energy absorption and release during state changes.
Wayground (formerly Quizizz) empowers teachers with access to millions of teacher-created resources specifically designed for phase change instruction, featuring robust search and filtering capabilities that allow educators to quickly locate materials aligned with their curriculum standards and student needs. The platform's differentiation tools enable seamless customization of worksheets to accommodate varying skill levels within Year 7 classrooms, while flexible formatting options provide both printable pdf versions for traditional assignments and digital formats for interactive learning experiences. These comprehensive features support effective lesson planning by offering immediate access to remediation materials for struggling students, enrichment activities for advanced learners, and targeted skill practice opportunities that reinforce understanding of molecular behavior during phase transitions through varied problem-solving approaches and real-world applications.
FAQs
How do I teach phase changes to students?
Start by grounding students in the particle model of matter — phase changes are driven by changes in molecular kinetic energy, not changes in the molecules themselves. Introduce each transition (melting, freezing, vaporization, condensation, sublimation, and deposition) with real-world examples before moving to heating and cooling curves, which visually reinforce why temperature plateaus during a phase change. Connecting intermolecular forces to the energy required for each transition helps students understand why different substances change phase at different temperatures.
What exercises help students practice phase changes?
Heating and cooling curve analysis is one of the most effective practice formats — students interpret graphs to identify phase transitions, calculate energy absorbed or released, and apply the concepts of latent heat of fusion and vaporization. Labeling diagrams of the six phase transitions and completing temperature-energy relationship problems also reinforce the vocabulary and conceptual framework students need. Practice problems that ask students to compare substances based on their intermolecular forces extend understanding toward real-world applications.
What mistakes do students commonly make with phase changes?
The most persistent misconception is that temperature always rises when heat is added — students often don't understand why temperature stays constant during a phase change while energy input continues. Many students also confuse the direction of transitions, reversing condensation and vaporization or misidentifying sublimation. A related error is conflating physical state changes with chemical changes, which requires explicit reinforcement that phase changes are purely physical processes.
How do I explain latent heat to students who are struggling?
Latent heat is best explained by focusing on what the energy is actually doing: during a phase change, added energy breaks intermolecular forces rather than increasing particle speed, which is why temperature holds steady. Analogies like melting ice in a drink — the drink stays at 0°C until all the ice melts — make this tangible. Heating curve graphs are particularly effective here because they make the energy-temperature relationship visible and allow students to see the plateau periods directly.
How can I use phase change worksheets to assess student understanding?
Phase change worksheets work well as formative assessment tools after initial instruction on heating curves and molecular behavior. Look for whether students can correctly identify transition points on a graph, calculate energy using Q = mL formulas, and explain the role of intermolecular forces — these tasks reveal the depth of conceptual understanding rather than just recall. Common errors on these assessments, such as misreading plateau regions or confusing endothermic and exothermic transitions, can guide targeted re-teaching.
How do I use Wayground's phase change worksheets in my classroom?
Wayground's phase change worksheets are available as printable PDFs for traditional classroom use and in digital formats for technology-integrated or remote learning environments, giving teachers flexibility in how they deploy the materials. You can also host any worksheet as a quiz directly on Wayground, making it easy to assign for individual practice, homework, or assessment prep. Each worksheet includes a complete answer key, which reduces grading time and supports self-paced student review.