
10 Q
7th - 9th
10 Q
7th
20 Q
6th - 8th
15 Q
7th
22 Q
7th
14 Q
7th
14 Q
7th
16 Q
5th - Uni
20 Q
7th - Uni
10 Q
6th - 8th
10 Q
7th
10 Q
6th - 8th
15 Q
6th - 8th
20 Q
7th - Uni
10 Q
7th
21 Q
7th
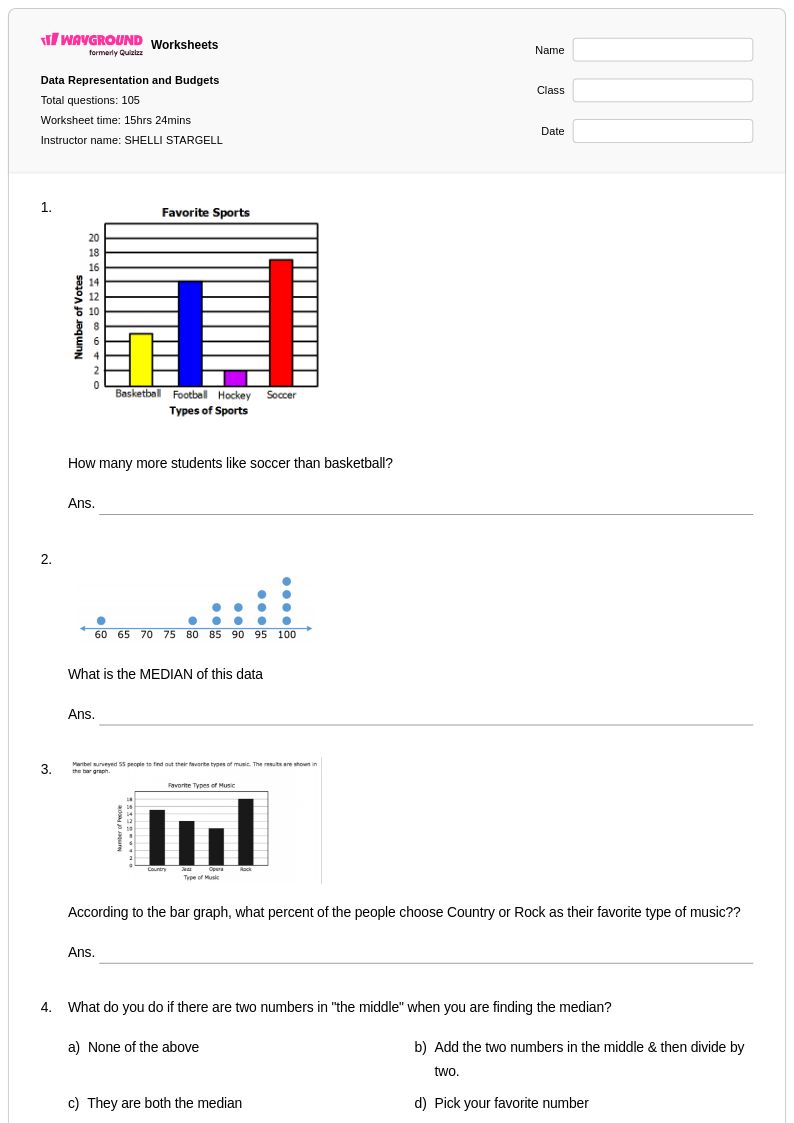
105 Q
7th
20 Q
7th - 9th
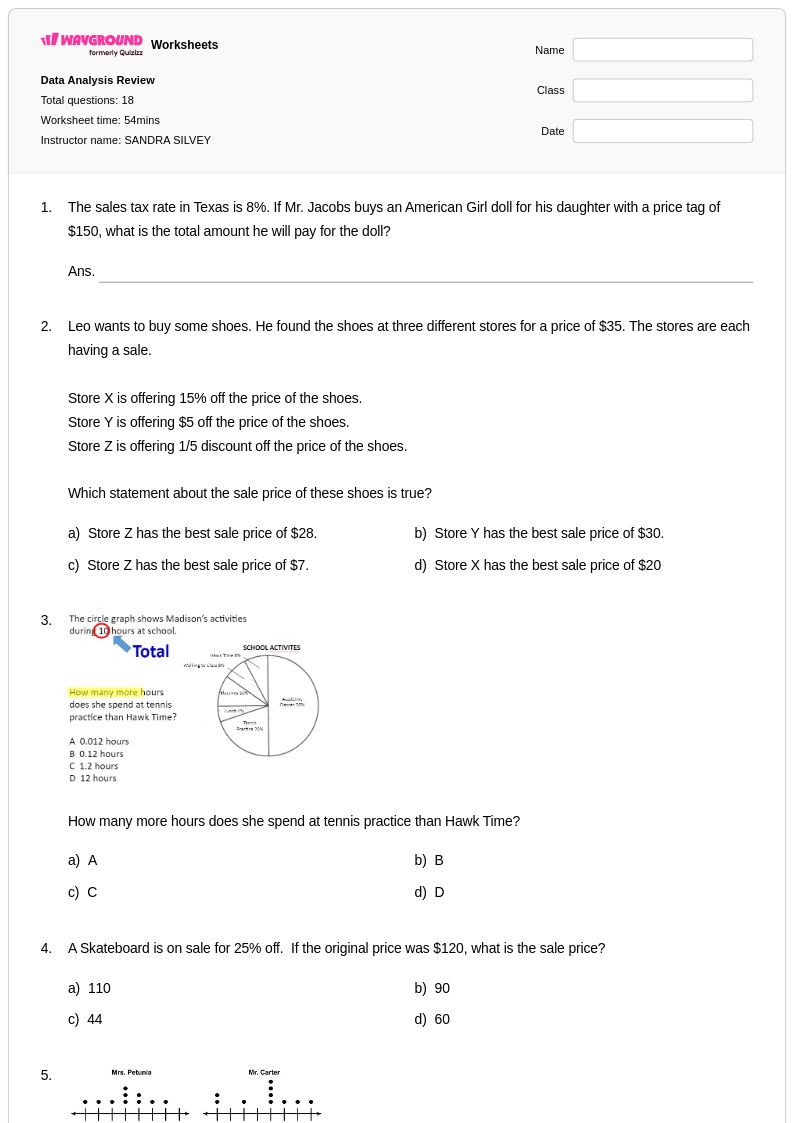
18 Q
7th
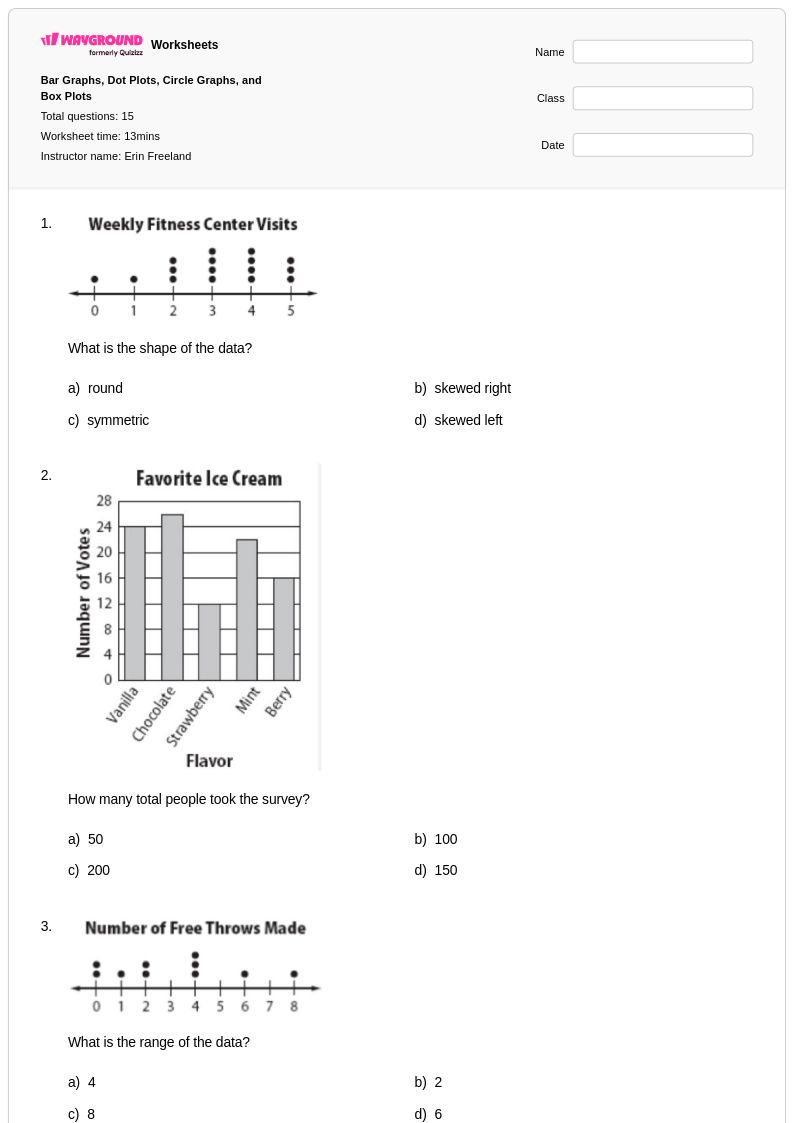
15 Q
6th - 8th
20 Q
6th - 8th
10 Q
7th
![Interpreting Visuals [7.SP.4] - Printable Data-visualization Worksheets Class 7 - Quizizz](https://quizizz-static.s3.amazonaws.com/_media/worksheets-new/632321f8bc6a79001d175365-interpreting-visuals-7sp4)
15 Q
7th
10 Q
7th
Explore Data Visualization Worksheets by Grades
Explore Other Subject Worksheets for class 7
Explore printable Data Visualization worksheets for Class 7
Data visualization worksheets for Class 7 students available through Wayground (formerly Quizizz) provide comprehensive practice in interpreting, creating, and analyzing various types of graphs and charts essential for mathematical literacy. These carefully crafted resources strengthen students' ability to work with bar graphs, line plots, histograms, box plots, scatter plots, and circle graphs while developing critical thinking skills needed to extract meaningful information from visual data representations. Each worksheet collection includes detailed answer keys and is available as free printable pdf resources, offering practice problems that progress from basic graph reading to more complex data interpretation tasks that align with seventh-grade mathematical standards.
Wayground (formerly Quizizz) empowers educators with access to millions of teacher-created data visualization resources specifically designed for middle school mathematics instruction. The platform's robust search and filtering capabilities allow teachers to quickly locate worksheets that match specific learning objectives, standards alignment requirements, and student ability levels. These differentiation tools enable seamless customization of content for remediation support, enrichment activities, and targeted skill practice, while the flexible format options including both printable and digital pdf versions streamline lesson planning and classroom implementation. Teachers can efficiently organize comprehensive data visualization units that build students' statistical reasoning abilities through systematic practice with authentic data sets and real-world graphing scenarios.