
15 Q
5th
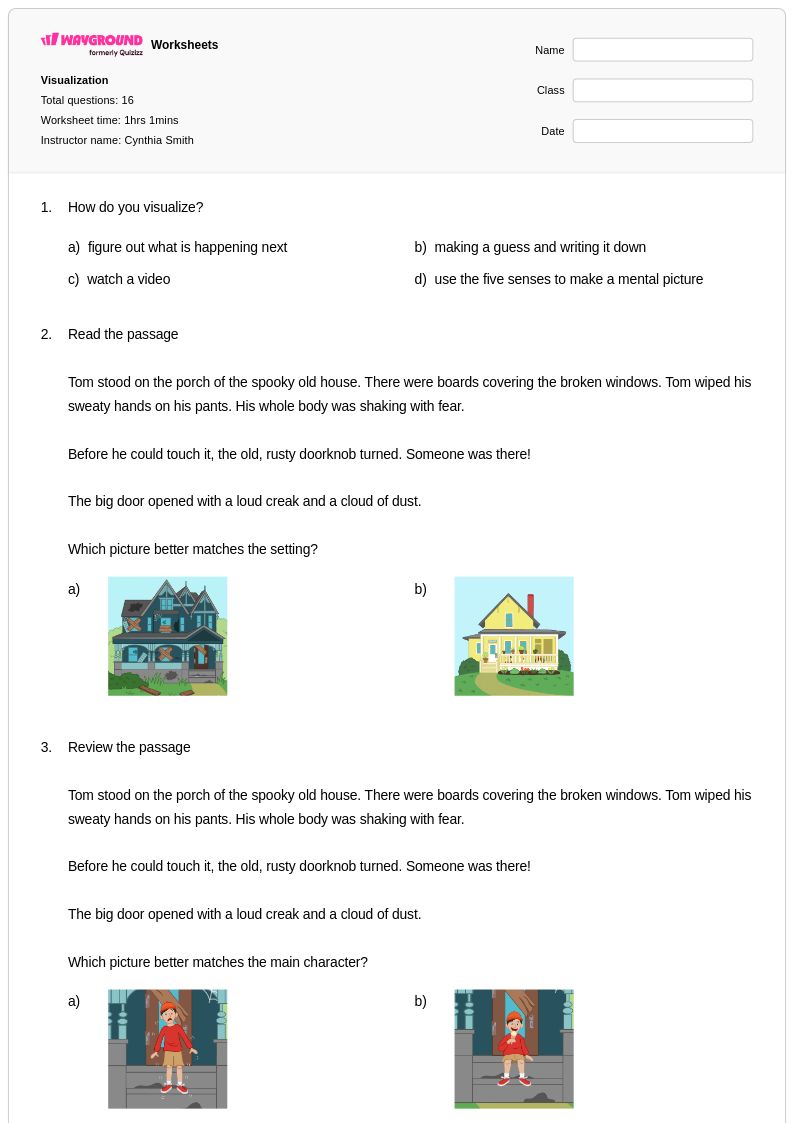
17 Q
1st - 5th
10 Q
1st - 6th
10 Q
4th - 5th
16 Q
5th
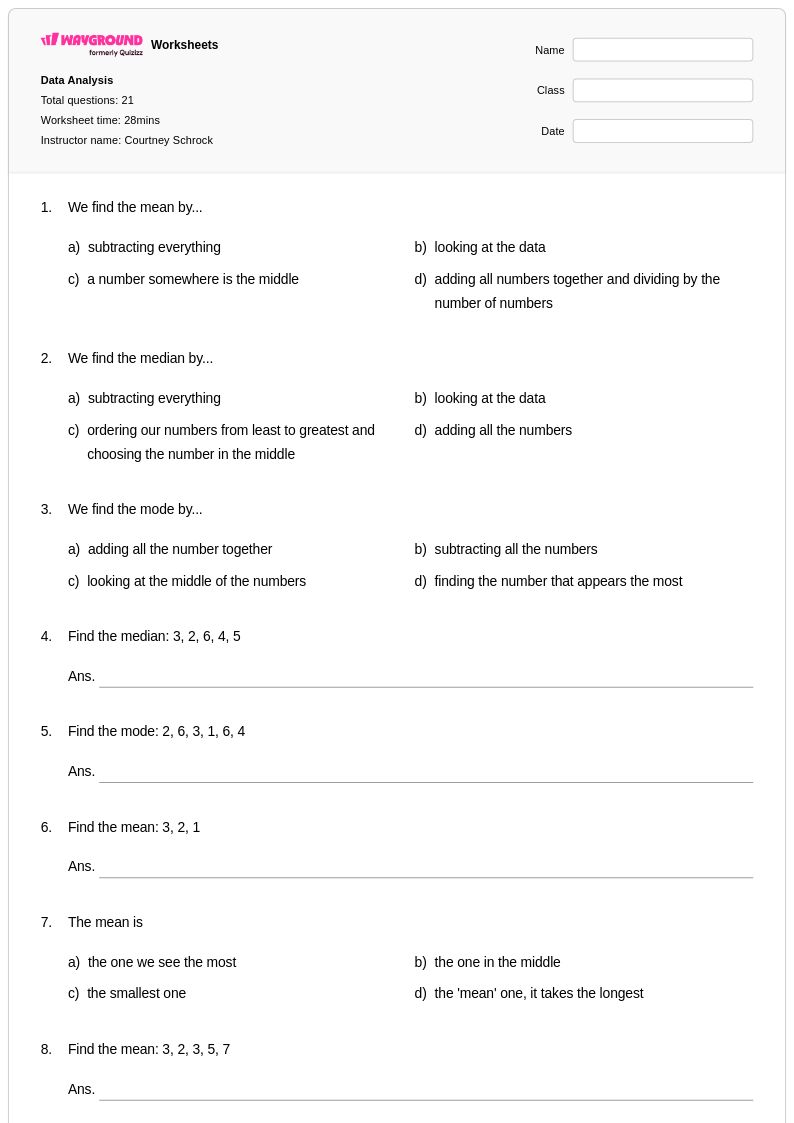
21 Q
5th
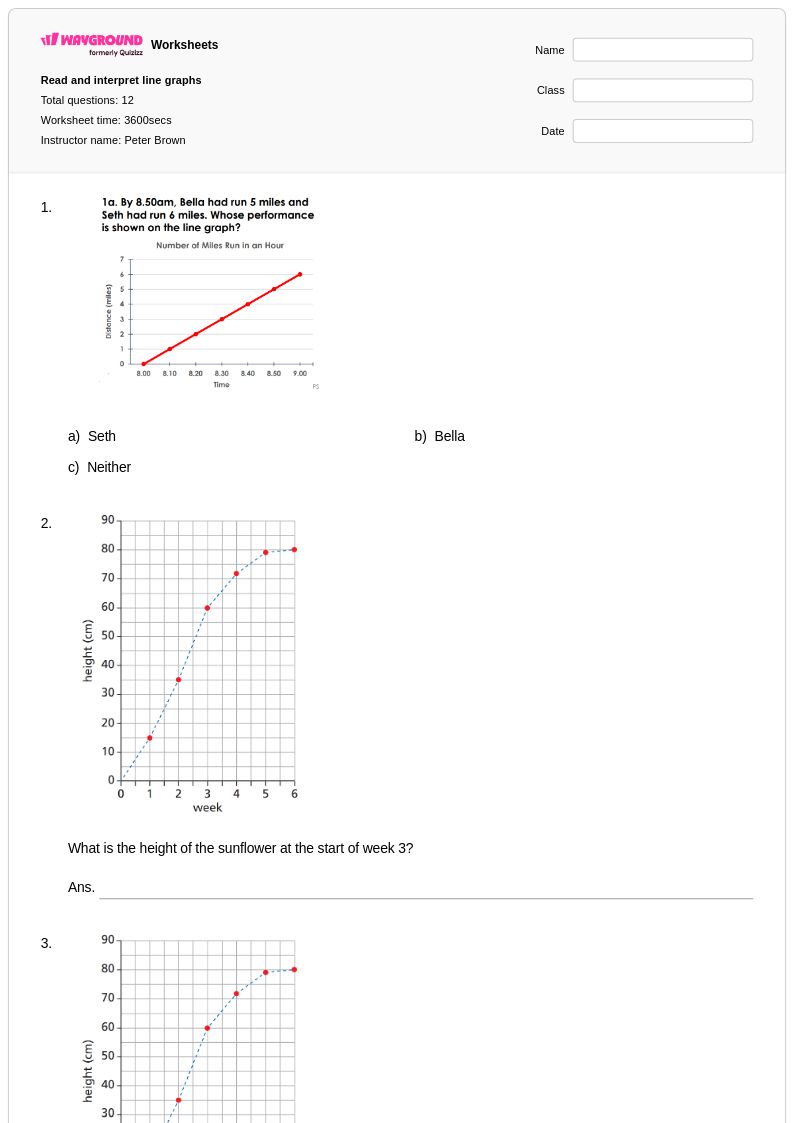
12 Q
5th
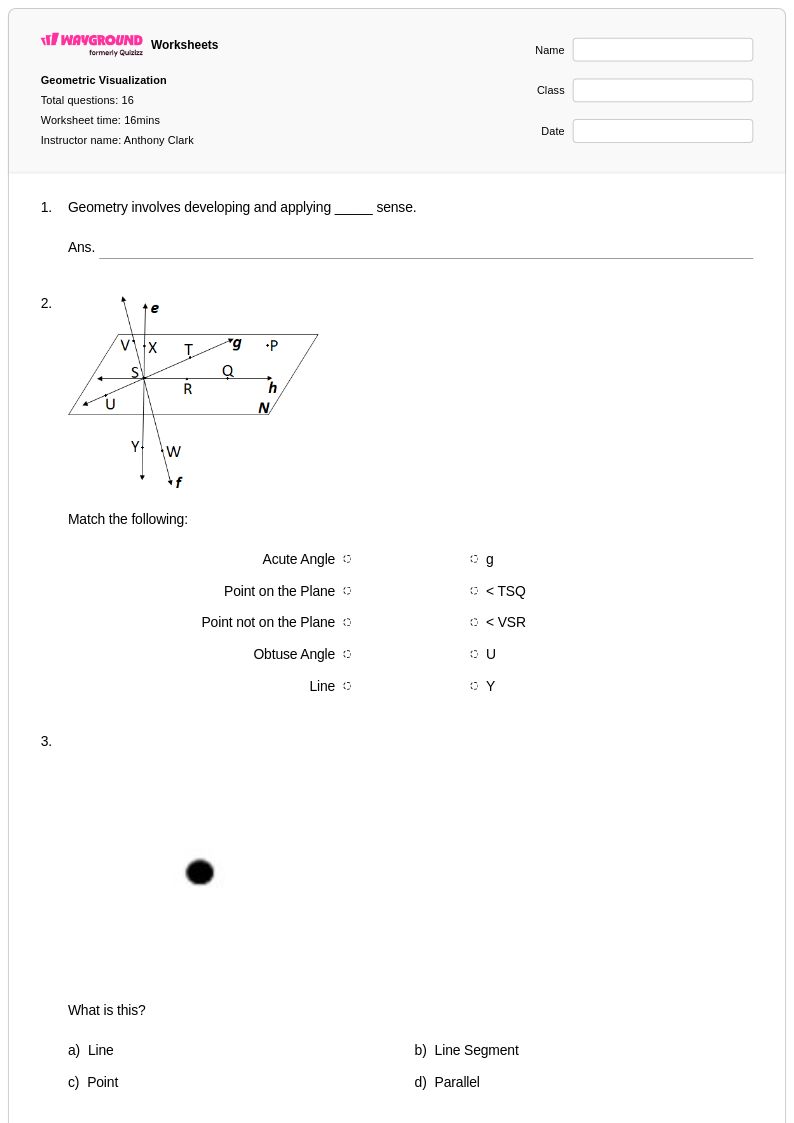
16 Q
5th - Uni
15 Q
5th - Uni
10 Q
5th
10 Q
5th
16 Q
3rd - 5th
18 Q
5th
20 Q
5th
20 Q
5th
100 Q
5th
16 Q
5th
12 Q
5th
15 Q
5th
7 Q
4th - 6th
15 Q
5th
20 Q
5th - Uni
37 Q
5th
10 Q
5th
Explore Data Visualization Worksheets by Grades
Explore Other Subject Worksheets for class 5
Explore printable Data Visualization worksheets for Class 5
Data visualization worksheets for Class 5 students available through Wayground (formerly Quizizz) provide essential practice in interpreting and creating visual representations of data, building foundational skills that bridge concrete mathematical thinking with abstract statistical concepts. These comprehensive worksheets guide fifth-grade learners through reading and analyzing bar graphs, line plots, pictographs, and simple line graphs while developing their ability to extract meaningful information from visual data displays. Students work through carefully scaffolded practice problems that strengthen their understanding of data collection, organization, and presentation methods, with each printable worksheet including detailed answer keys that support both independent learning and teacher-guided instruction. The free pdf resources emphasize hands-on experiences where students create their own graphs from given datasets, interpret trends and patterns, and draw conclusions based on visual evidence.
Wayground (formerly Quizizz) empowers educators with millions of teacher-created data visualization resources specifically designed for Class 5 mathematics instruction, featuring robust search and filtering capabilities that allow teachers to locate worksheets aligned with specific learning standards and student needs. The platform's differentiation tools enable teachers to customize worksheet difficulty levels and modify practice problems to support both remediation for struggling learners and enrichment opportunities for advanced students. These flexible resources are available in both printable pdf format for traditional classroom use and digital formats for technology-integrated instruction, streamlining lesson planning while providing diverse options for skill practice. Teachers can efficiently organize their data visualization curriculum using the platform's comprehensive collection, which supports systematic progression through increasingly complex graphing concepts while maintaining alignment with Class 5 mathematical standards and expectations.