
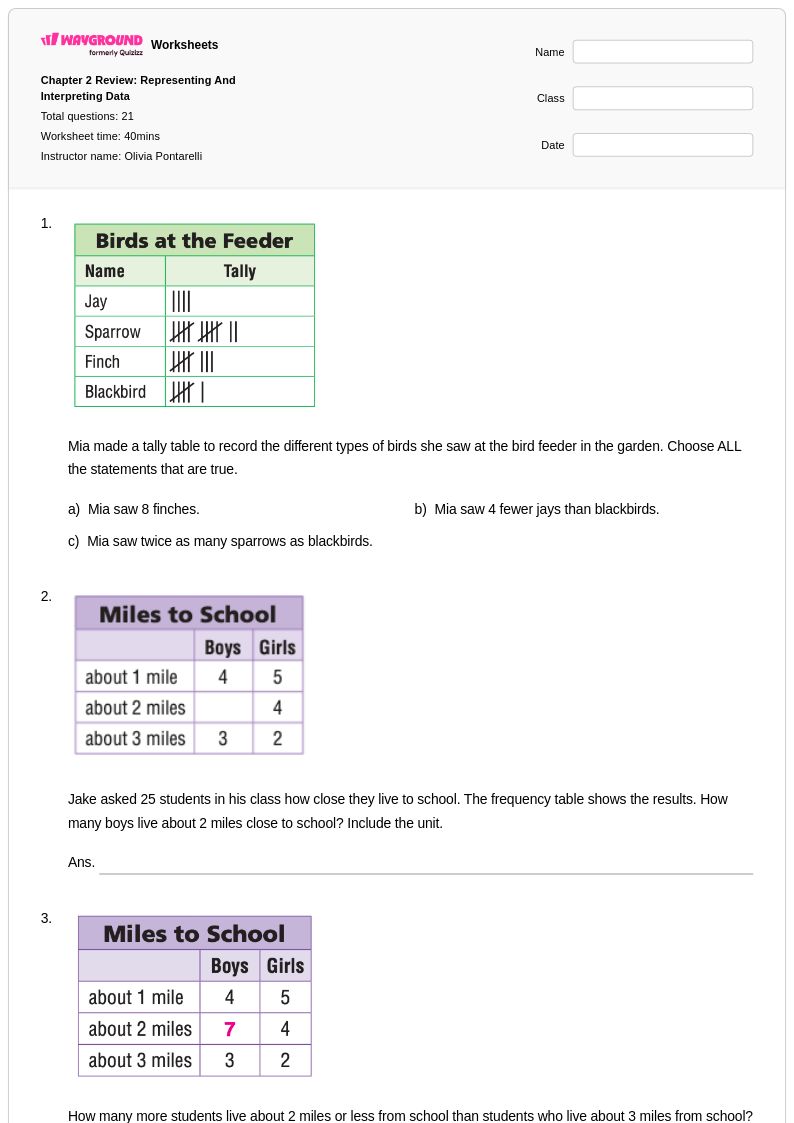
21 Q
3rd
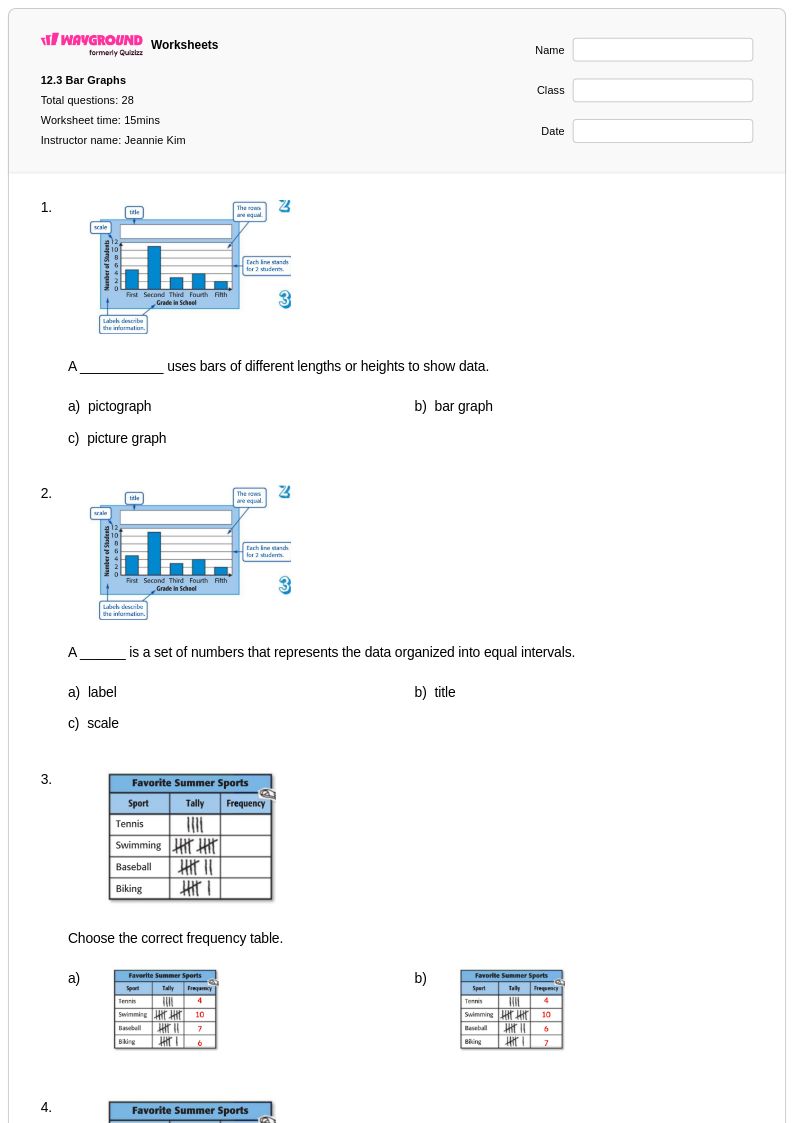
28 Q
3rd
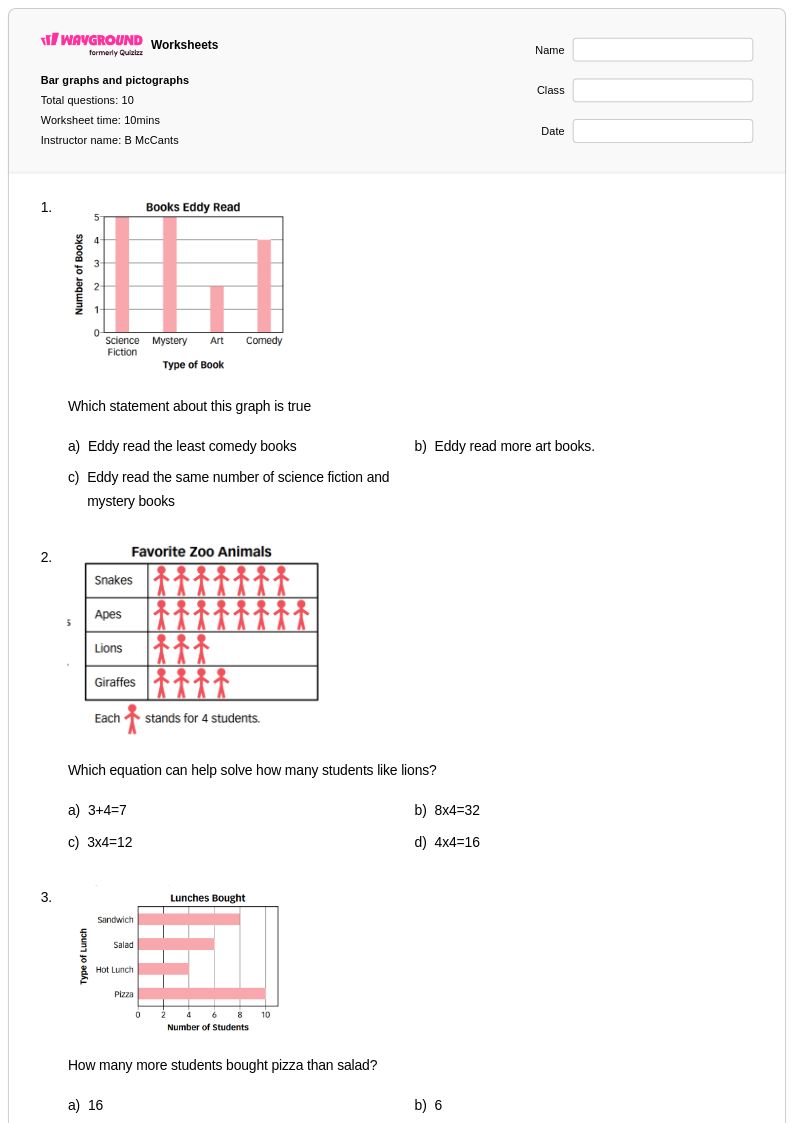
10 Q
2nd - 4th
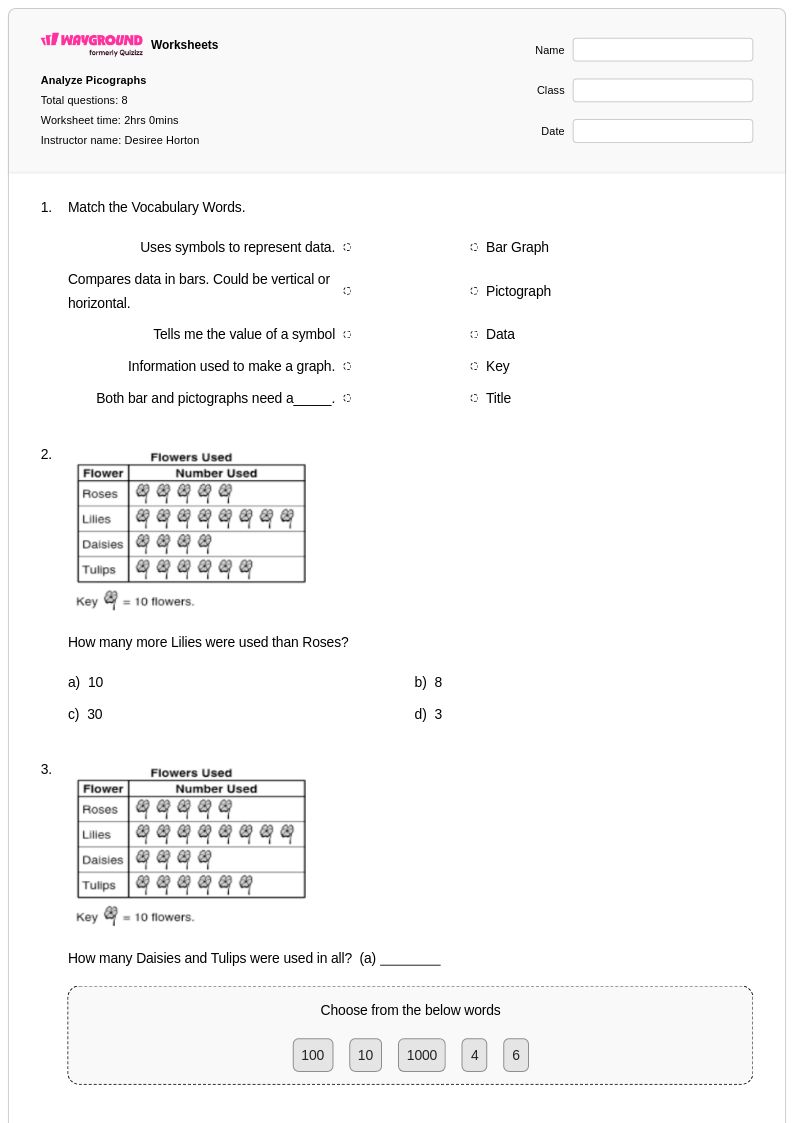
8 Q
3rd
13 Q
3rd
16 Q
3rd - 4th
10 Q
3rd
10 Q
3rd - 4th
13 Q
3rd
10 Q
2nd - 3rd
10 Q
3rd
5 Q
3rd
14 Q
3rd
10 Q
3rd
10 Q
3rd
14 Q
3rd
20 Q
3rd
34 Q
3rd
15 Q
3rd - 4th
15 Q
3rd
20 Q
2nd - 3rd
10 Q
2nd - 4th
15 Q
1st - 3rd
13 Q
3rd
Explore Interpreting Graphs Worksheets by Grades
Explore Other Subject Worksheets for grade 3
Explore printable Interpreting Graphs worksheets for Grade 3
Interpreting graphs worksheets for Grade 3 students available through Wayground (formerly Quizizz) provide essential practice in reading and understanding visual data representations including bar graphs, pictographs, and simple line plots. These comprehensive worksheets strengthen critical mathematical skills by teaching young learners how to extract meaningful information from charts and graphs, compare data sets, identify trends, and answer questions based on visual data presentations. Each worksheet collection includes detailed answer keys and is available as free printables in convenient pdf format, offering structured practice problems that progress from basic graph reading to more complex data interpretation tasks that align with third-grade mathematical expectations.
Wayground (formerly Quizizz) supports educators with an extensive library of millions of teacher-created interpreting graphs resources specifically designed for Grade 3 mathematics instruction. The platform's robust search and filtering capabilities allow teachers to quickly locate worksheets that match specific learning objectives and standards alignment requirements, while built-in differentiation tools enable customization for diverse student needs and ability levels. These versatile resources are available in both printable pdf format for traditional classroom use and digital formats for interactive learning environments, making them invaluable for lesson planning, targeted remediation sessions, enrichment activities, and regular skill practice that builds students' confidence in analyzing and interpreting data visualizations.