
15 Q
7th - 9th
21 Q
6th - 8th
20 Q
6th - 12th
20 Q
5th - 12th
18 Q
5th - 8th
24 Q
6th - 8th
20 Q
5th - 9th
15 Q
8th
20 Q
2nd - 4th
20 Q
6th - 8th
20 Q
6th
15 Q
3rd
16 Q
8th - 10th
23 Q
7th
20 Q
6th - 8th
21 Q
7th

10 Q
4th
21 Q
4th
10 Q
5th
16 Q
5th - 8th
8 Q
7th
25 Q
6th - 7th
15 Q
3rd
8 Q
5th - 8th
Explore Worksheets by Subjects
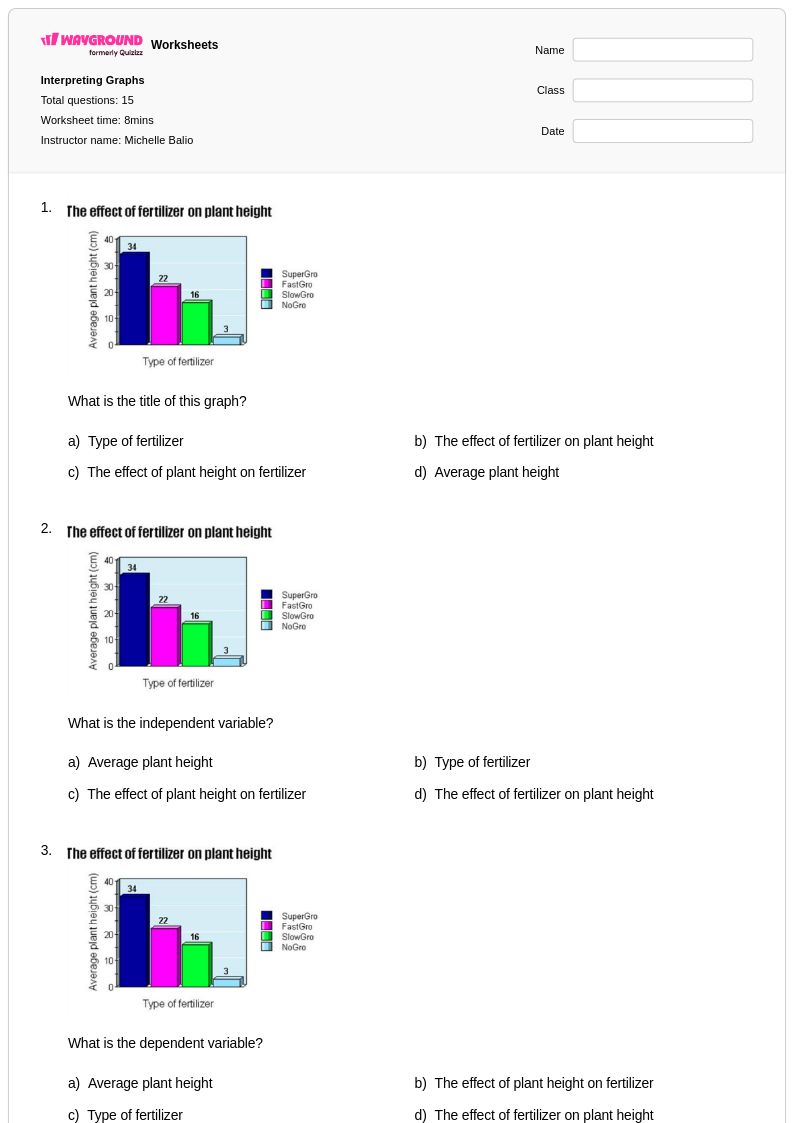
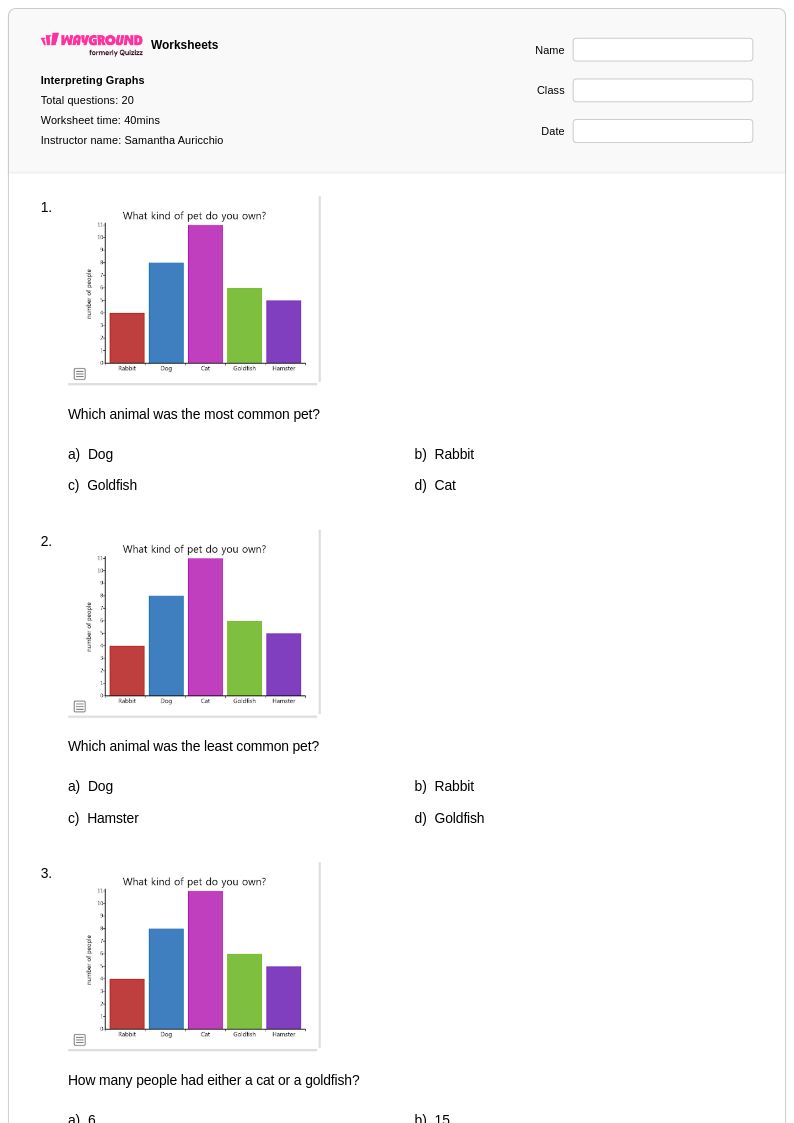
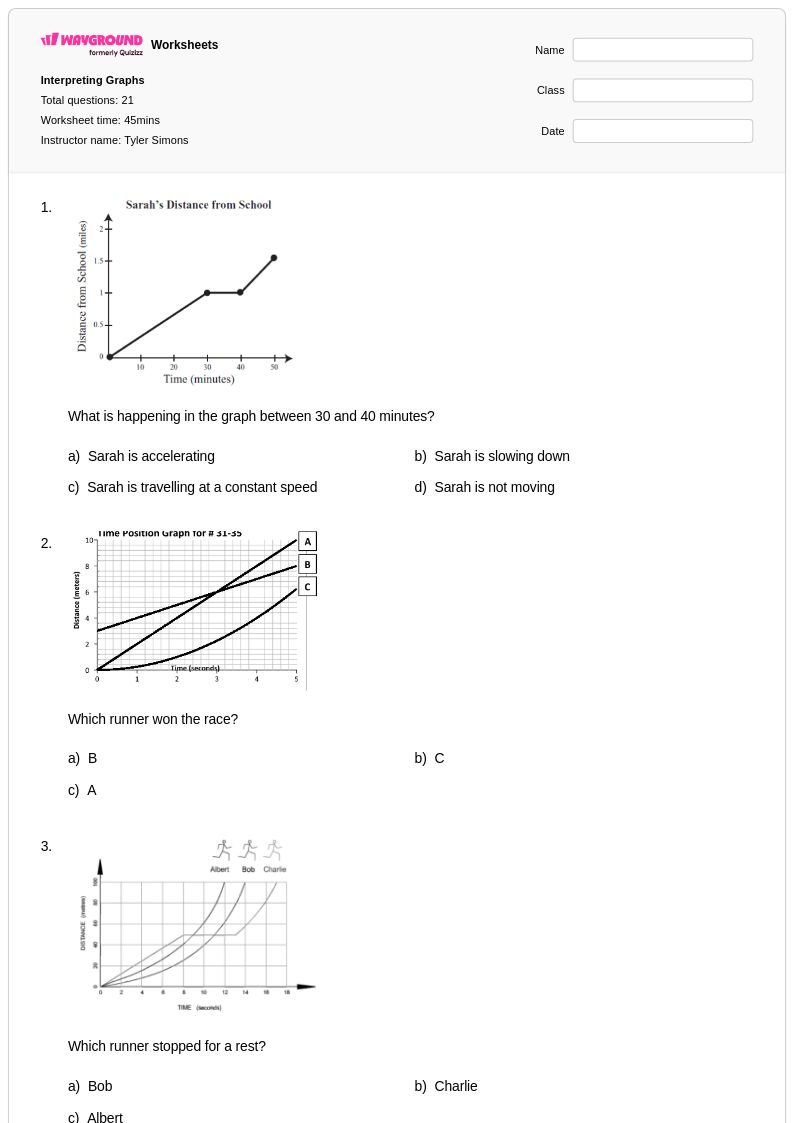
Explore printable Interpreting Graphs worksheets
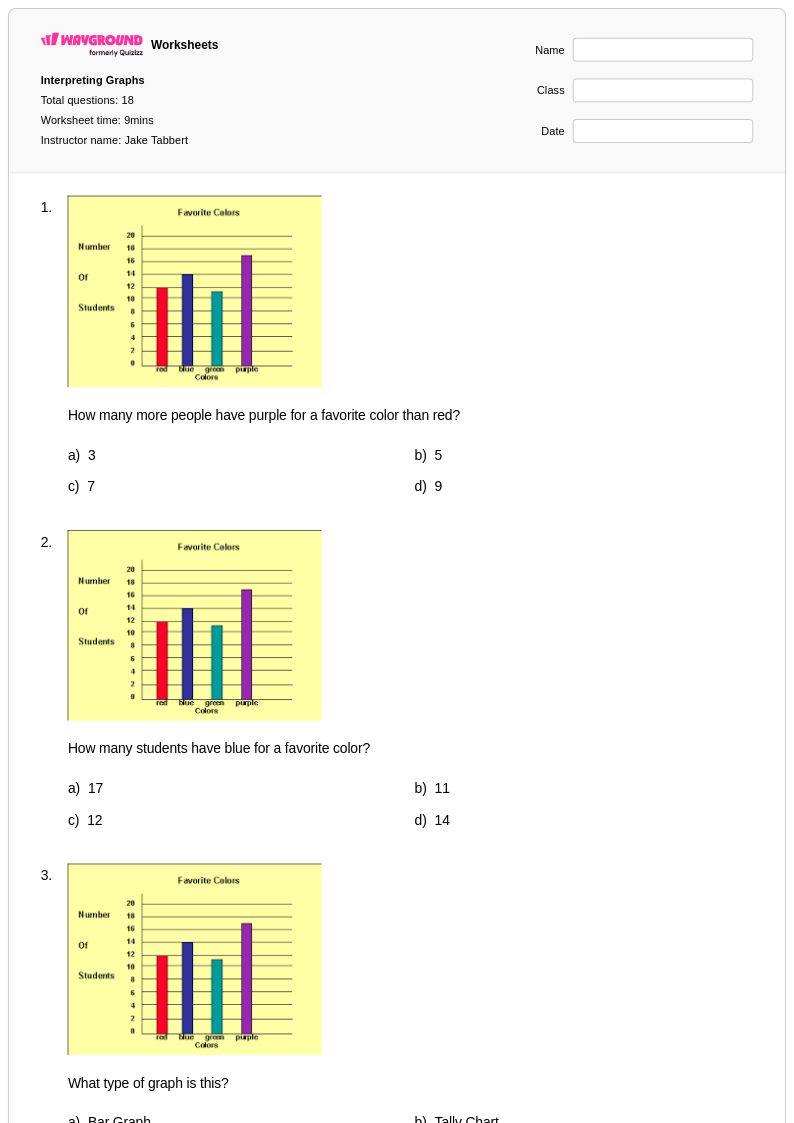
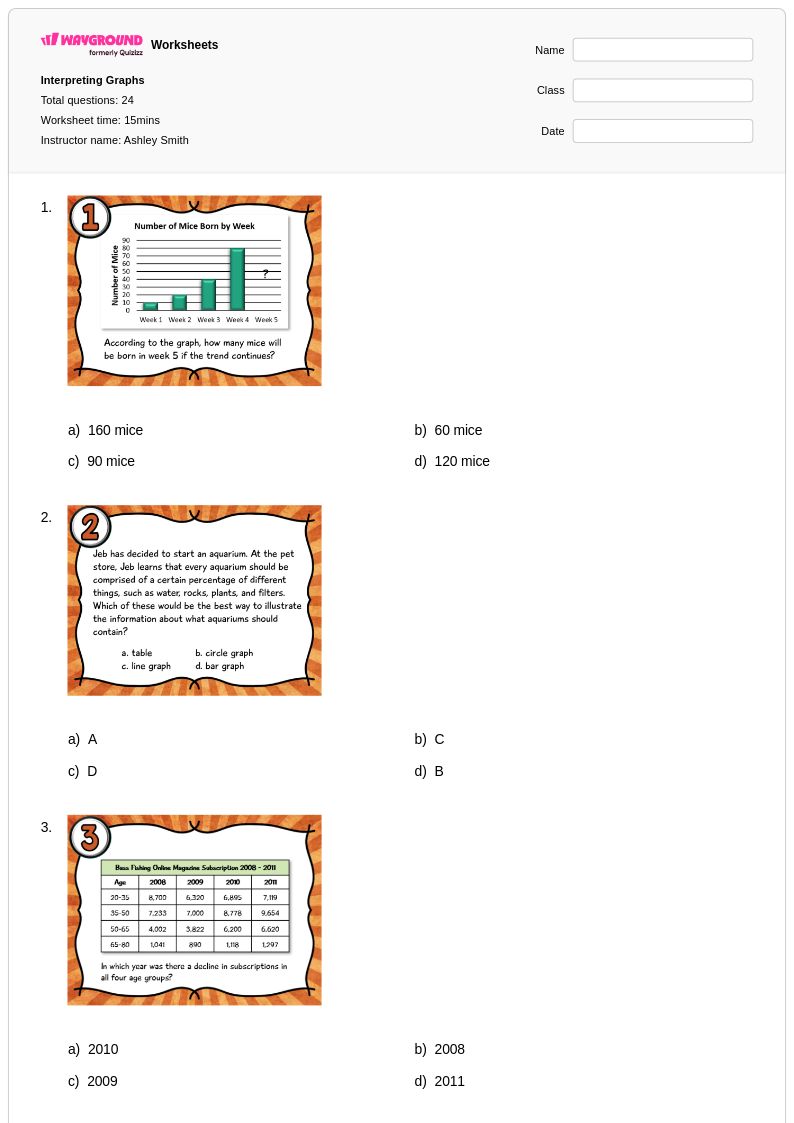
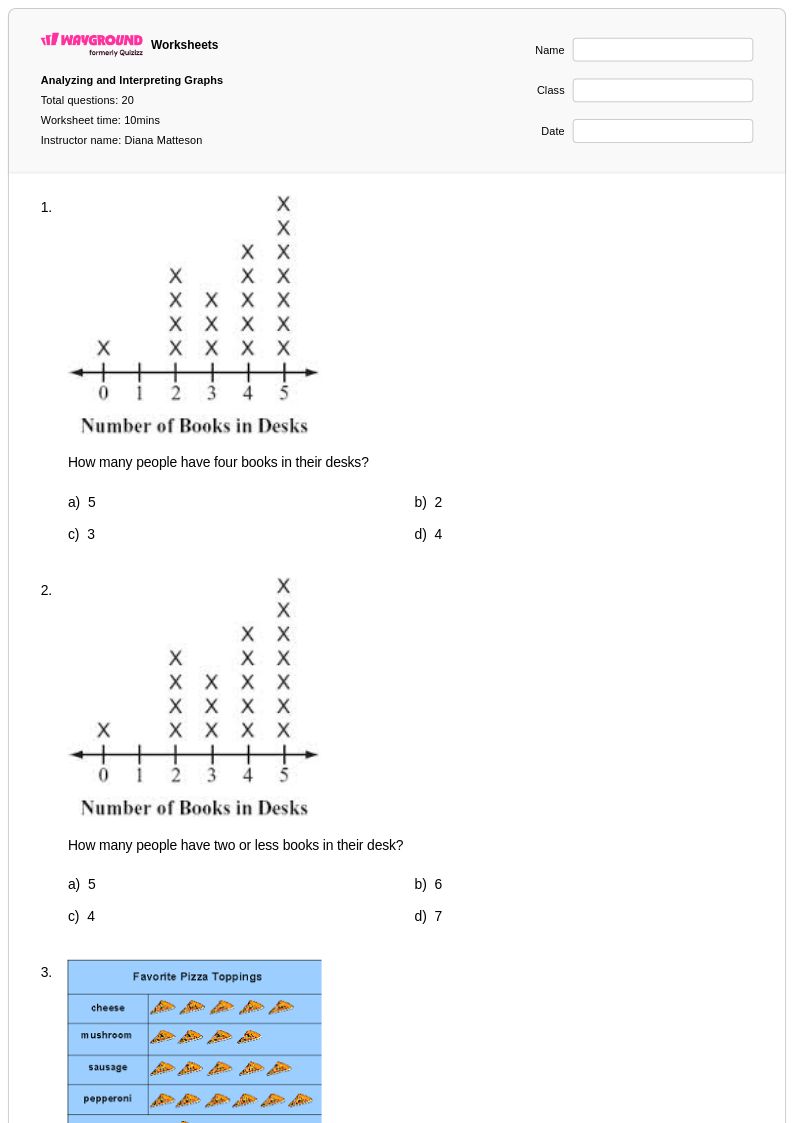
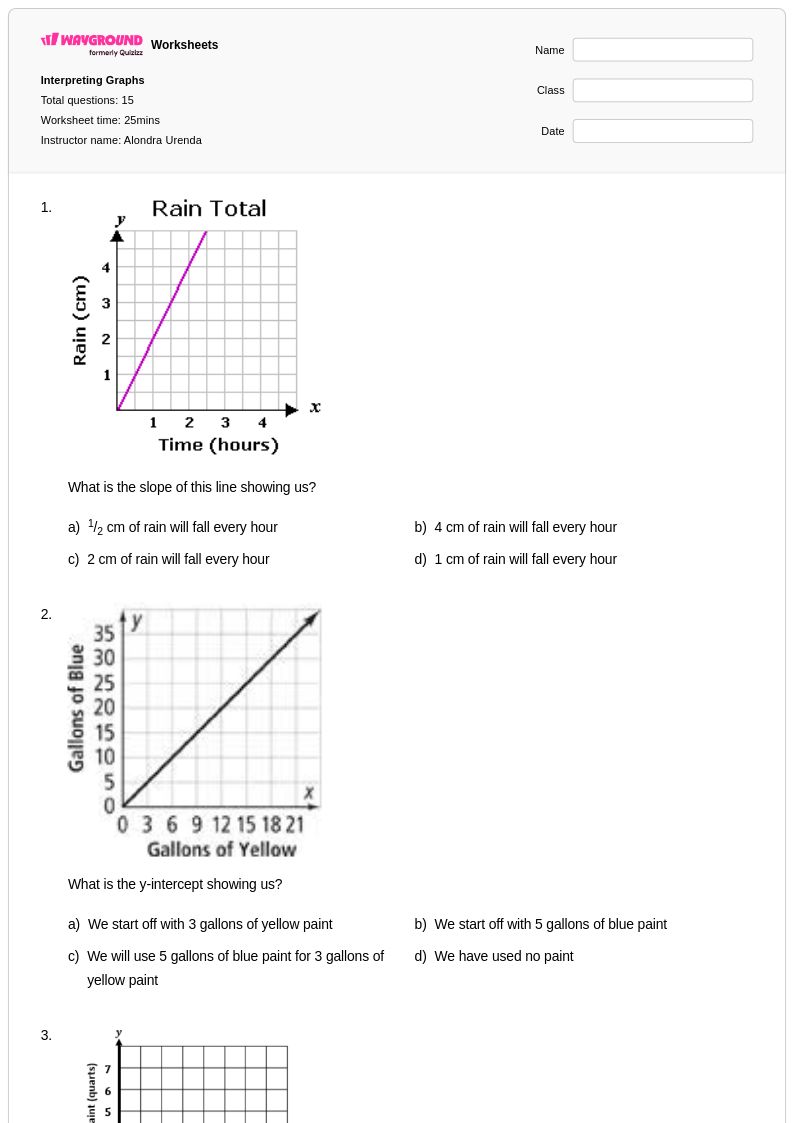
Interpreting graphs worksheets available through Wayground (formerly Quizizz) provide students with essential practice in analyzing and extracting meaningful information from various types of data visualizations including bar graphs, line graphs, pie charts, and scatter plots. These comprehensive worksheets strengthen critical mathematical thinking skills by teaching students to read scales accurately, identify trends and patterns, compare data sets, and draw logical conclusions from graphical representations. Each worksheet collection includes detailed answer keys and is available as free printables in pdf format, making it easy for educators to implement targeted practice problems that build students' confidence in working with visual data representations across multiple mathematical contexts.
Wayground (formerly Quizizz) empowers teachers with access to millions of educator-created interpreting graphs resources that can be easily searched and filtered to match specific instructional needs and standards alignment requirements. The platform's robust differentiation tools allow teachers to customize worksheets for various skill levels, ensuring that both struggling learners and advanced students receive appropriate challenges in graph interpretation. These flexible resources are available in both printable and digital formats, including downloadable pdfs, making them ideal for classroom instruction, homework assignments, remediation sessions, and enrichment activities. Teachers can efficiently plan lessons knowing they have access to high-quality materials that systematically develop students' abilities to analyze graphical data and communicate mathematical insights effectively.