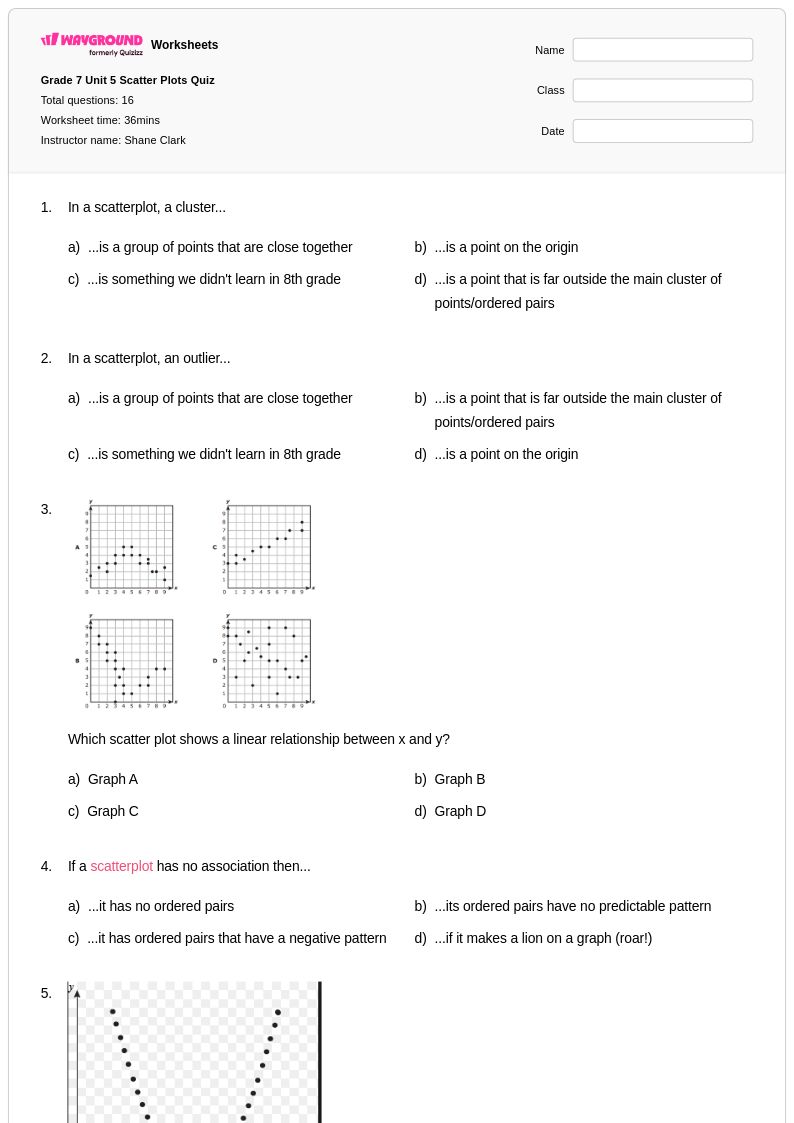
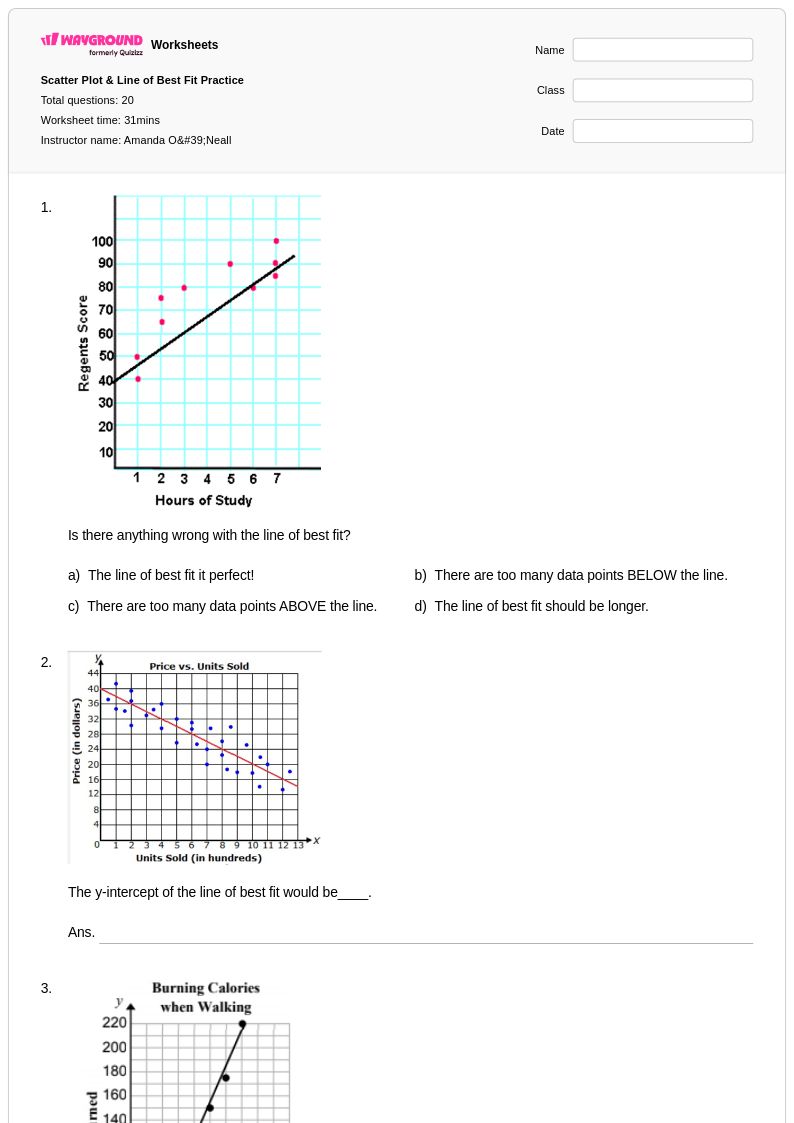
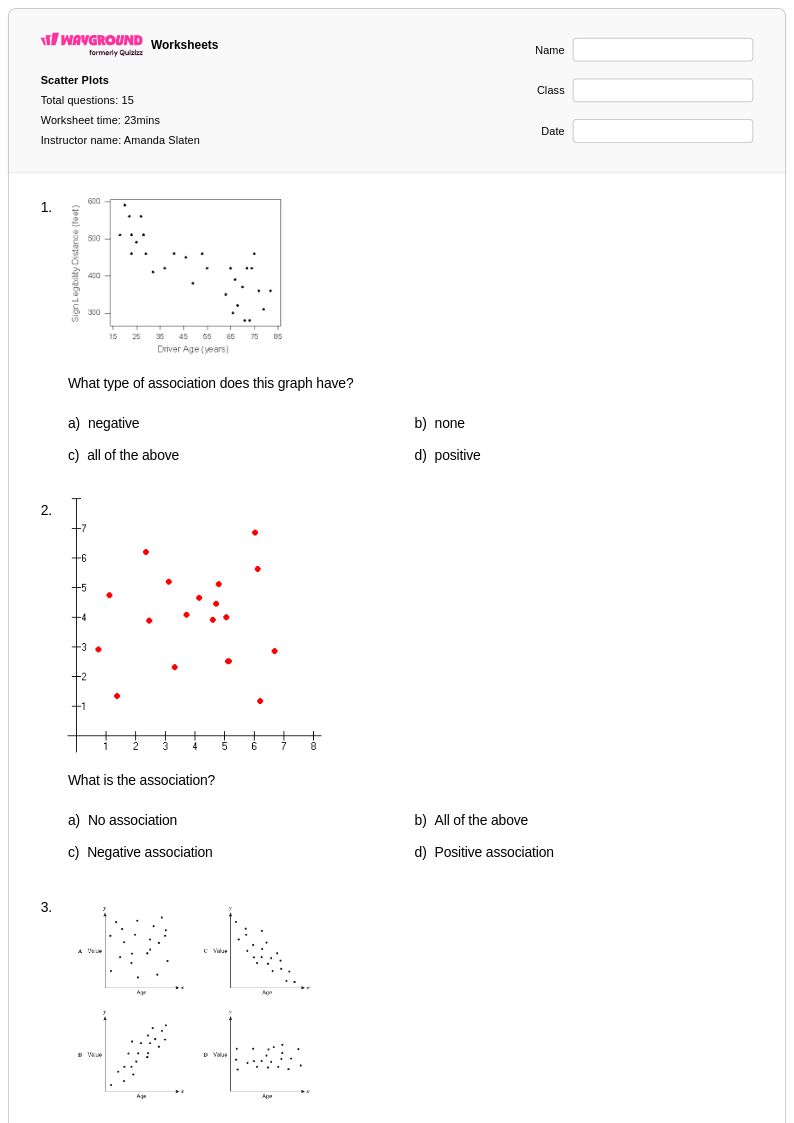
Free Printable Scatter Plot Word Problems worksheets
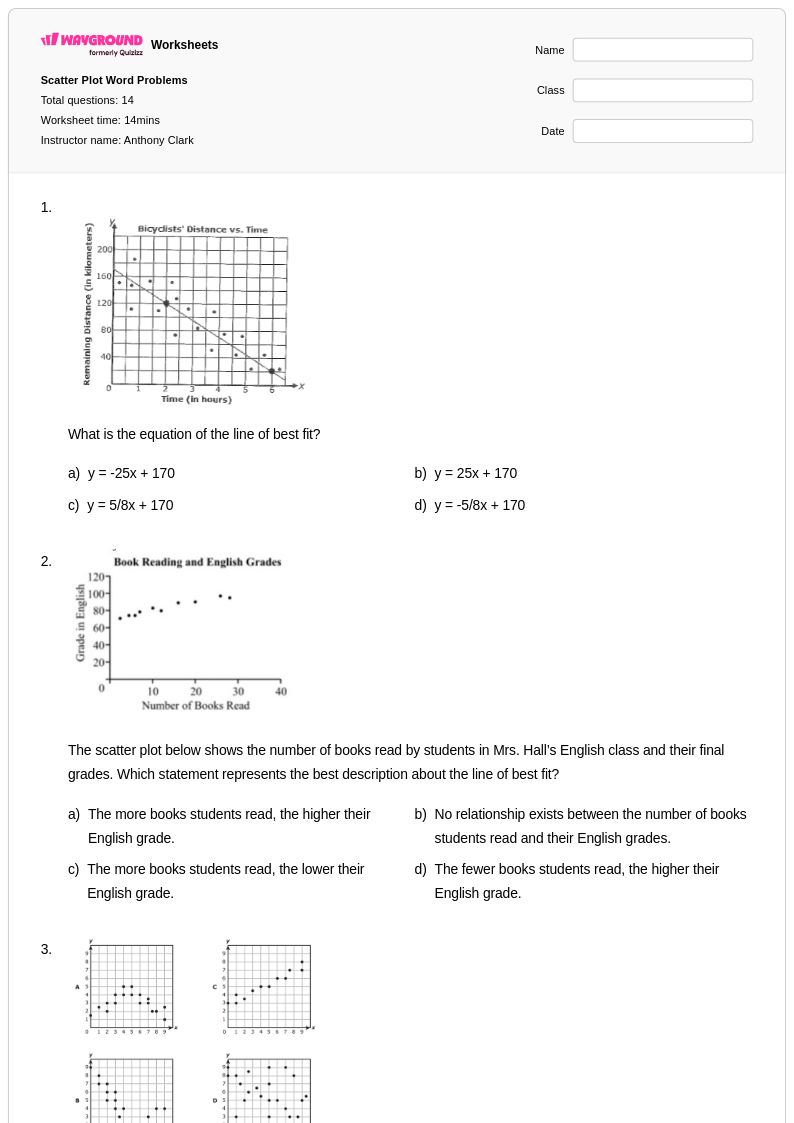
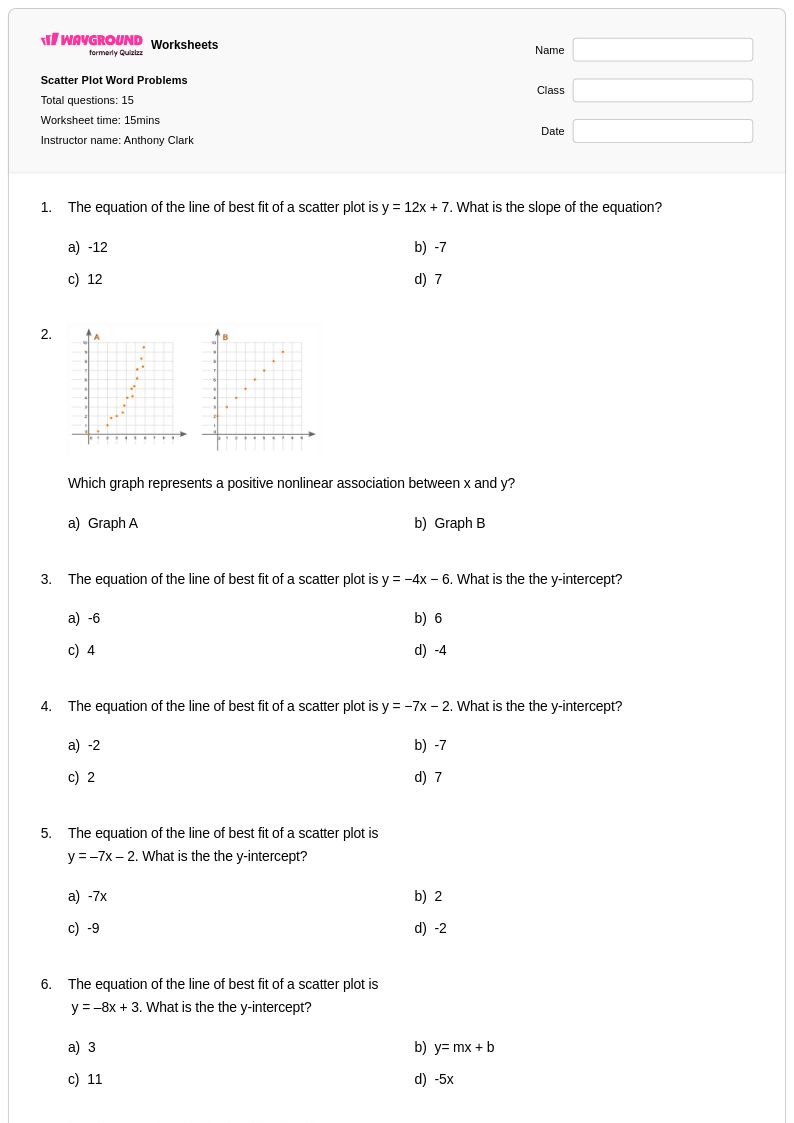
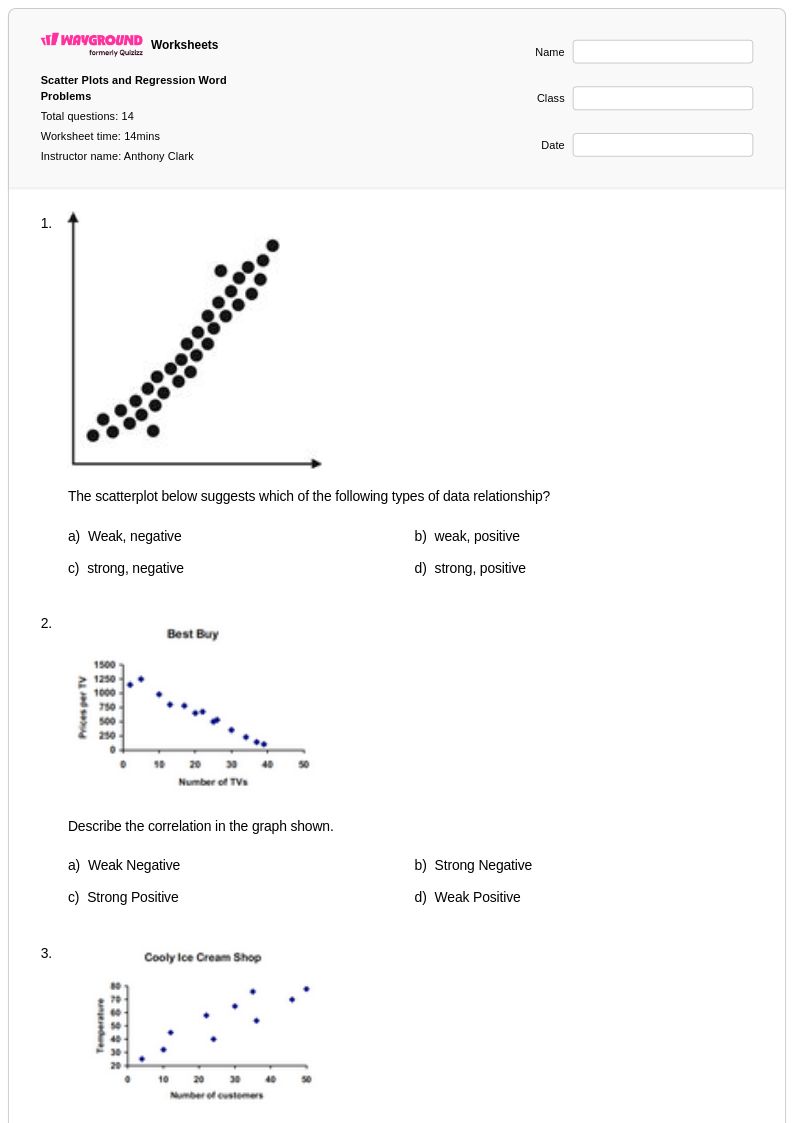
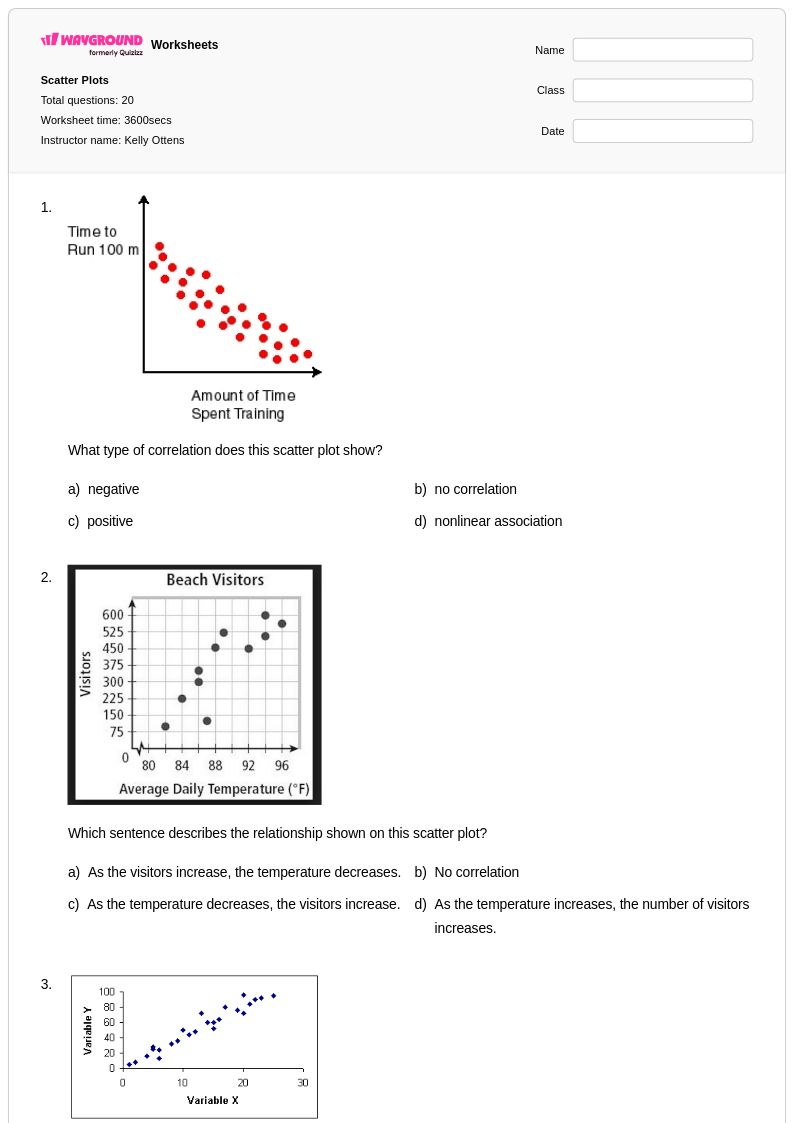
Wayground's free scatter plot word problems worksheets provide comprehensive practice problems and answer keys to help students master interpreting data relationships and creating graphs from real-world scenarios through engaging printable PDFs.
Explore printable Scatter Plot Word Problems worksheets
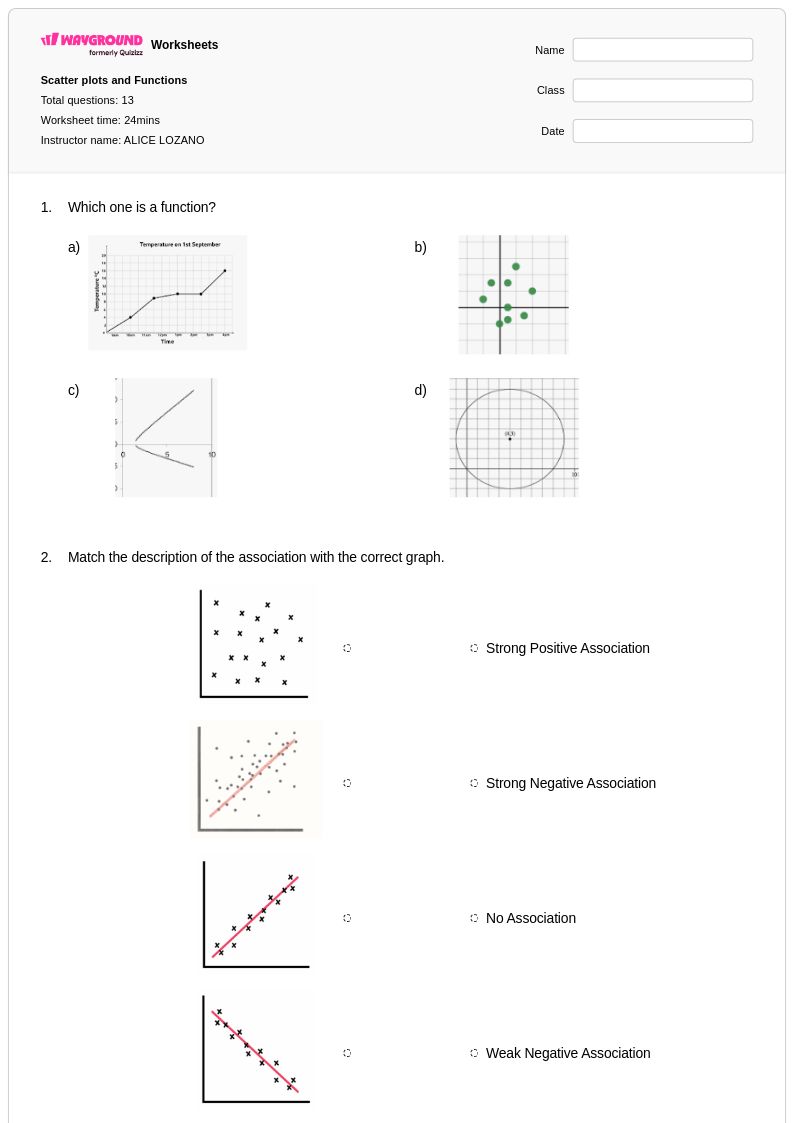
Scatter plot word problems provide students with essential practice in analyzing real-world relationships through visual data representation and mathematical reasoning. These comprehensive worksheets available through Wayground (formerly Quizizz) challenge learners to interpret correlation patterns, make predictions based on plotted data points, and solve multi-step problems that combine graphing skills with practical applications. Students develop critical thinking abilities as they work through practice problems involving scenarios like comparing study time to test scores, analyzing the relationship between temperature and ice cream sales, or examining connections between height and shoe size. Each worksheet includes detailed answer keys and step-by-step solutions, making these free printables valuable resources for both independent study and classroom instruction in pdf format.
Wayground (formerly Quizizz) empowers educators with millions of teacher-created scatter plot word problem worksheets that streamline lesson planning and enhance mathematical instruction. The platform's robust search and filtering capabilities allow teachers to quickly locate materials aligned with specific learning standards and differentiate instruction based on individual student needs. These customizable resources are available in both printable pdf format and interactive digital versions, providing flexibility for various classroom environments and learning preferences. Teachers can efficiently implement targeted remediation for struggling students, offer enrichment opportunities for advanced learners, and provide consistent skill practice that reinforces the connection between mathematical concepts and real-world applications, ensuring comprehensive support for developing data analysis competencies.
FAQs
How do I teach scatter plot word problems?
Start by connecting to students' prior knowledge of coordinate planes. Use a relatable word problem, like the relationship between hours spent studying and test scores. Guide students to identify the independent (x-axis) and dependent (y-axis) variables first. Then, model how to plot the first few data points before having them complete the plot. Finally, facilitate a discussion about the visual pattern they see in the data.
What skills do these worksheets help students practice?
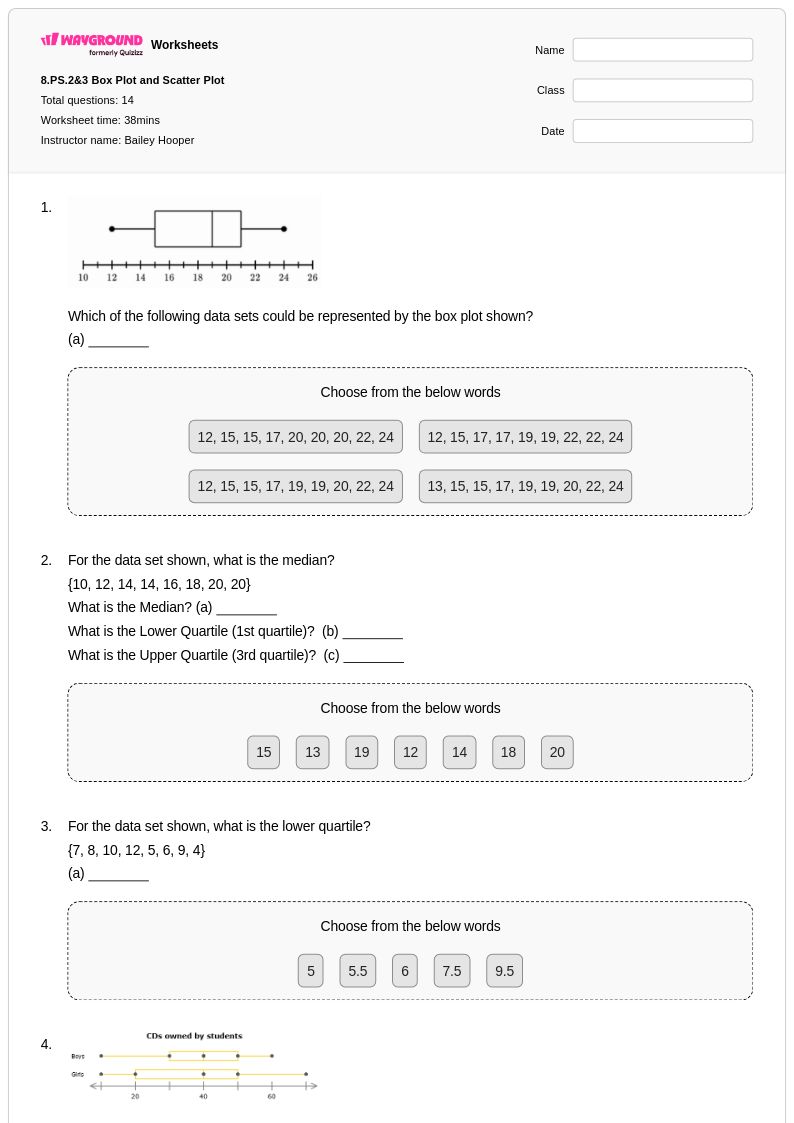
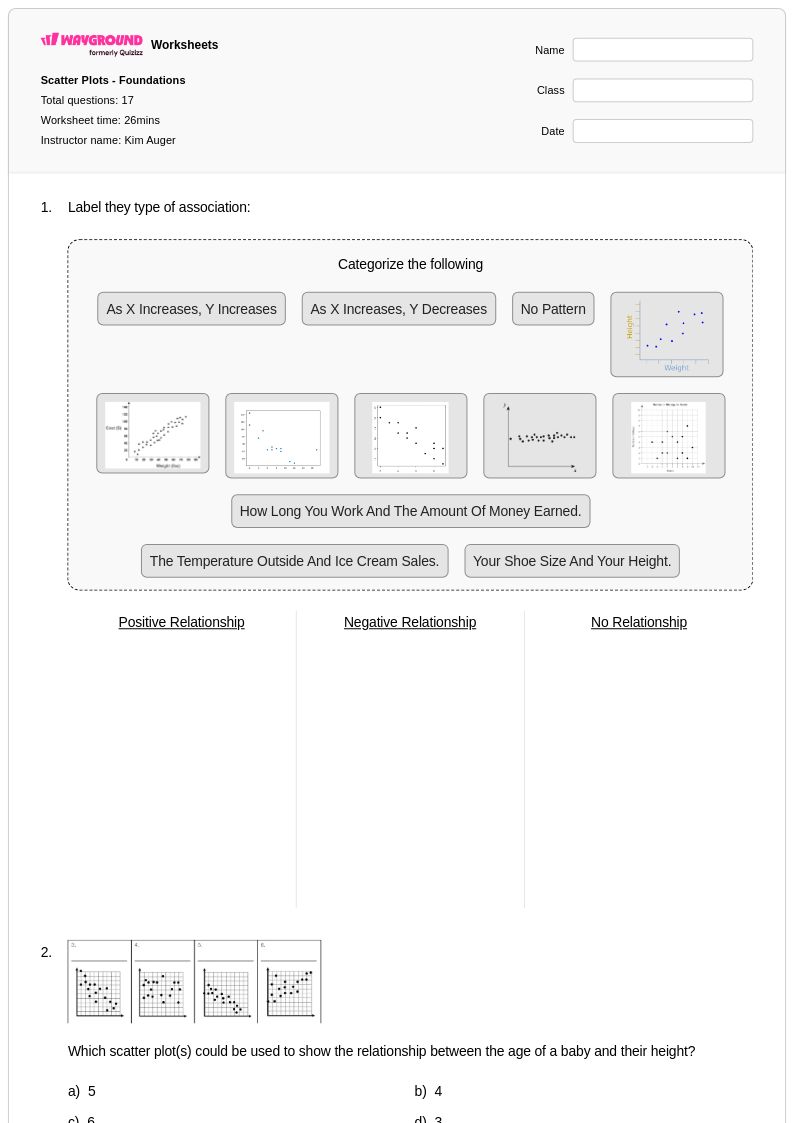
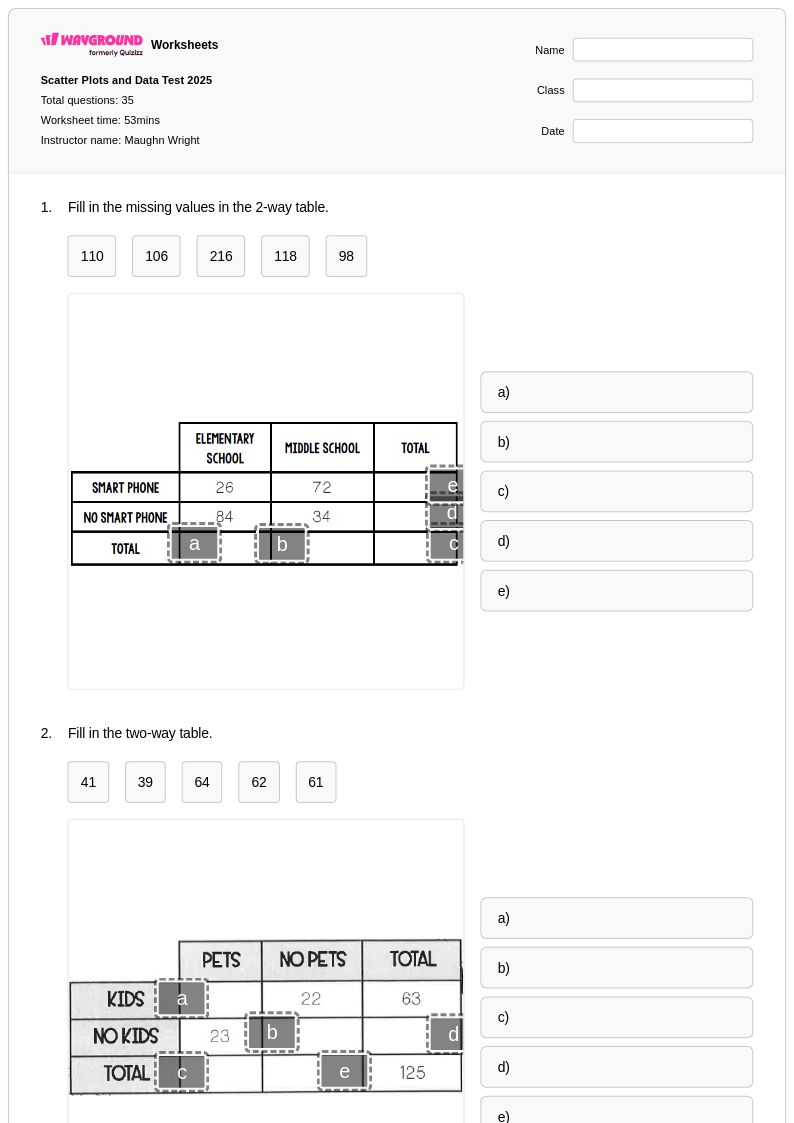
These worksheets provide comprehensive practice in interpreting bivariate data. Students will work on plotting data points from a table, identifying the type of correlation (positive, negative, or no correlation), describing the relationship between two variables in context, and making informal predictions based on the visual trend in the data.
What are common student mistakes when learning about scatter plots?
Students often mix up the x- and y-axes when plotting data from a word problem. Another common issue is confusing correlation with causation; they might assume one variable *causes* the change in the other, rather than just being associated. Finally, students may struggle to describe the pattern, using vague language instead of specific terms like 'strong positive correlation'.
How can I use this Wayground worksheet with my class?
You can assign this worksheet in multiple ways to fit your classroom needs. Host it as an interactive digital quiz on the Wayground platform for immediate feedback, or download the printable PDF for students to complete on paper. Every worksheet includes a complete answer key for easy grading.
What grade level is this topic for?
Scatter plots are formally introduced in 8th grade under the Common Core State Standards. However, introductory concepts like plotting points and identifying simple patterns can be taught as early as 6th grade, while more advanced analysis involving lines of best fit and regression equations is covered in high school Algebra and Statistics courses.
How do scatter plots fit into the math curriculum?
Scatter plots are a key component of the statistics and probability strand of the middle school curriculum, aligned with Common Core's emphasis on data analysis. The topic builds on students' understanding of the coordinate plane (6th grade) and leads into the formal study of bivariate data in 8th grade (8.SP.A.1). This foundation is essential for later high school topics like linear regression and correlation coefficients.