

15 Q
8th
14 Q
7th
6 Q
9th - 12th
10 Q
9th
20 Q
9th - 12th
10 Q
7th
23 Q
7th - 8th
9 Q
7th
18 Q
9th - 12th
17 Q
6th
20 Q
8th - Uni

15 Q
7th
30 Q
9th
13 Q
7th
8 Q
7th
30 Q
11th - 12th
20 Q
9th - 12th
20 Q
11th
16 Q
Uni
14 Q
5th
41 Q
11th - 12th

20 Q
8th - 9th

16 Q
9th - Uni
21 Q
12th
Explore Worksheets by Subjects
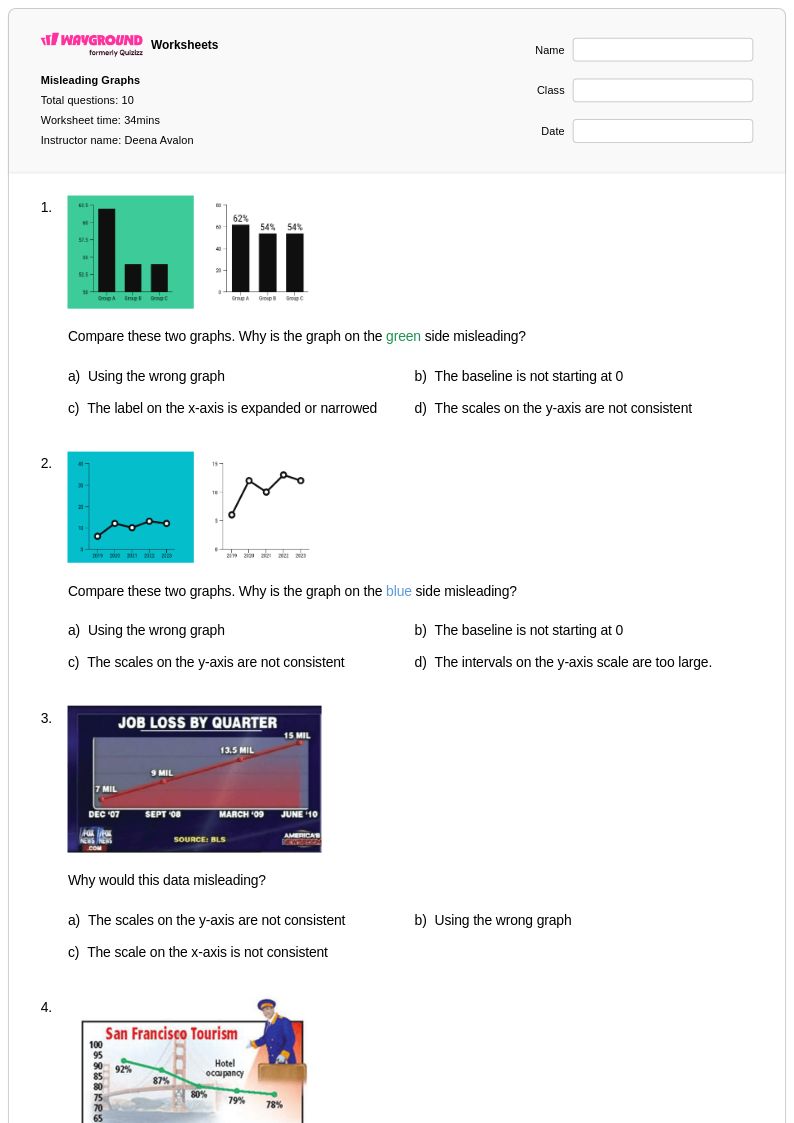
Explore printable Misleading Graphs worksheets
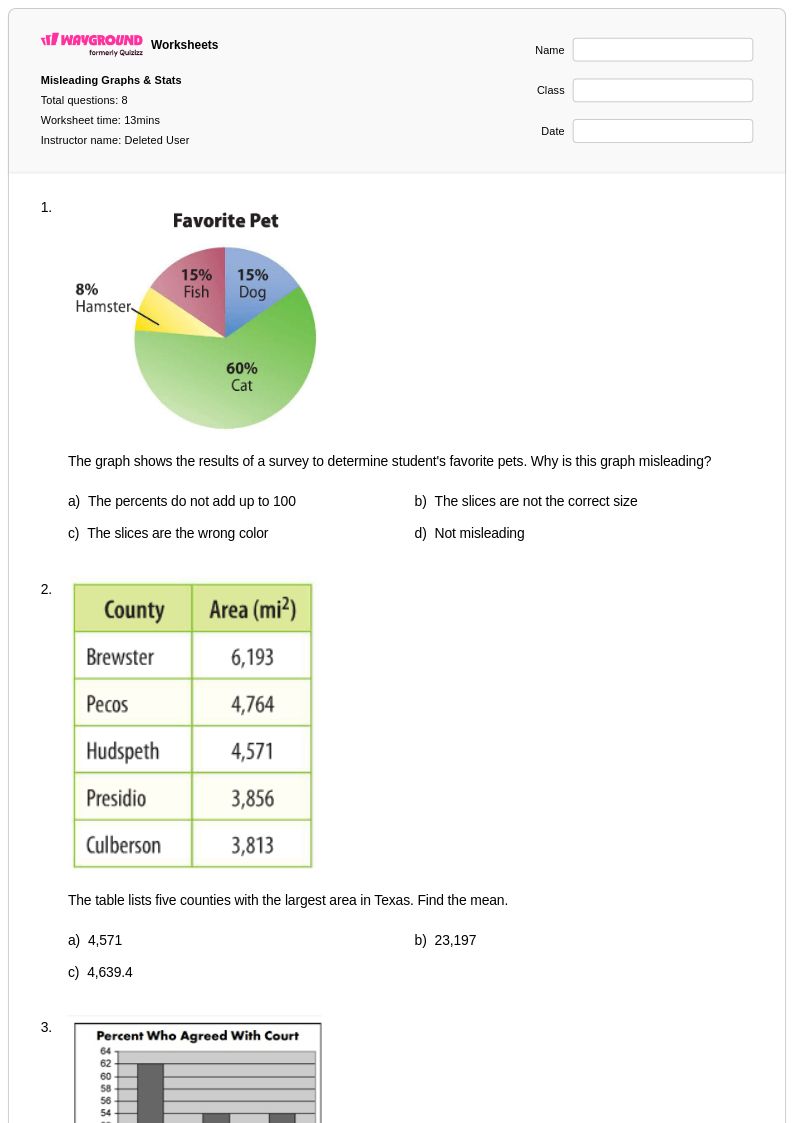
Misleading graphs worksheets available through Wayground (formerly Quizizz) provide students with essential practice in critically analyzing visual data representations and identifying common statistical manipulation techniques. These comprehensive worksheets strengthen students' ability to recognize distorted scales, inappropriate graph types, selective data presentation, and visual tricks that can skew interpretation of statistical information. Through carefully designed practice problems, students learn to evaluate axis manipulation, misleading visual proportions, cherry-picked data ranges, and other deceptive graphing practices commonly encountered in media and academic contexts. Each worksheet includes detailed answer keys and explanations that help students understand the mathematical reasoning behind identifying these misleading techniques, making these free printables valuable resources for developing statistical literacy and critical thinking skills.
Wayground (formerly Quizizz) supports mathematics educators with an extensive collection of teacher-created misleading graphs worksheets that can be easily customized and differentiated to meet diverse classroom needs. The platform's robust search and filtering capabilities allow teachers to quickly locate resources aligned with specific standards and learning objectives, while the flexible format options enable seamless integration into both digital and traditional classroom environments through printable pdf versions. These millions of expertly designed resources help teachers efficiently plan lessons focused on data interpretation skills, provide targeted remediation for students struggling with graph analysis concepts, and offer enrichment opportunities for advanced learners to explore sophisticated statistical manipulation techniques. The comprehensive answer keys and detailed explanations accompanying each worksheet collection streamline grading processes while providing teachers with talking points for meaningful classroom discussions about media literacy and statistical reasoning.