
20Q
9th - Uni
5Q
9th - 12th
12Q
9th - 12th
20Q
9th - 12th
20Q
9th - Uni
20Q
11th - 12th
10Q
9th
20Q
11th - Uni
30Q
10th - 12th
10Q
11th
32Q
9th - 12th
20Q
10th - 12th
21Q
8th
20Q
9th
16Q
9th - 12th
30Q
9th - 12th
12Q
11th
15Q
9th - 12th
23Q
9th
15Q
8th
20Q
8th
18Q
9th
14Q
9th - 12th
10Q
7th
Explorar hojas de trabajo por grado
Explorar hojas de trabajo por materias
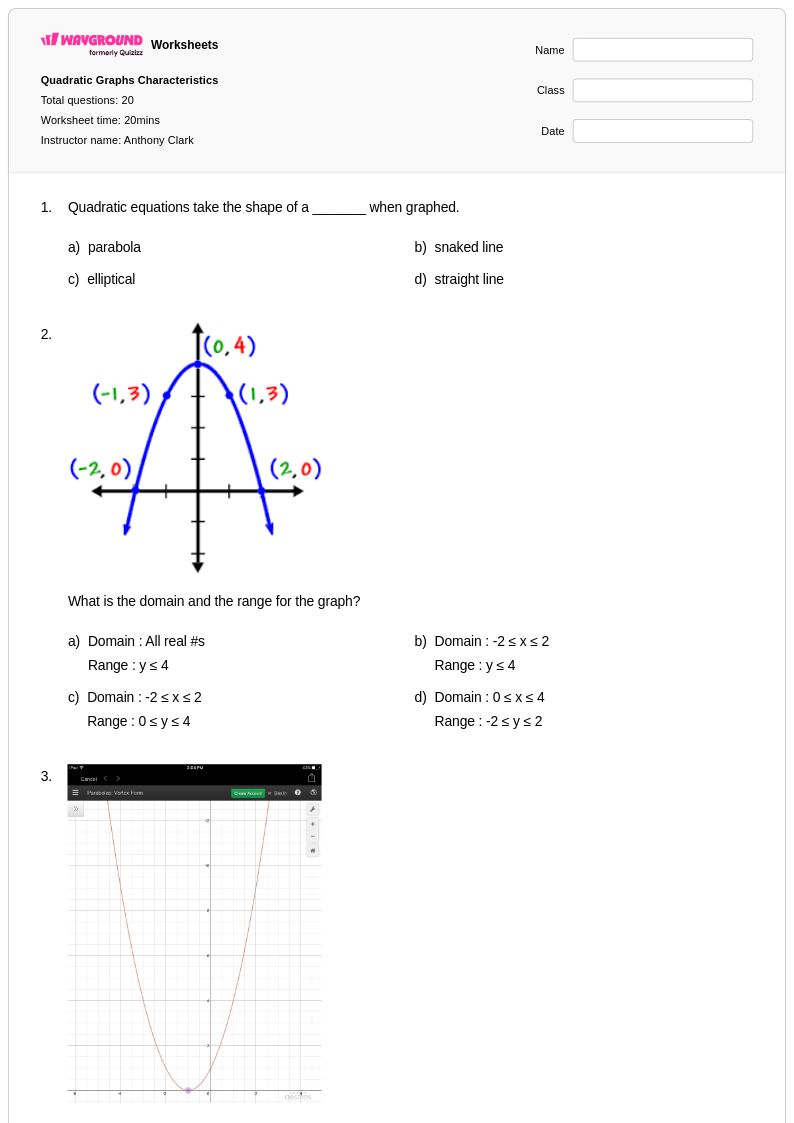
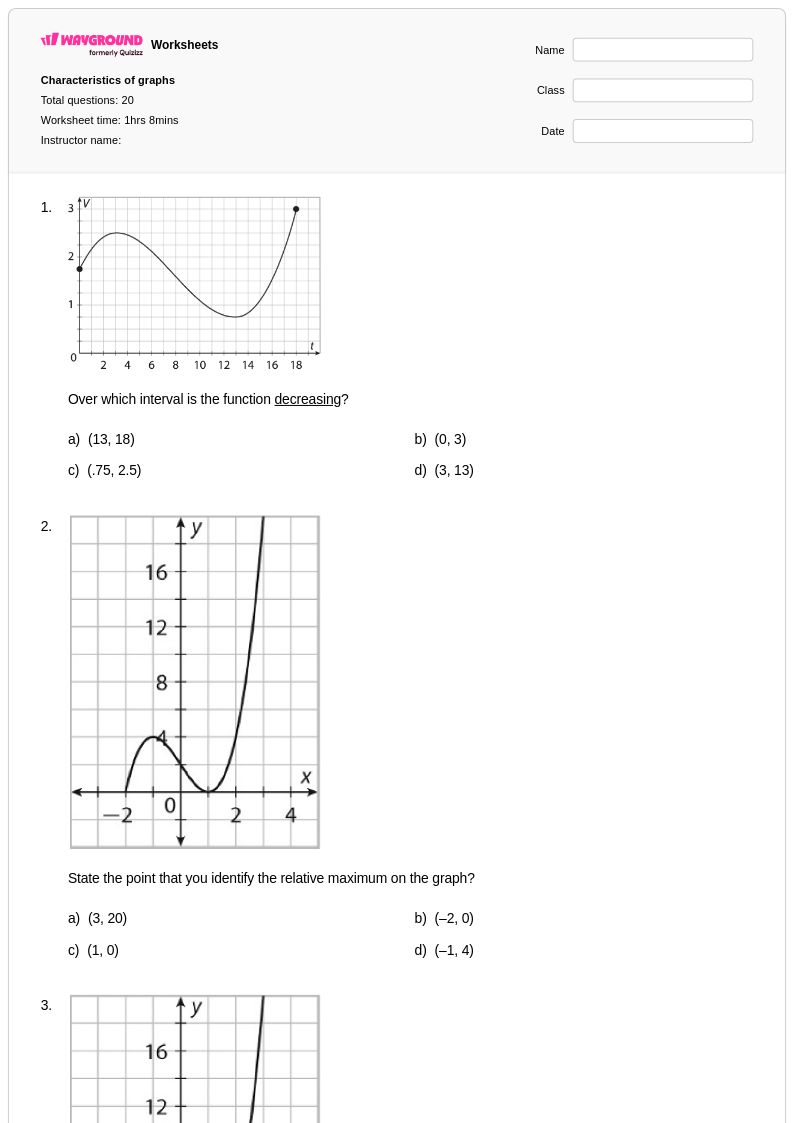
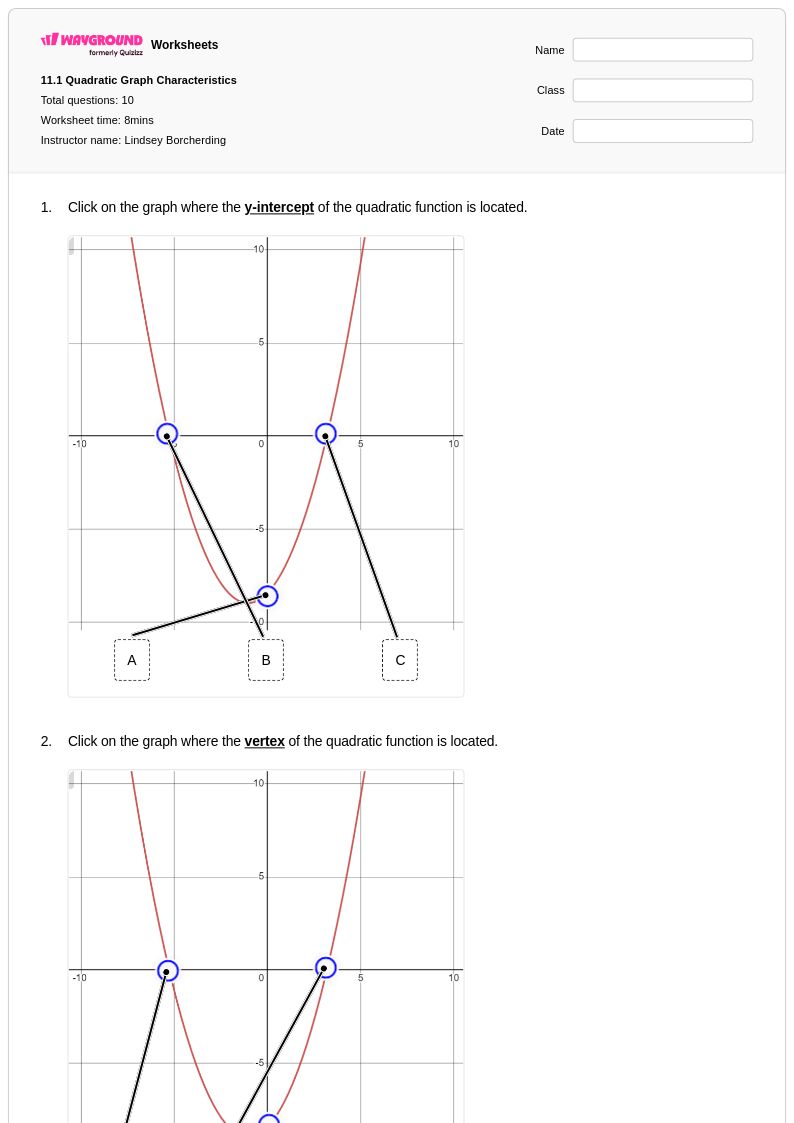
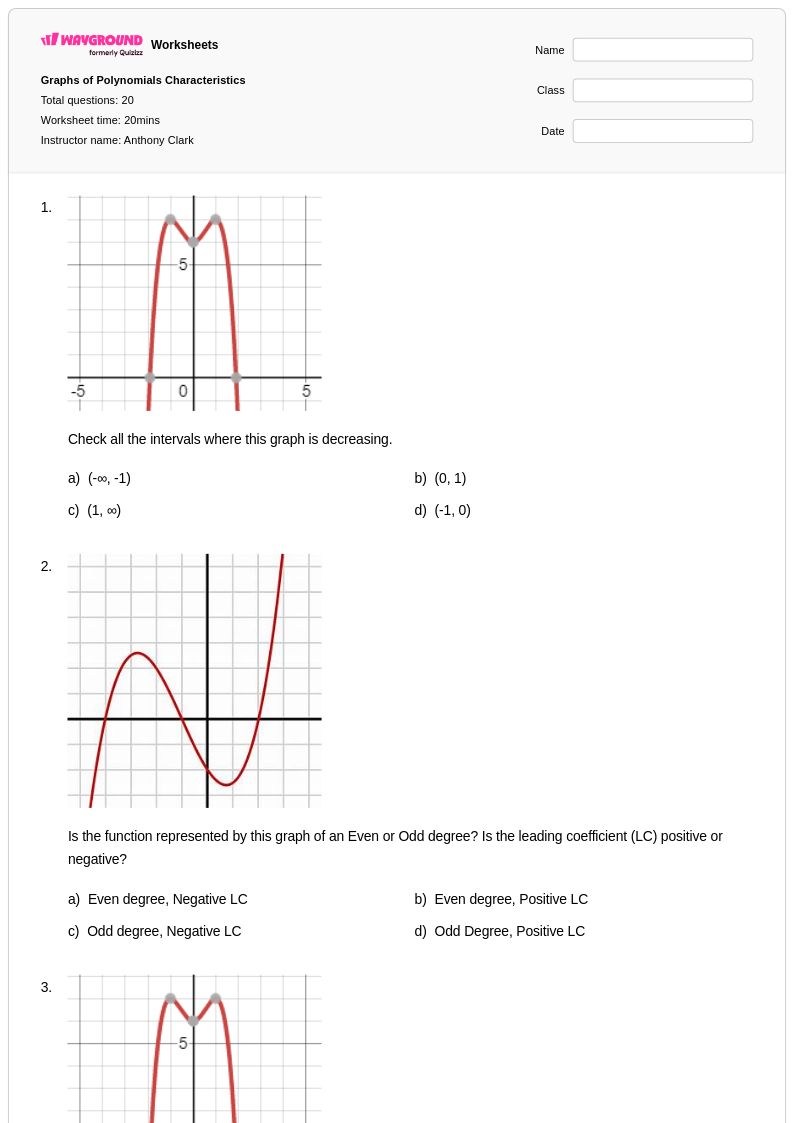
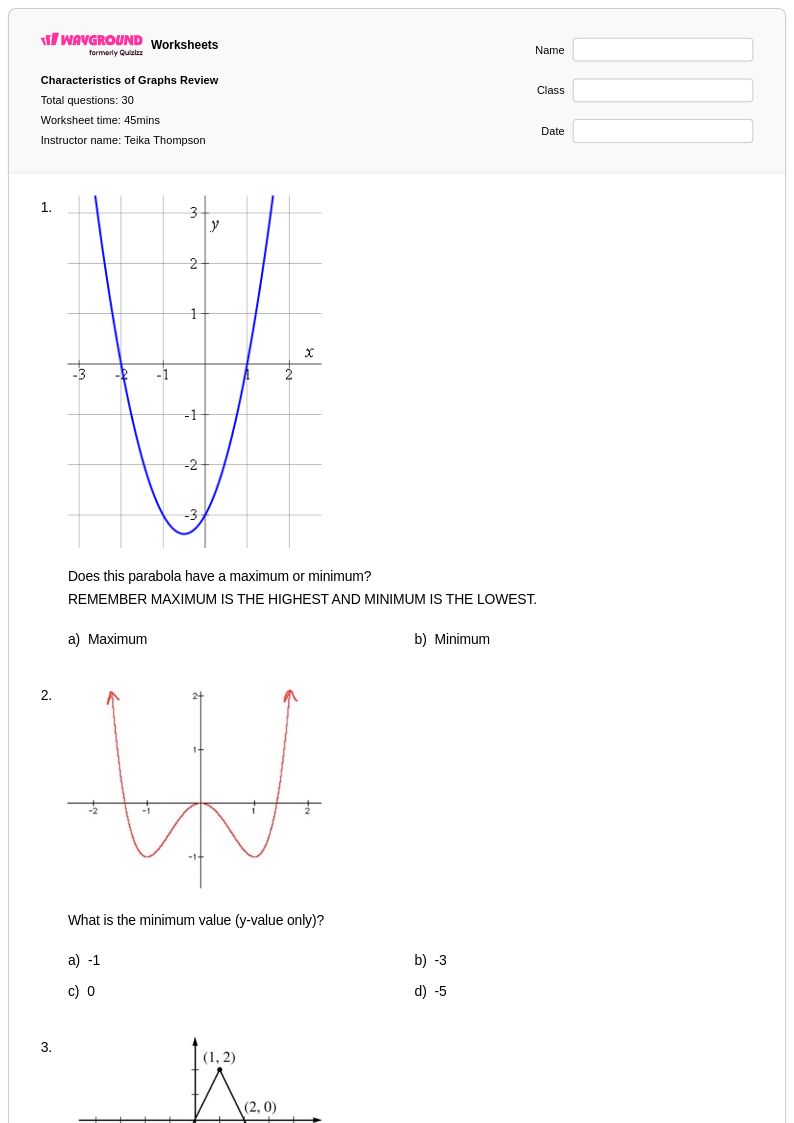
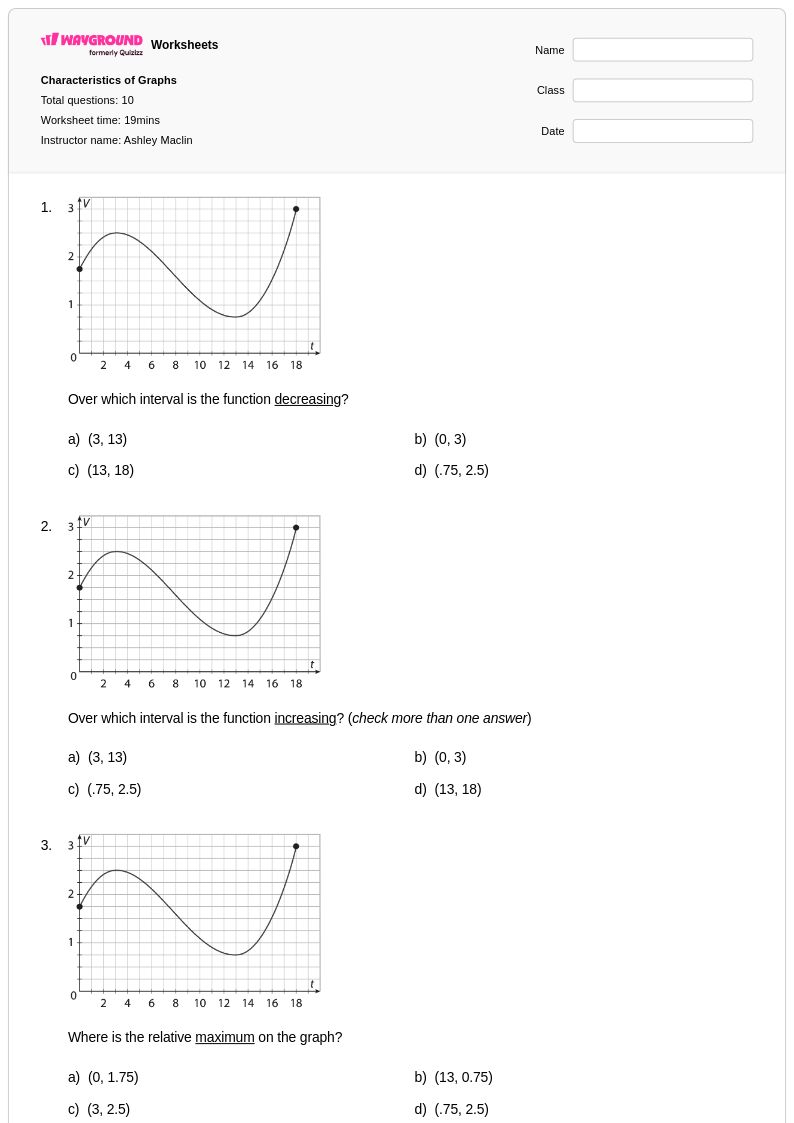
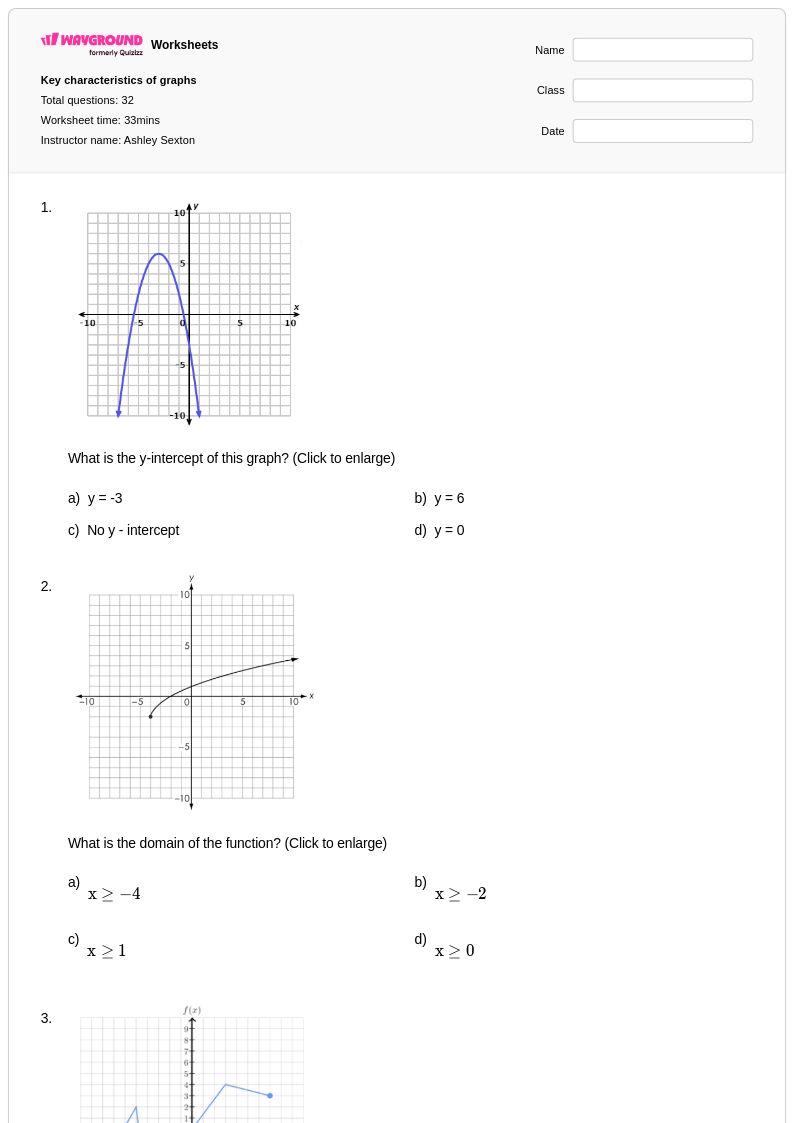
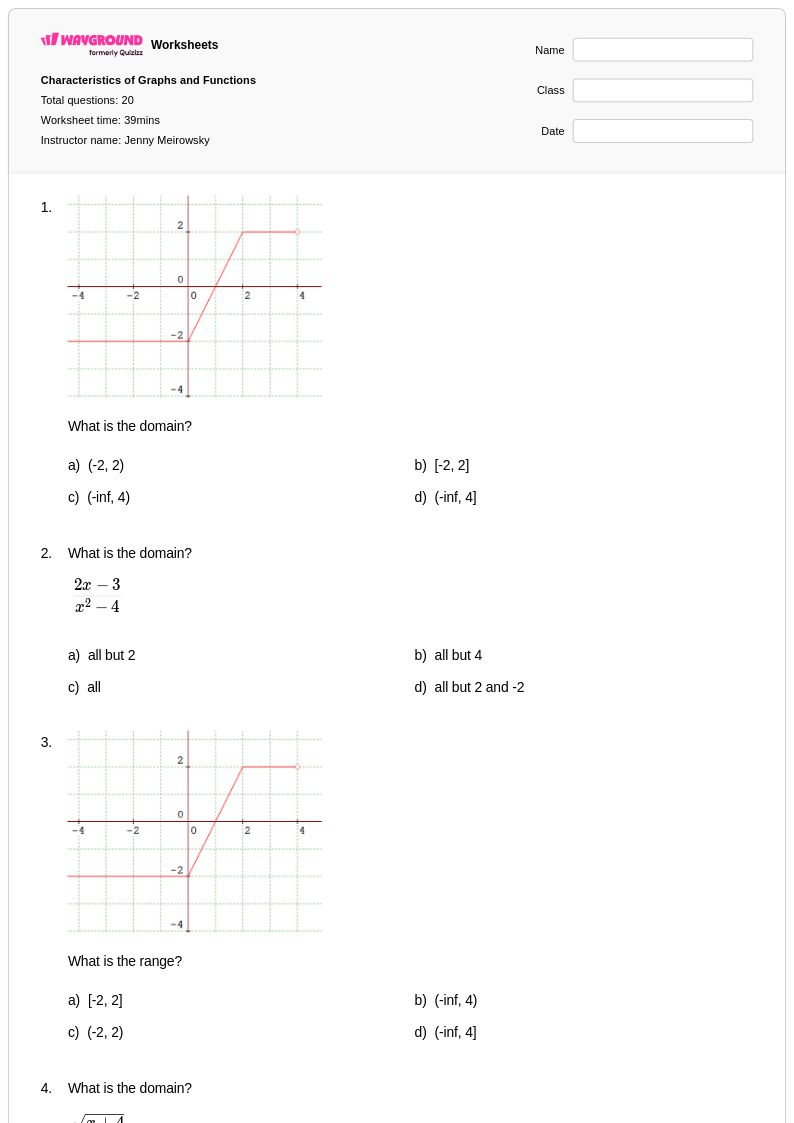
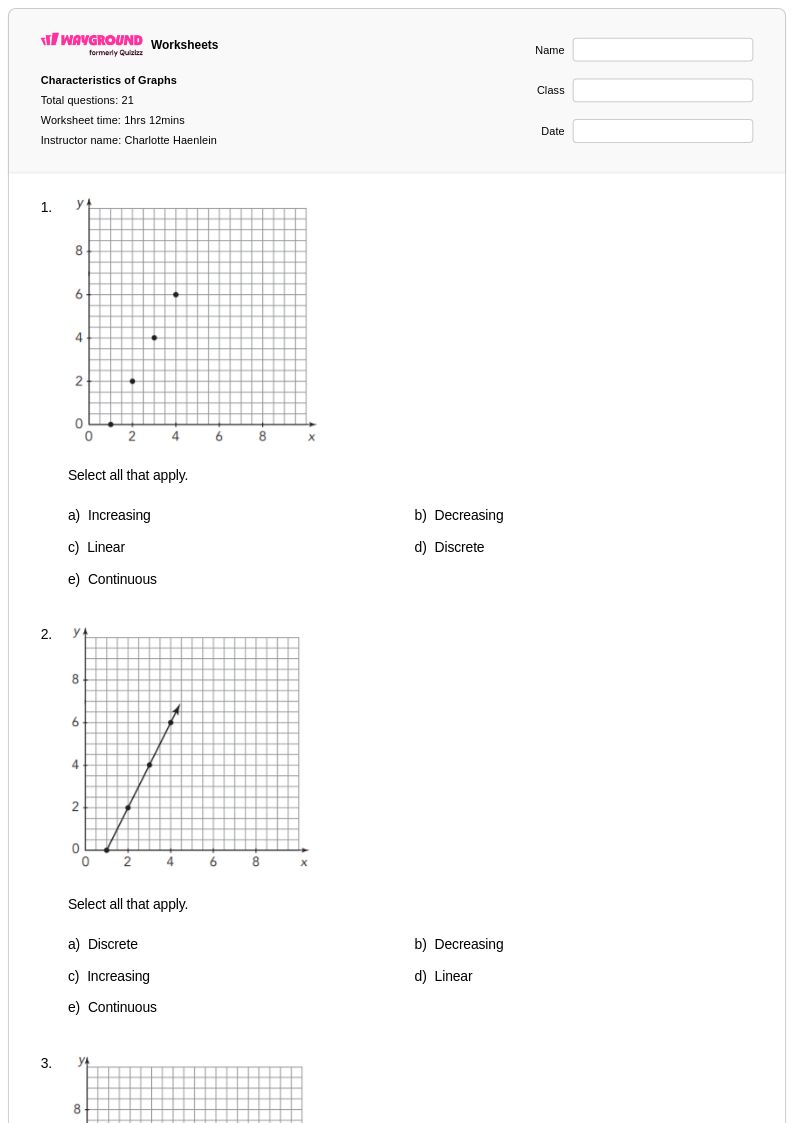
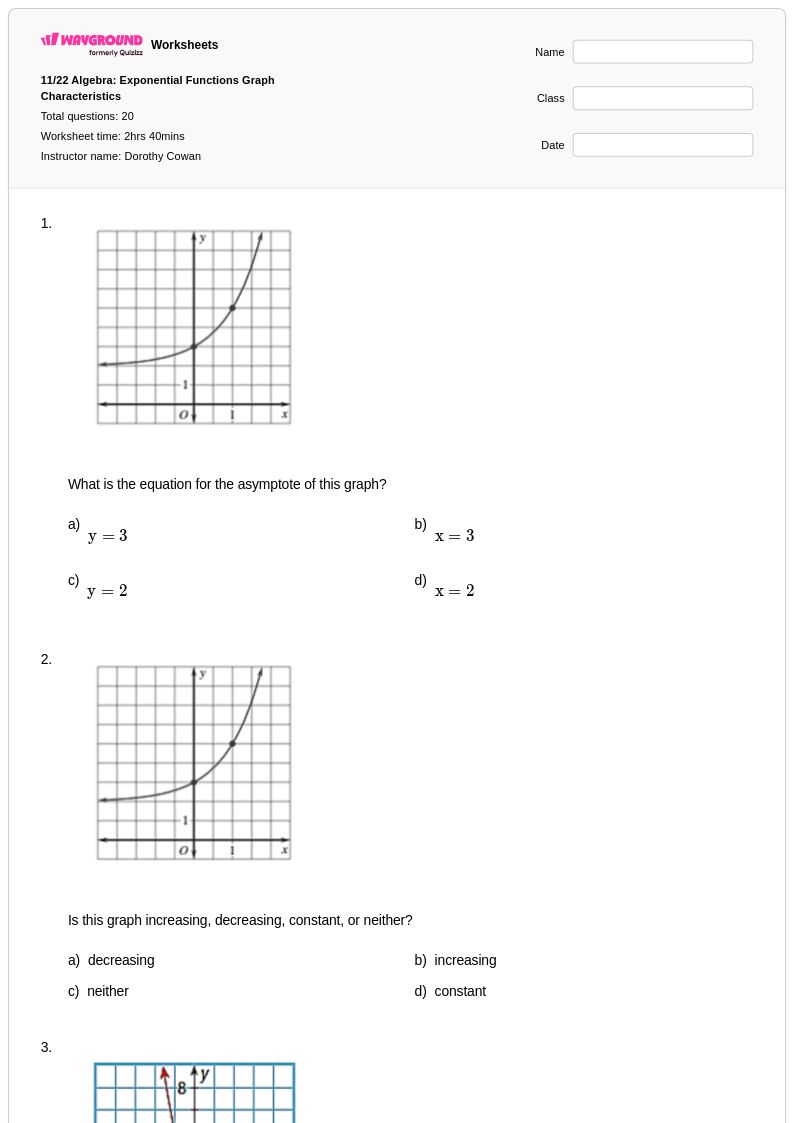
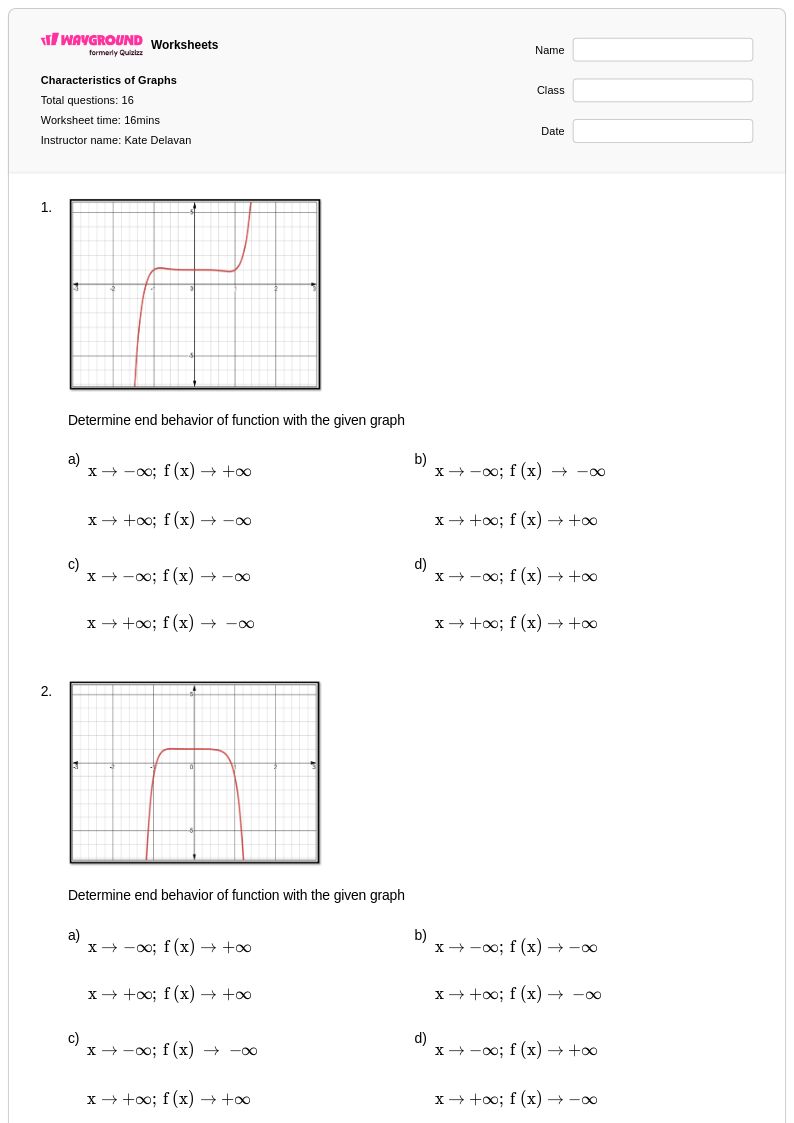
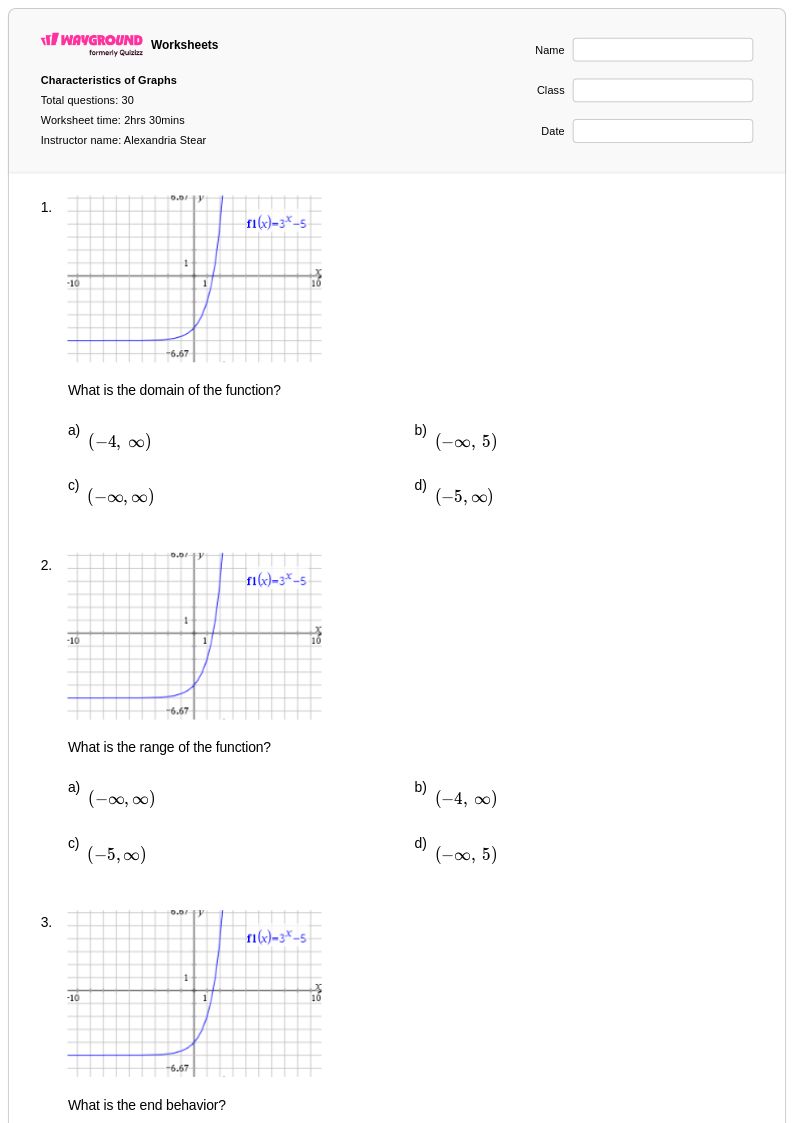
Explore printable Characteristics of Graphs worksheets
Characteristics of graphs worksheets available through Wayground (formerly Quizizz) provide comprehensive practice opportunities for students to analyze and interpret the fundamental properties that define different types of visual data representations. These educational resources focus on developing critical mathematical literacy skills including identifying key features such as axes labels, scales, trends, patterns, intercepts, maximum and minimum values, and overall data distribution across various graph types including bar graphs, line graphs, histograms, and scatter plots. The worksheets strengthen students' ability to extract meaningful information from graphical displays while building foundational skills in data interpretation that are essential for advanced mathematical concepts. Each resource includes detailed practice problems with corresponding answer keys, and the materials are available as free printable pdf downloads that can be easily integrated into classroom instruction or assigned for independent study.
Wayground (formerly Quizizz) supports mathematics educators with an extensive collection of teacher-created resources specifically designed to enhance instruction on graph characteristics, drawing from millions of professionally developed materials that undergo rigorous quality review processes. The platform's advanced search and filtering capabilities allow teachers to quickly locate worksheets that align with specific curriculum standards and learning objectives, while built-in differentiation tools enable customization for diverse student needs and ability levels. These resources are available in both printable and digital formats, including downloadable pdf versions that facilitate flexible implementation across various teaching environments. Teachers can leverage these comprehensive materials for targeted skill practice, diagnostic assessment, remediation support, and enrichment activities, ensuring that students develop robust analytical skills necessary for interpreting graphical data representations across multiple mathematical contexts and real-world applications.