Free Printable Graphing Real World Applications worksheets
Enhance students' understanding of graphing real world applications with Wayground's comprehensive collection of free worksheets, printables, and practice problems that connect mathematical data visualization to everyday scenarios, complete with detailed answer keys.
Explore printable Graphing Real World Applications worksheets
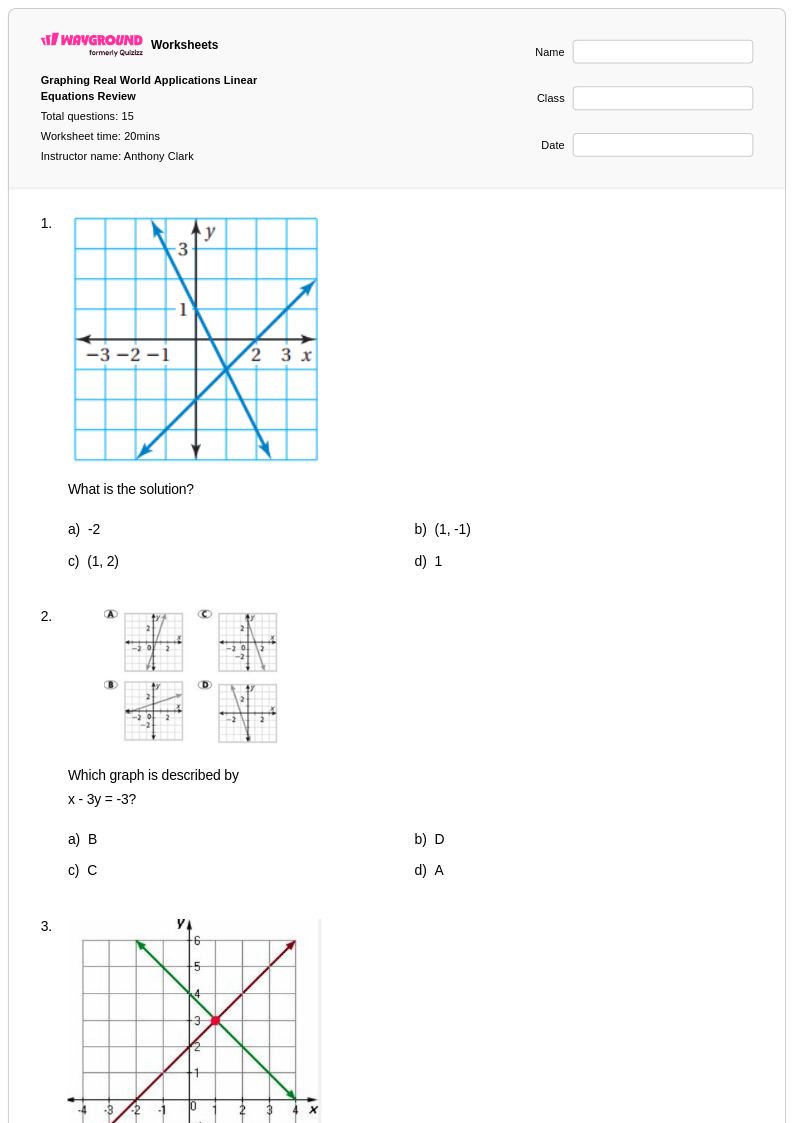
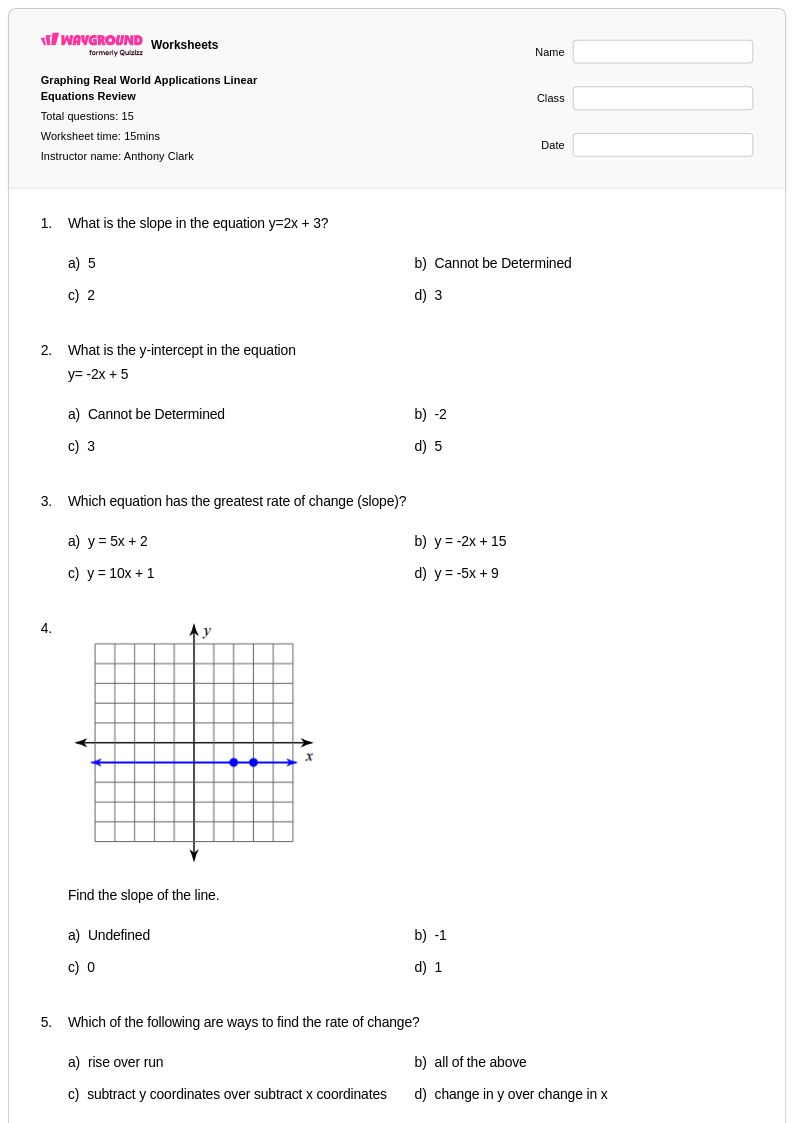
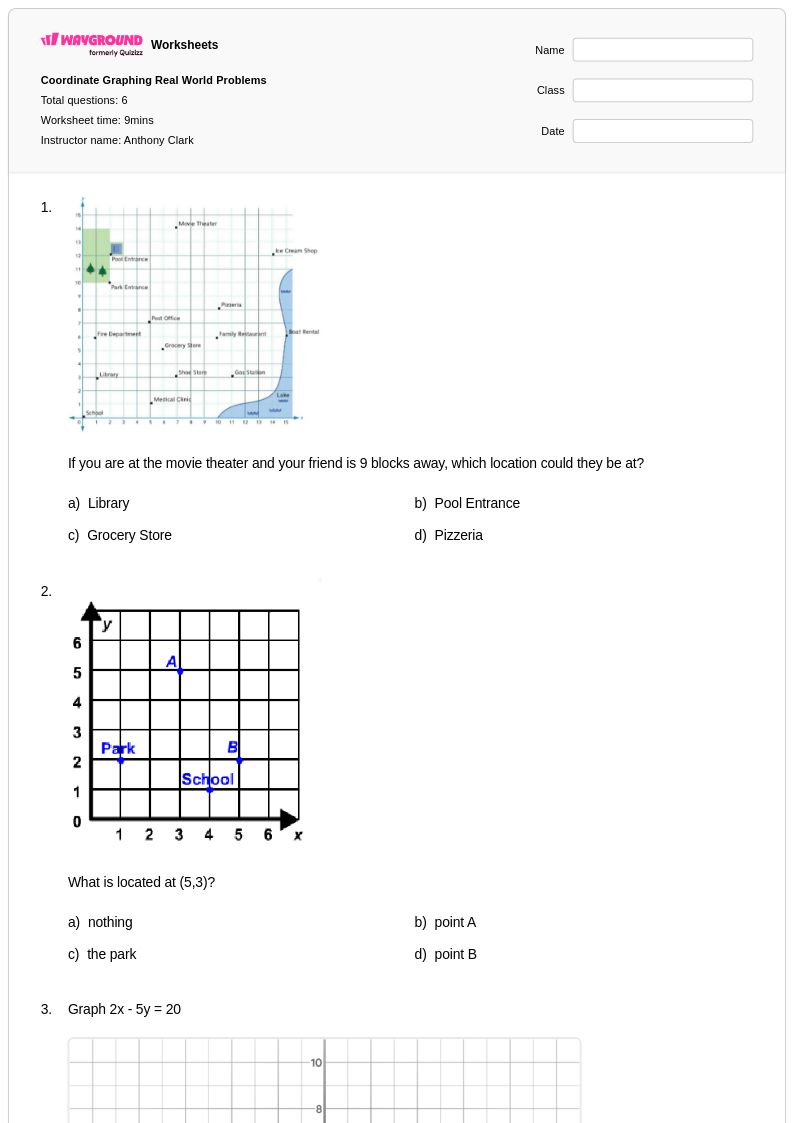
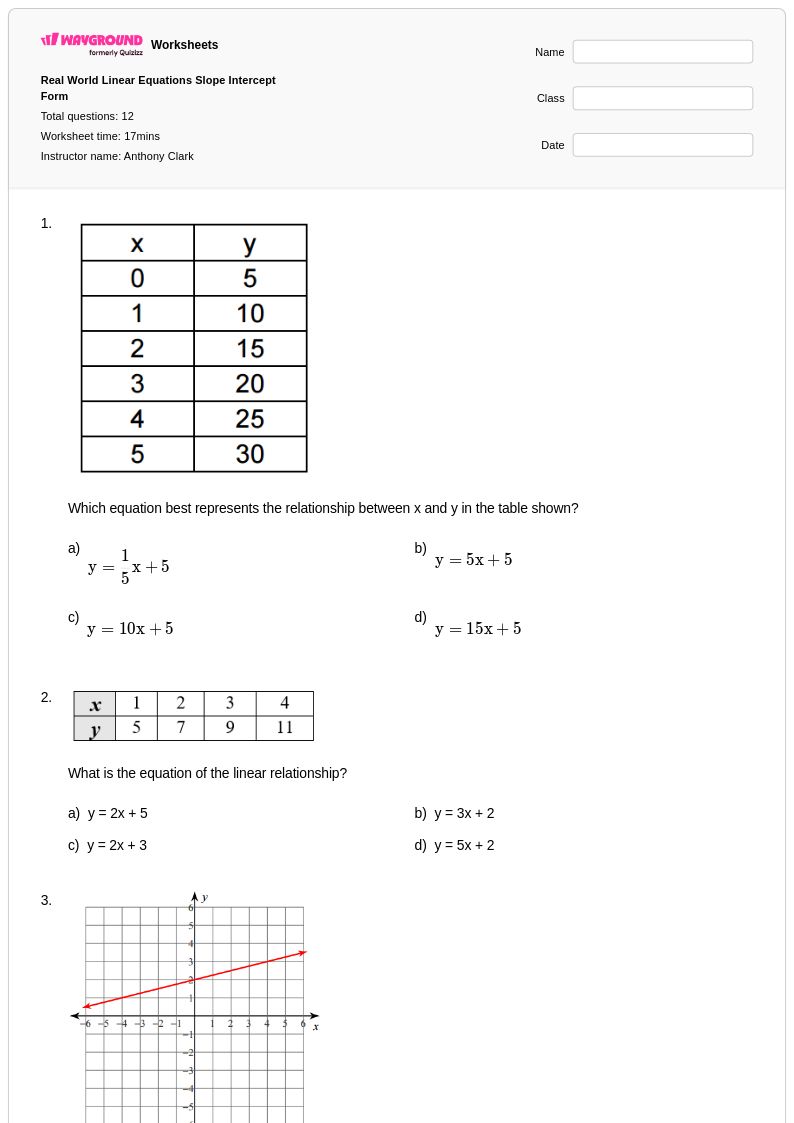
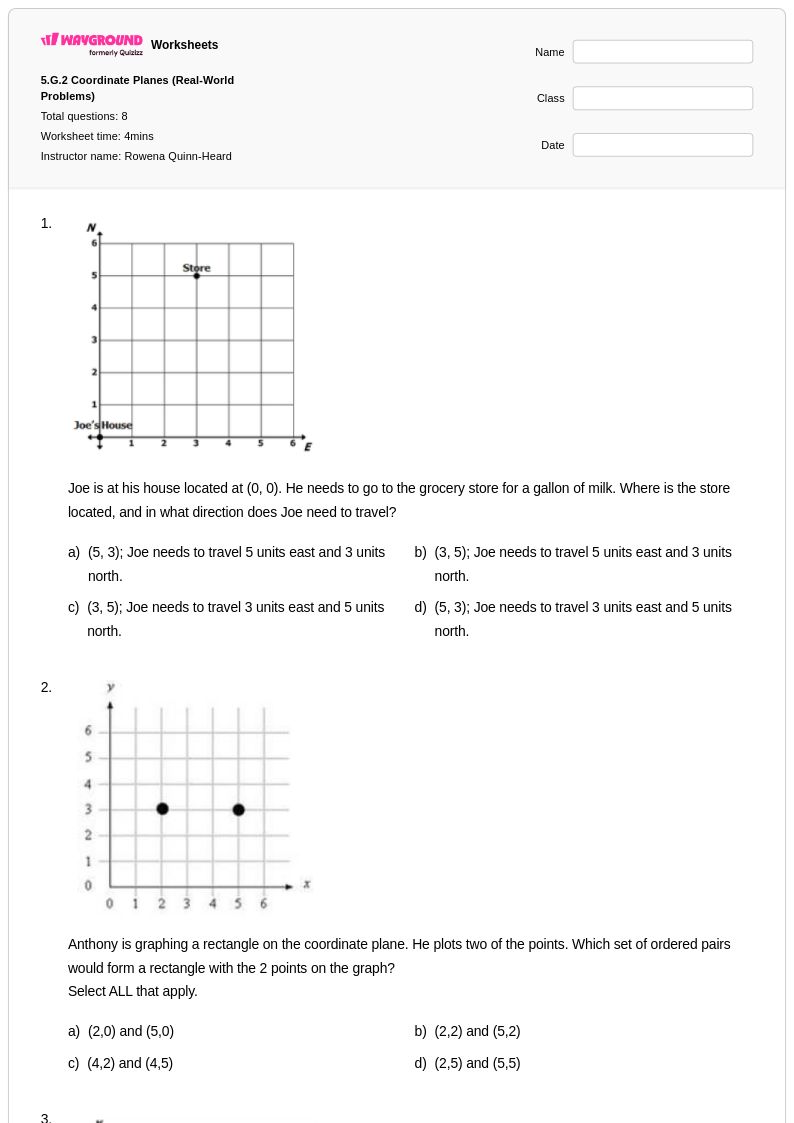
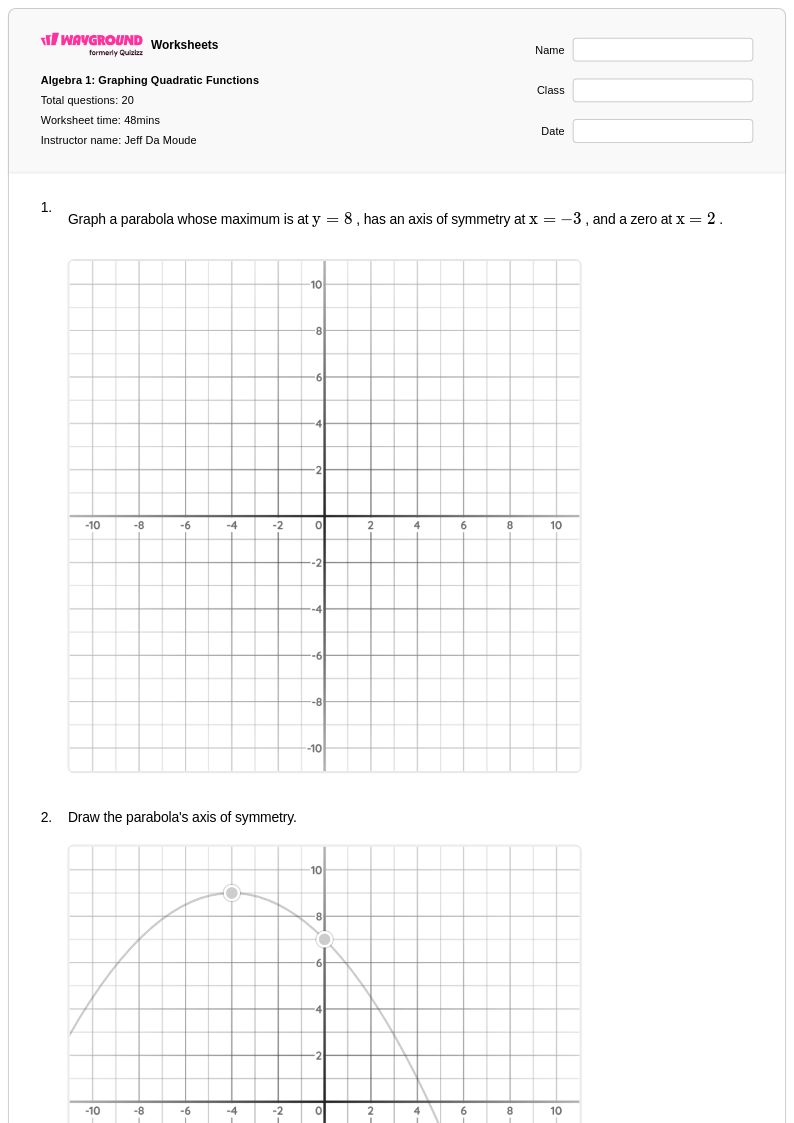
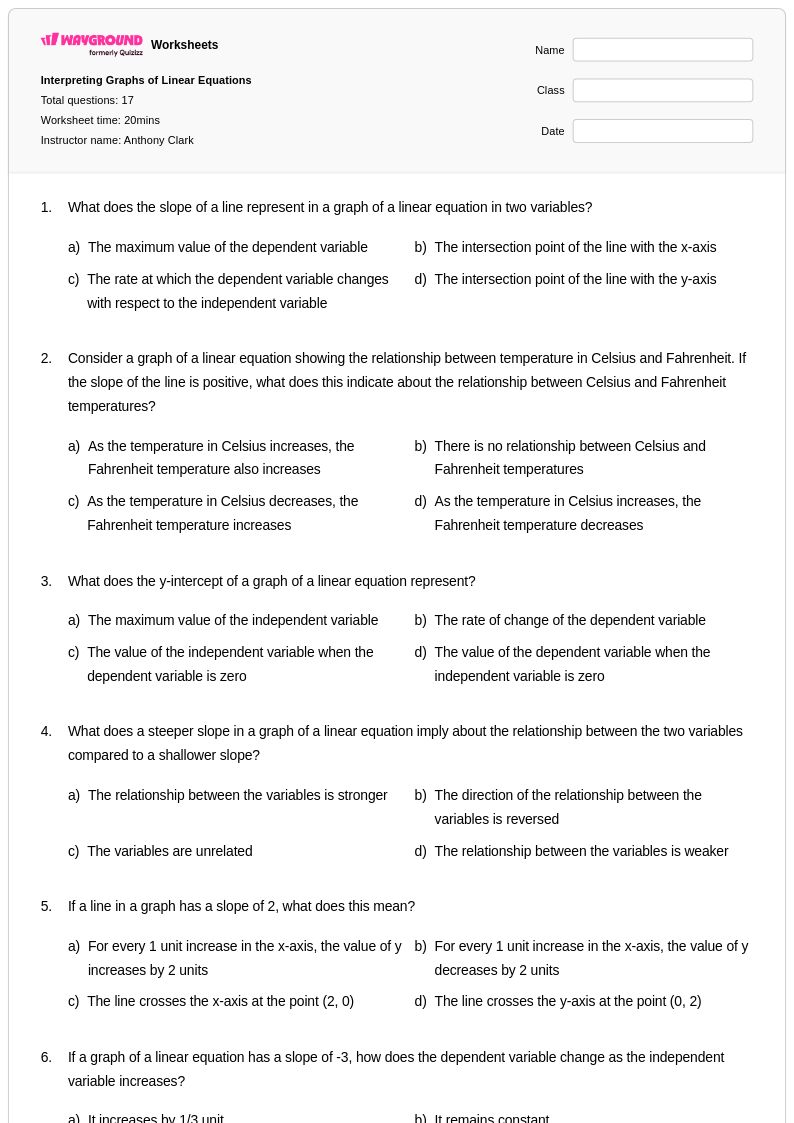
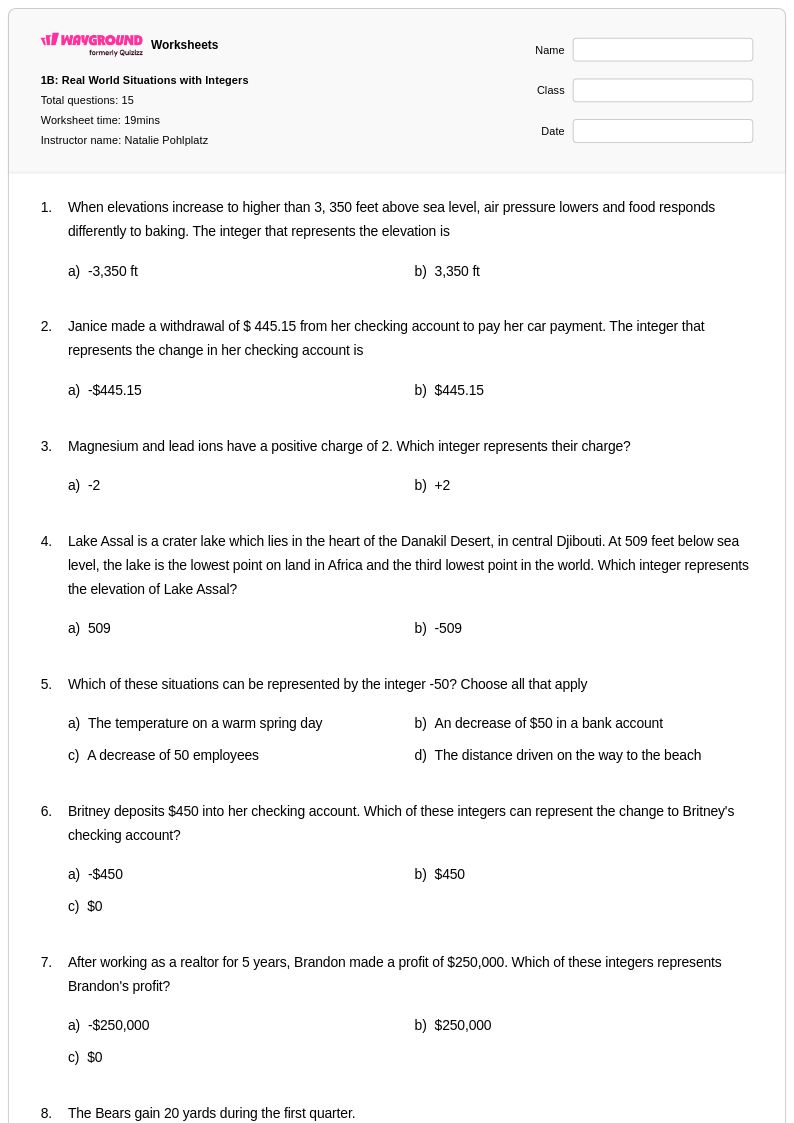
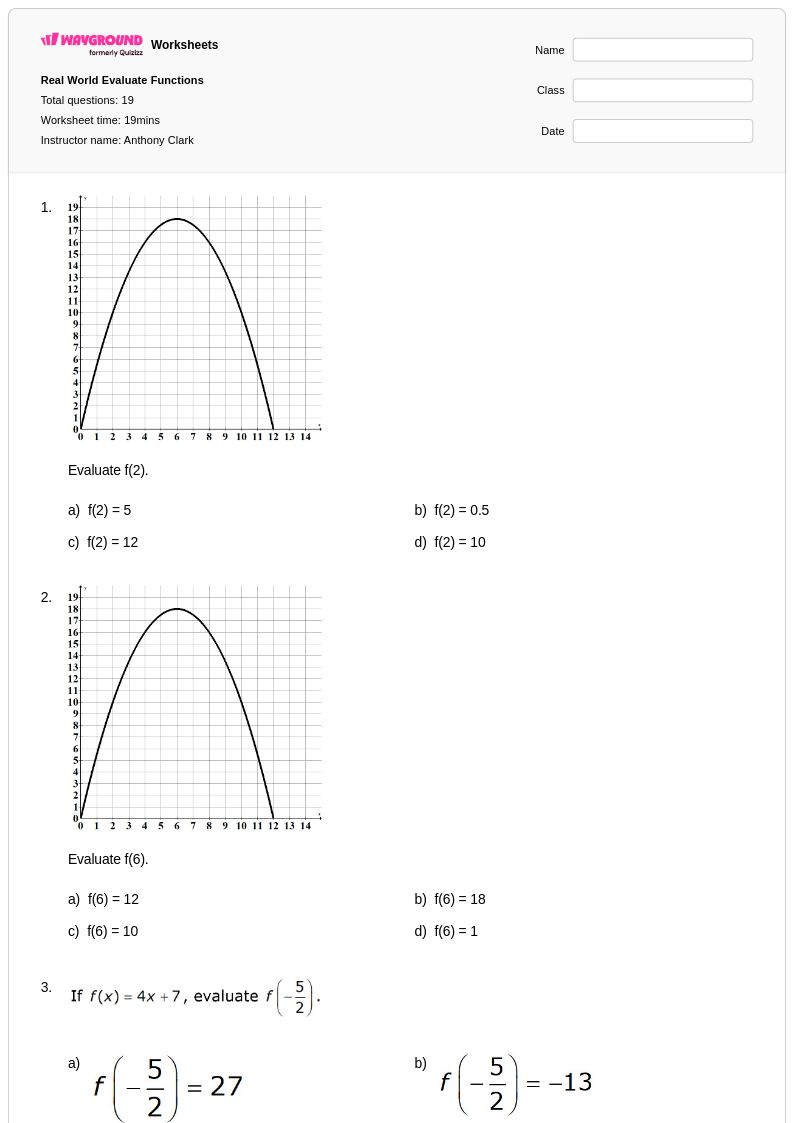
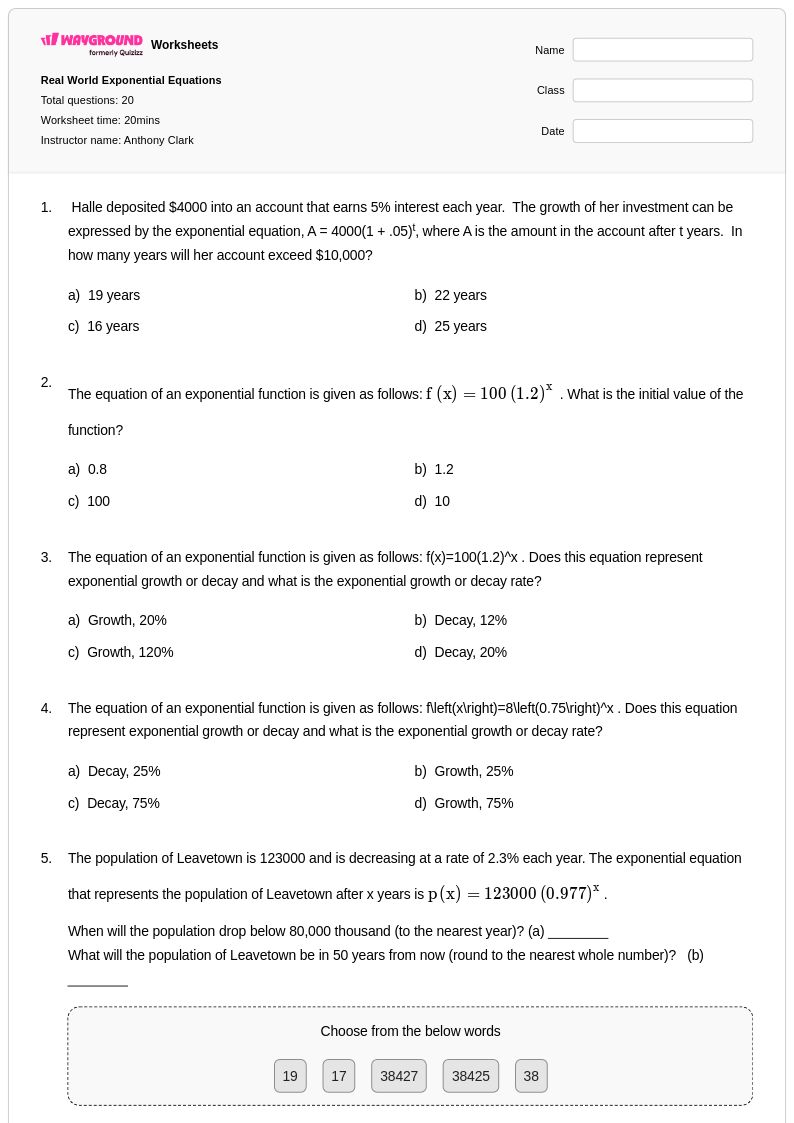
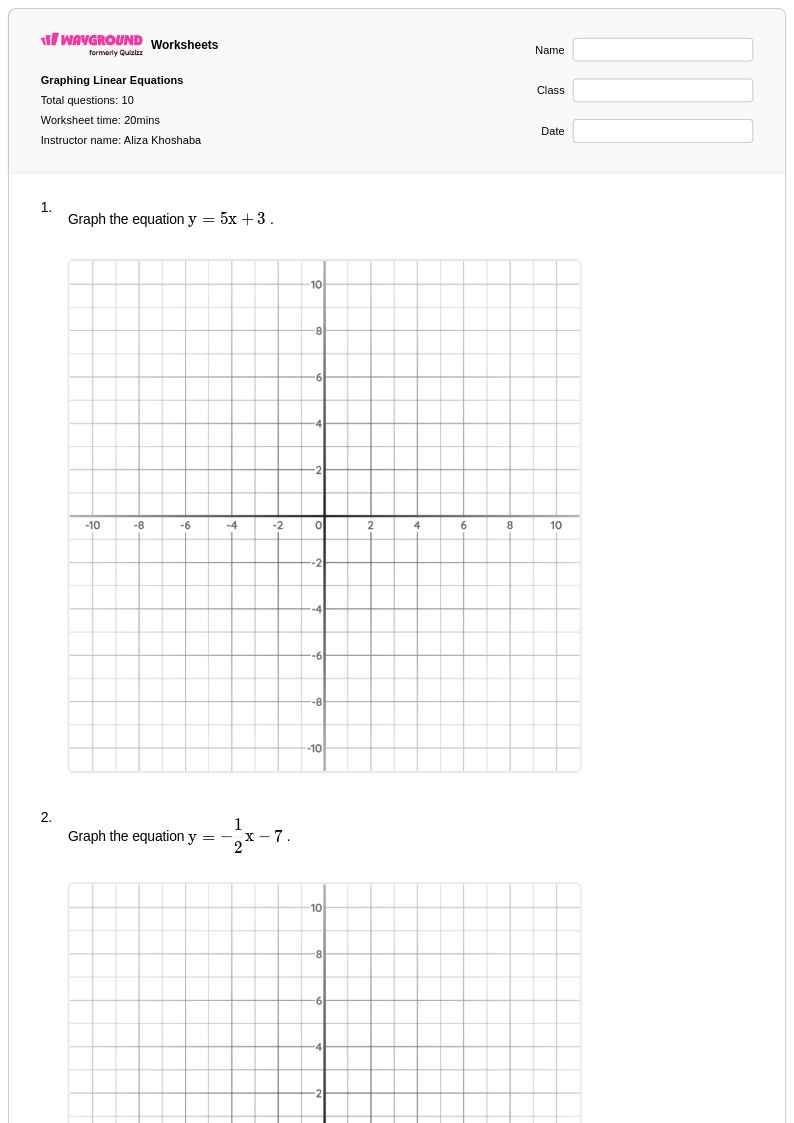
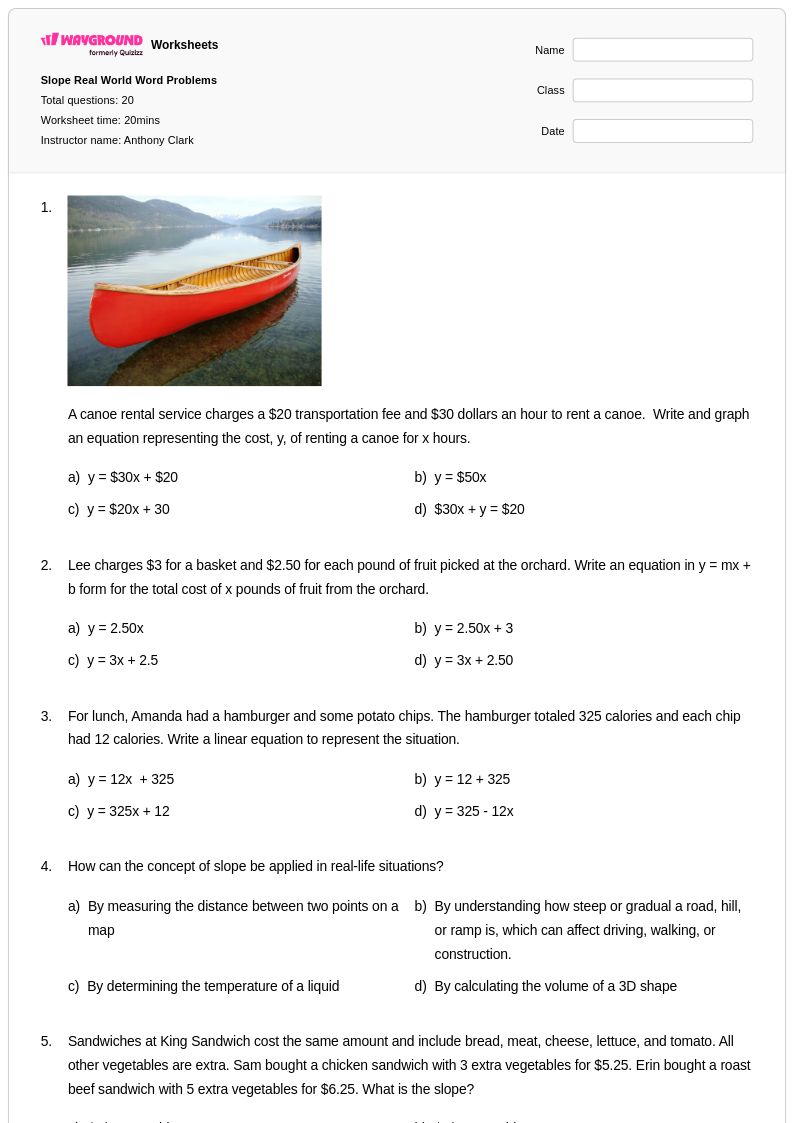
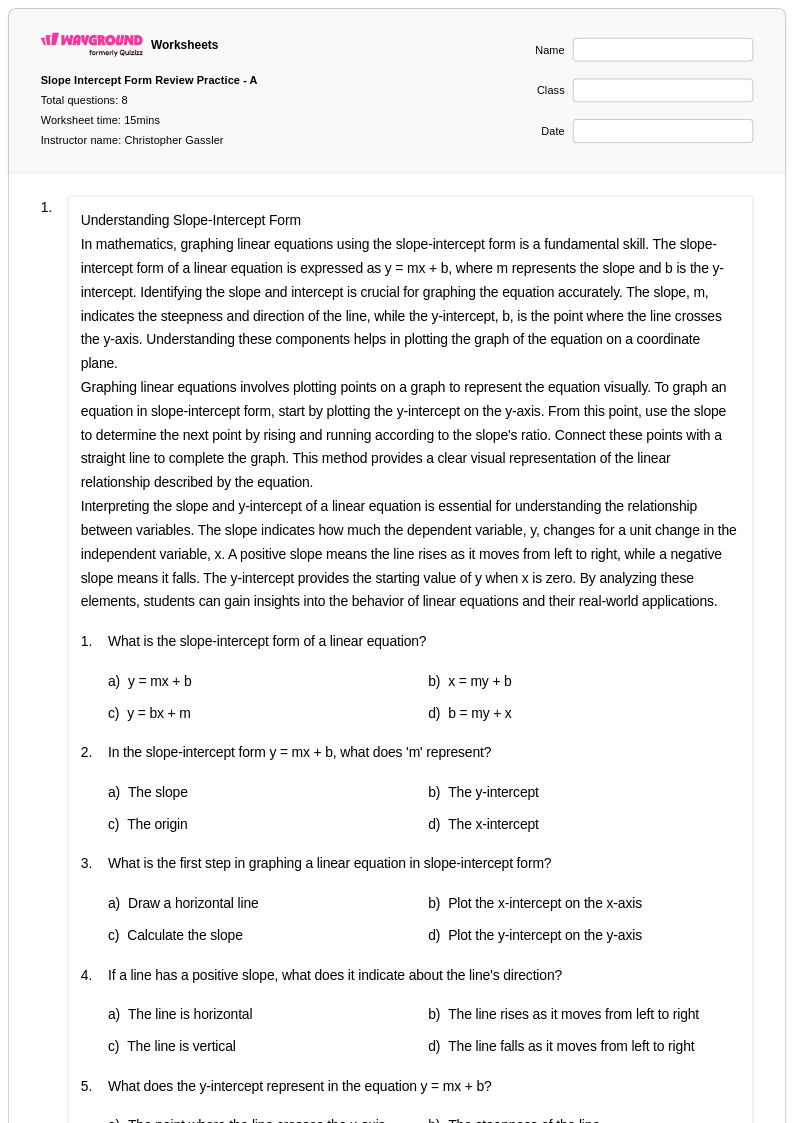
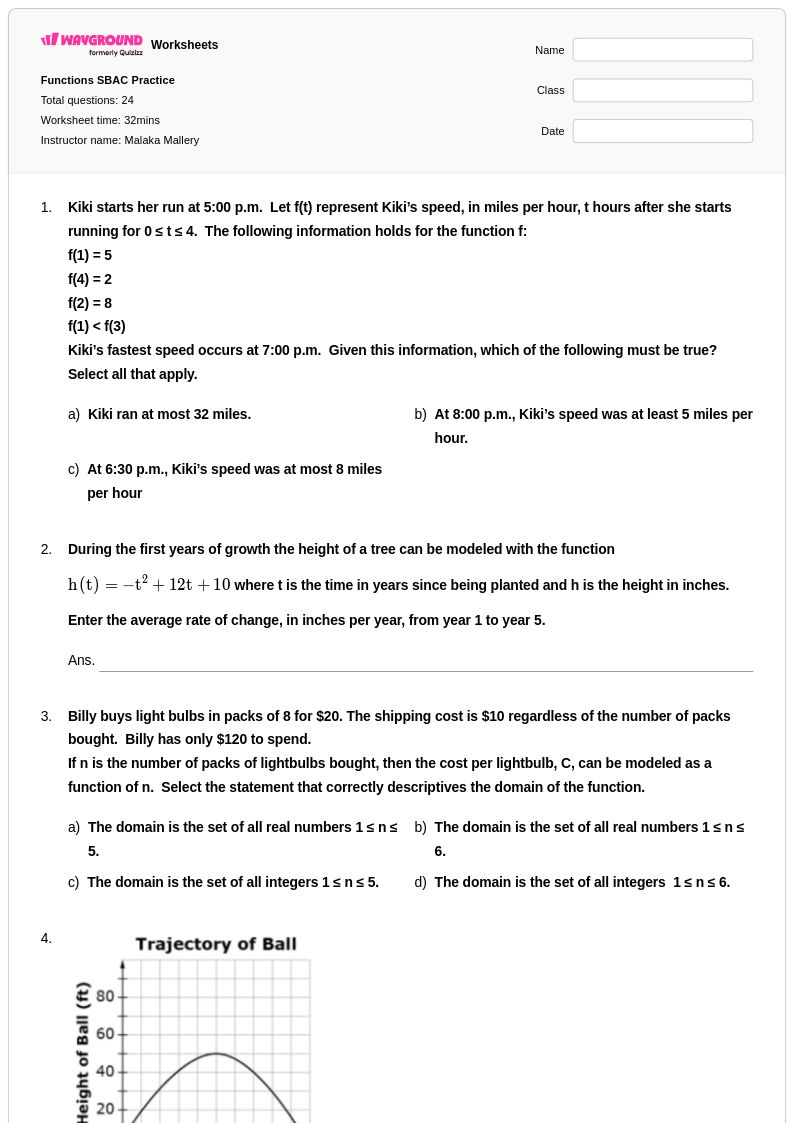
Graphing real world applications worksheets available through Wayground (formerly Quizizz) provide students with essential practice connecting mathematical concepts to practical, everyday scenarios. These comprehensive worksheets strengthen critical analytical skills by challenging students to interpret data sets, create various graph types, and draw meaningful conclusions from visual representations of real-world information such as population trends, weather patterns, business profits, and scientific measurements. Each worksheet collection includes detailed answer keys and offers free printable pdf formats, ensuring educators have immediate access to both practice problems and solutions that reinforce students' ability to translate abstract mathematical concepts into tangible, relatable contexts that demonstrate the practical value of data analysis skills.
Wayground (formerly Quizizz) supports mathematics educators with an extensive library of millions of teacher-created graphing resources that feature robust search and filtering capabilities, enabling quick identification of materials perfectly aligned to curriculum standards and specific learning objectives. The platform's differentiation tools allow teachers to customize worksheets for diverse learning needs, while flexible formatting options provide both printable pdf versions and interactive digital alternatives that accommodate various classroom environments and teaching preferences. These comprehensive features streamline lesson planning by offering ready-to-use materials for skill practice, targeted remediation for struggling students, and enrichment opportunities for advanced learners, ultimately empowering educators to deliver engaging, standards-aligned instruction that helps students master the essential skill of applying graphing techniques to analyze and interpret real-world data scenarios.
FAQs
How can I teach graphing in a way that feels relevant to students?
Connect graphing to students' interests and daily experiences. Use data sets based on topics like sports statistics, social media trends, or local weather patterns. The goal is to show that graphing is a tool for understanding the world, not just an abstract math exercise. Start with a question the data can answer, such as "Which month is the rainiest?" or "How has the price of a video game changed over time?"
What types of real-world scenarios are best for graphing practice?
Effective scenarios involve clear relationships between variables. Good examples include tracking plant growth over time (line graph), comparing the populations of different cities (bar graph), or showing the relationship between hours studied and test scores (scatter plot). These worksheets use data from business, science, and social studies to provide varied and engaging practice.
What are common mistakes students make when graphing real-world data?
Students often struggle with three key areas: choosing the appropriate graph type for the data, labeling axes correctly with units (e.g., "Dollars" vs. just "Money"), and interpreting the graph's meaning instead of just describing its shape. For example, they might say "the line goes up" instead of "the company's profit increased over time."
How do I use these graphing worksheets with my class?
Wayground worksheets are flexible for any classroom. You can assign them as an interactive digital activity on the Wayground platform or download them as printable PDFs for offline practice. Every worksheet includes a complete answer key, and for paper assignments, you can use the Wayground for Teachers app to quickly scan and grade student work.
How does graphing real-world data fit into the math curriculum?
Aligned with Common Core's focus on Statistics & Probability, this skill progresses from creating simple picture and bar graphs in elementary grades to analyzing linear and non-linear functions in middle and high school. These worksheets help bridge the gap by asking students to not just plot points but to model and interpret relationships, a key step toward more advanced algebraic thinking.
How can I support struggling students with these graphing activities?
For students who need support, you can use Wayground's tools to differentiate. Create a scaffolded version of the worksheet by increasing the font size or applying a dyslexia-friendly font. For digital assignments, you can enable the Read Aloud feature to help with word problems or reduce the number of answer choices on multiple-choice questions to lower cognitive load.