
10 Q
12th
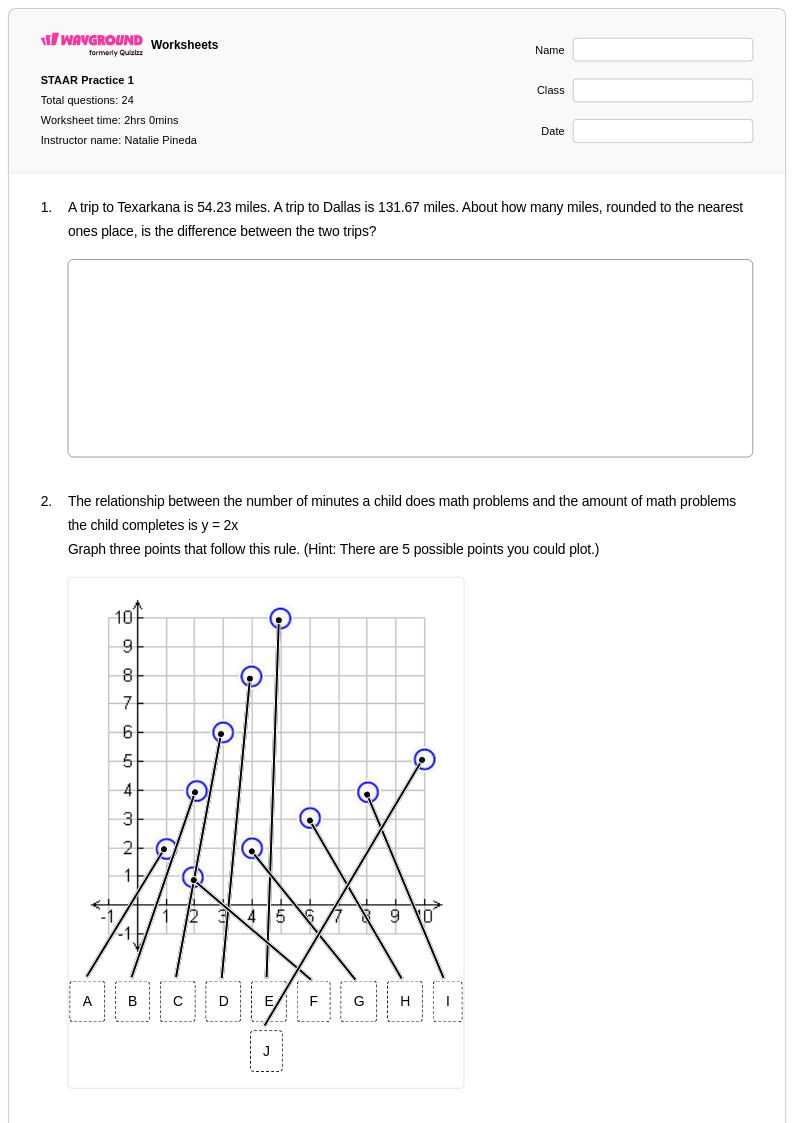
10 Q
6th - 8th
12 Q
9th
19 Q
7th
15 Q
KG
18 Q
7th
10 Q
8th
10 Q
8th
16 Q
9th
10 Q
8th
8 Q
6th
23 Q
6th
12 Q
12th
21 Q
8th
10 Q
8th
15 Q
7th
24 Q
5th
13 Q
8th
11 Q
7th
14 Q
6th - 8th
20 Q
6th - 8th
15 Q
8th
45 Q
6th
15 Q
6th
Explore Worksheets by Subjects
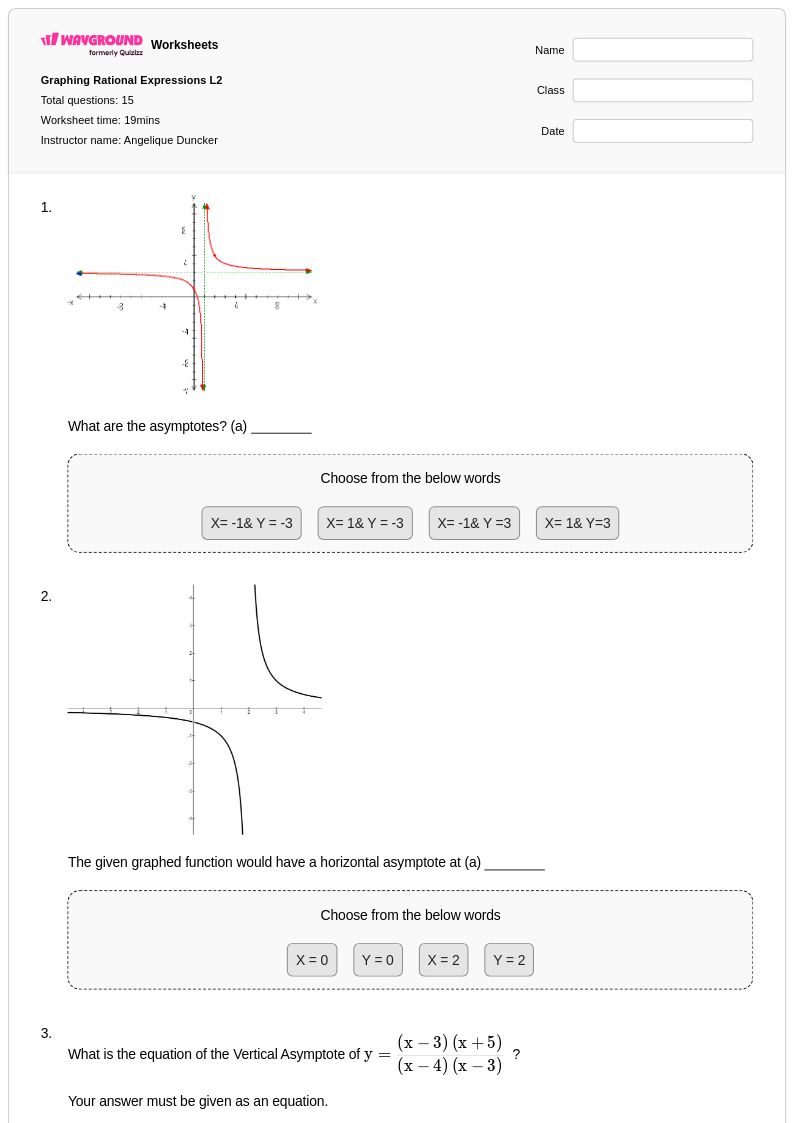
Explore printable Graphing Exchange Rates worksheets
Graphing exchange rates worksheets available through Wayground (formerly Quizizz) provide students with essential practice in interpreting and creating visual representations of currency fluctuations over time. These comprehensive resources strengthen critical mathematical skills including reading coordinate graphs, analyzing trends in data sets, calculating percentage changes, and making predictions based on graphical information. Students work with real-world economic data to construct line graphs, bar charts, and scatter plots that illustrate how different currencies perform against each other across various time periods. Each worksheet comes with a complete answer key and is available as a free printable pdf, featuring practice problems that range from basic graph interpretation to complex multi-currency comparisons that require students to synthesize information from multiple data sources.
Wayground (formerly Quizizz) empowers educators with access to millions of teacher-created graphing exchange rates resources that can be easily searched, filtered, and customized to meet diverse classroom needs. The platform's robust collection includes materials aligned with mathematical standards for data analysis and graphing, offering differentiation tools that allow teachers to modify complexity levels for remediation or enrichment purposes. These versatile worksheets are available in both printable and digital formats, including downloadable pdf versions, making them ideal for traditional classroom instruction, homework assignments, or remote learning environments. Teachers can seamlessly integrate these resources into their lesson planning to provide targeted skill practice, assess student understanding of graphical data interpretation, and help students develop the quantitative literacy skills necessary for understanding global economic concepts through mathematical analysis.