
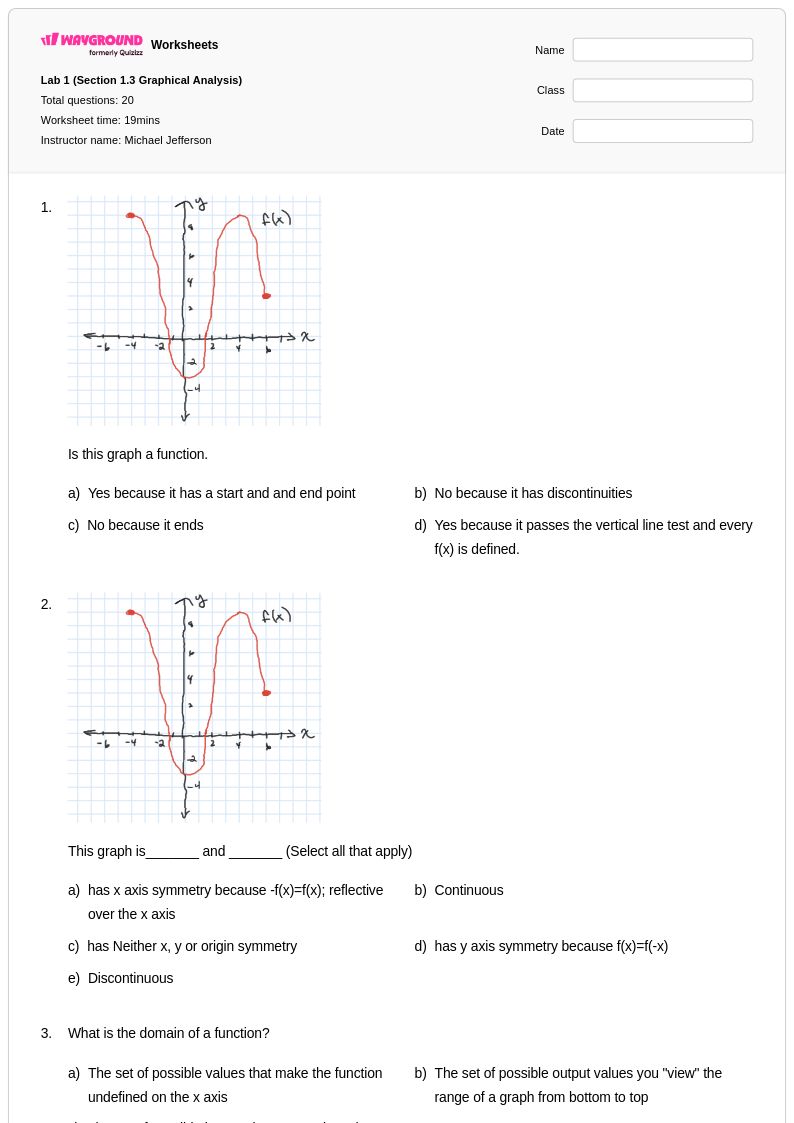
20 Q
Uni
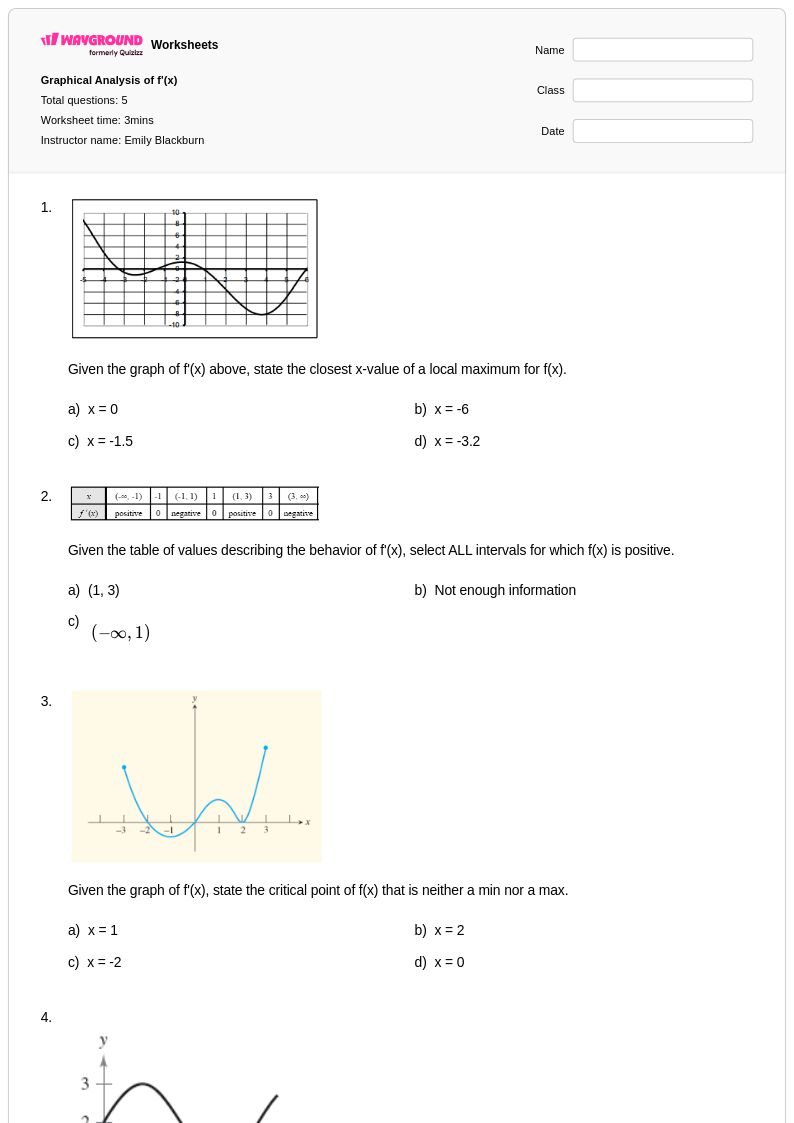
5 Q
10th - 12th
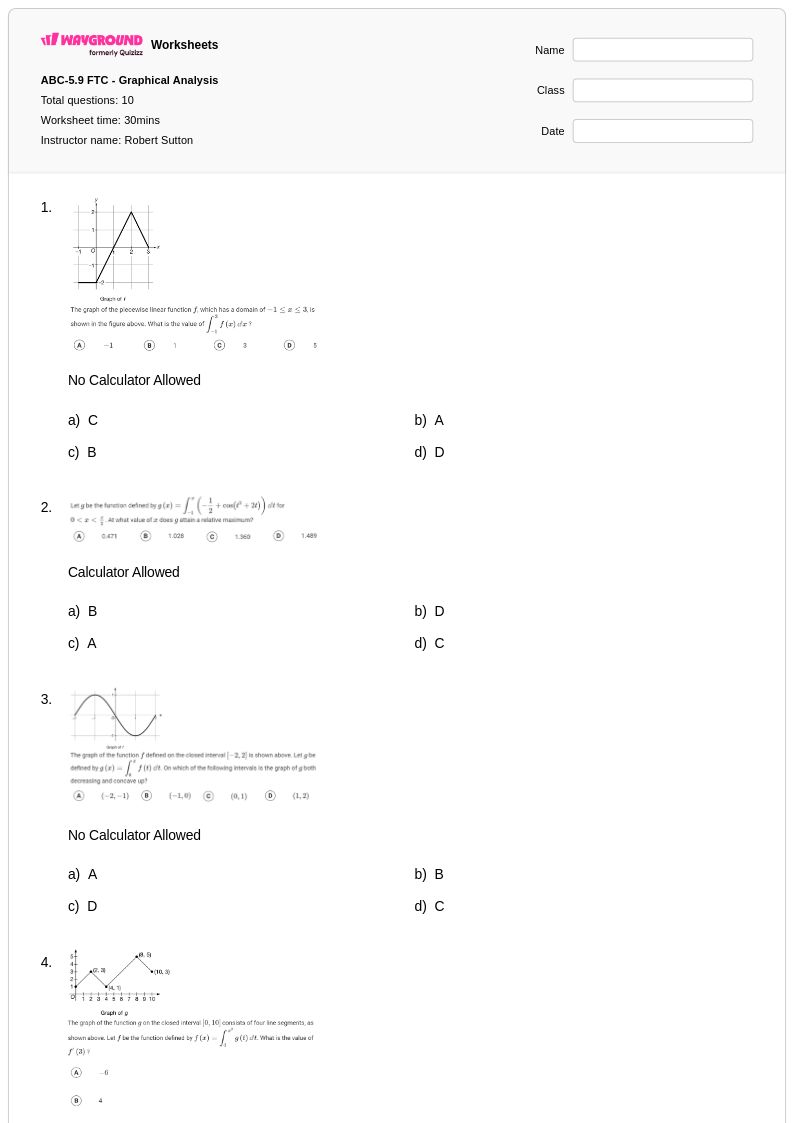
10 Q
9th - 12th
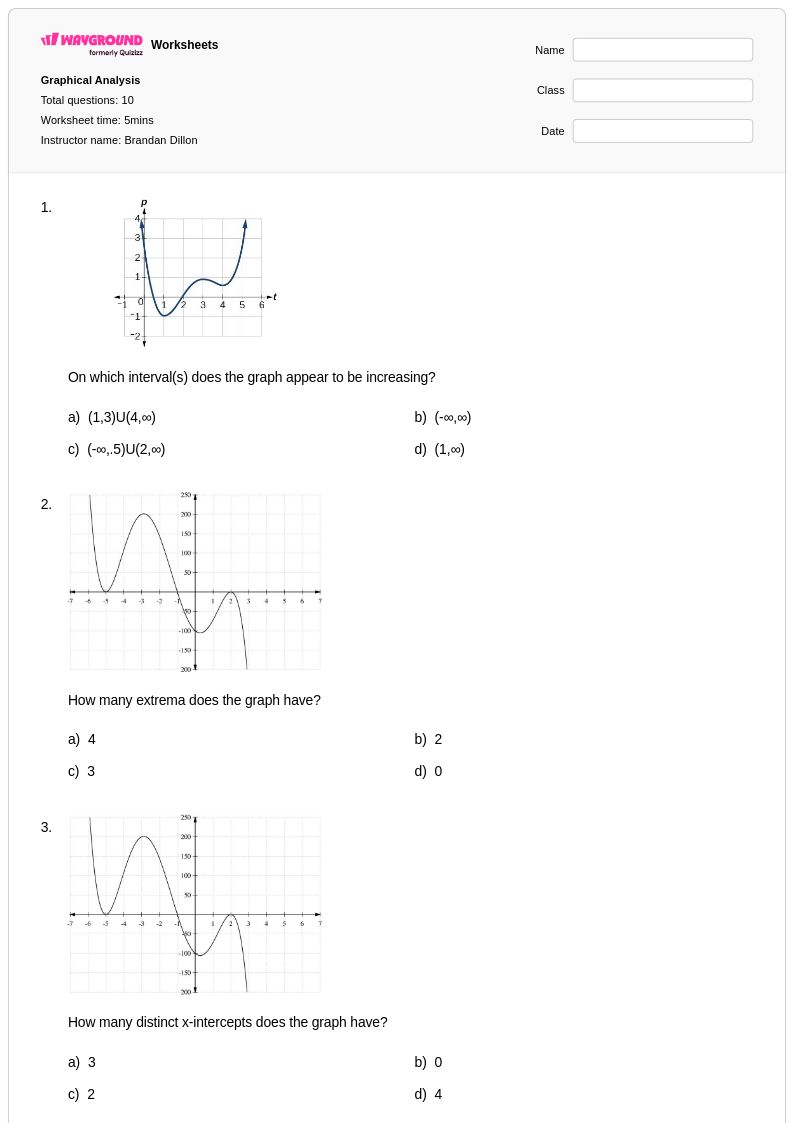
10 Q
12th
10 Q
12th
11 Q
12th
6 Q
12th
10 Q
10th - 12th
27 Q
11th - 12th
20 Q
12th
20 Q
11th - 12th
6 Q
8th
10 Q
9th - 12th
6 Q
12th
20 Q
8th - Uni
20 Q
7th - Uni
9 Q
9th
20 Q
12th - Uni
20 Q
9th
21 Q
5th
10 Q
5th

17 Q
8th
10 Q
3rd
31 Q
12th
Explore Worksheets by Subjects
Explore printable Graphical Analysis worksheets
Graphical analysis worksheets available through Wayground (formerly Quizizz) provide comprehensive practice in interpreting, evaluating, and drawing conclusions from various types of data visualizations including bar graphs, line graphs, pie charts, scatter plots, and histograms. These educational resources strengthen critical mathematical skills such as reading data points accurately, identifying trends and patterns, comparing datasets, calculating measures of central tendency from graphical representations, and making predictions based on visual data. The collection includes practice problems that progress from basic graph reading to complex multi-step analysis tasks, with each worksheet featuring a complete answer key and available as free printable PDFs that educators can seamlessly integrate into their mathematics curriculum.
Wayground (formerly Quizizz) supports mathematics teachers with an extensive library of millions of teacher-created graphical analysis resources that can be easily searched and filtered by specific skill focus, complexity level, and instructional objective. The platform's robust standards alignment ensures that worksheets correspond to curriculum requirements, while built-in differentiation tools allow educators to customize practice problems for diverse learning needs and mathematical abilities. Teachers can access these materials in both printable PDF format for traditional paper-based instruction and digital formats for technology-enhanced learning environments, making them invaluable for lesson planning, targeted remediation of data interpretation weaknesses, enrichment activities for advanced learners, and systematic skill practice that builds confidence in analyzing graphical information across various mathematical contexts.