
13 Q
3rd
16 Q
3rd
28 Q
3rd
15 Q
4th
14 Q
6th
20 Q
9th - 12th
34 Q
3rd
27 Q
3rd
20 Q
9th
10 Q
3rd

33 Q
3rd
8 Q
3rd
12 Q
3rd
10 Q
7th
10 Q
7th
12 Q
KG - 1st
13 Q
3rd
21 Q
6th
20 Q
7th - Uni
12 Q
3rd
10 Q
7th
21 Q
3rd
10 Q
3rd
8 Q
7th
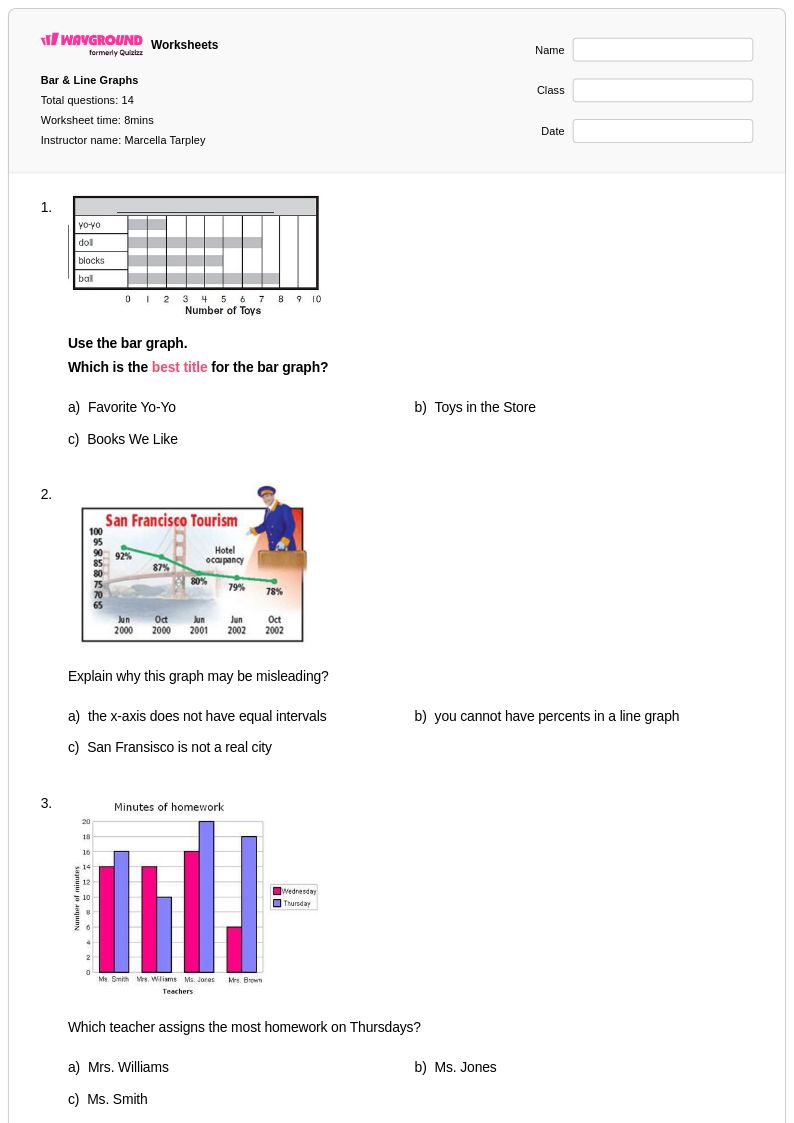
Explore Worksheets by Subjects
Explore printable Scaled Bar Graphs worksheets
Scaled bar graphs represent a fundamental component of data visualization that enables students to interpret and analyze information presented in graphical format with intervals other than one-to-one correspondence. Wayground's comprehensive collection of scaled bar graph worksheets provides structured practice opportunities that develop critical mathematical reasoning skills, including reading graph scales, interpreting data relationships, and drawing conclusions from visual information. These expertly designed resources strengthen students' ability to work with various scale increments, understand proportional relationships, and make accurate data comparisons. Each worksheet includes detailed answer keys and is available as free printable pdf downloads, ensuring educators have access to high-quality practice problems that reinforce essential graphing concepts through systematic skill development.
Wayground, formerly Quizizz, empowers educators with millions of teacher-created scaled bar graph resources that support diverse instructional needs and learning objectives. The platform's robust search and filtering capabilities allow teachers to quickly locate worksheets aligned with specific mathematical standards while accessing differentiation tools that accommodate various skill levels within the classroom. These customizable materials are available in both printable and digital formats, including downloadable pdf versions, providing flexibility for traditional classroom instruction, remote learning environments, and hybrid educational models. Teachers can seamlessly integrate these resources into lesson planning, targeted remediation sessions, enrichment activities, and independent skill practice, ensuring students develop confident proficiency in interpreting and analyzing scaled graphical data across multiple mathematical contexts.