
10 Q
5th
6 Q
5th - Uni
20 Q
5th
15 Q
5th
10 Q
5th
20 Q
5th - 10th
36 Q
5th - 7th
20 Q
3rd - 5th
10 Q
5th - 6th
20 Q
4th - 5th
15 Q
5th
20 Q
3rd - 5th
10 Q
4th - 5th
13 Q
3rd - 5th
42 Q
5th - 9th
10 Q
4th - 5th
20 Q
5th
20 Q
4th - 5th
19 Q
3rd - 5th
10 Q
4th - 5th
25 Q
5th - 7th
25 Q
5th
6 Q
4th - 5th
37 Q
5th
Explore Interpreting Graphs Worksheets by Grades
Explore Other Subject Worksheets for grade 5
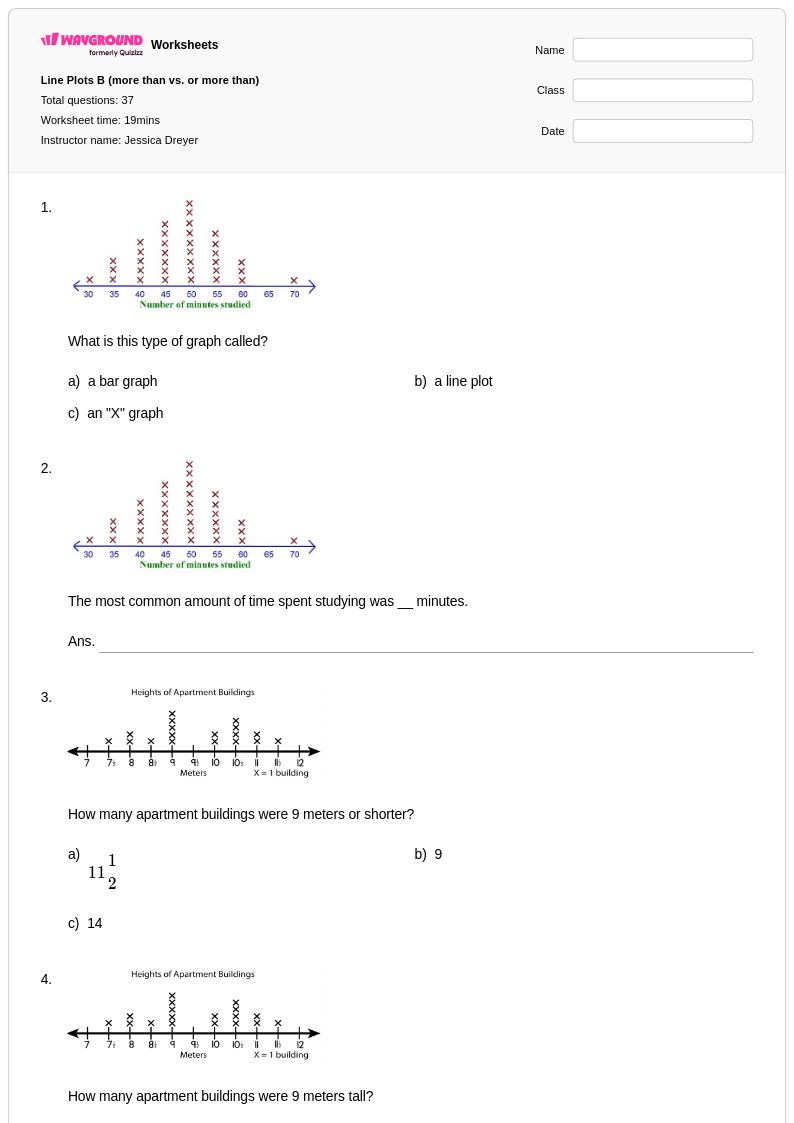
Explore printable Interpreting Graphs worksheets for Grade 5
Interpreting graphs worksheets for Grade 5 students available through Wayground (formerly Quizizz) provide comprehensive practice in analyzing and understanding various types of data representations including bar graphs, line graphs, pictographs, and simple circle graphs. These carefully designed printables strengthen essential mathematical literacy skills by teaching students to extract meaningful information from visual data displays, identify trends and patterns, compare data sets, and draw logical conclusions based on graphical evidence. Each worksheet collection includes detailed answer keys and offers free access to practice problems that progressively build students' confidence in reading scales, understanding graph components, and interpreting data relationships that form the foundation for more advanced statistical concepts in later grades.
Wayground (formerly Quizizz) supports educators with millions of teacher-created interpreting graphs resources that feature robust search and filtering capabilities, comprehensive standards alignment, and sophisticated differentiation tools to meet diverse classroom needs. Teachers can easily customize worksheet collections to target specific skill gaps, provide remediation for struggling learners, or offer enrichment opportunities for advanced students through flexible digital and printable PDF formats. The platform's extensive library enables efficient lesson planning by providing immediate access to high-quality practice materials that can be seamlessly integrated into daily instruction, homework assignments, or assessment preparation, ensuring students develop strong graph interpretation skills through consistent, targeted practice across multiple data representation formats.