6.2 Data Displays & Their Shape - Printable Shapes-of-distributions Worksheets Grade 12 - Quizizz
6.2 Data Displays & Their Shape

21 Q

9th - 12th

Stats: Review Chapter 4 - Univariate Distributions - Printable Shapes-of-distributions Worksheets Grade 12 - Quizizz
Stats: Review Chapter 4 - Univariate Distributions

24 Q

12th

Statistics of Frequency Distributions - Printable Shapes-of-distributions Worksheets Grade 12 - Quizizz
Statistics of Frequency Distributions

20 Q

11th - Uni

Skewed Distributions Dot Plots - Printable Shapes-of-distributions Worksheets Grade 12 - Quizizz
Skewed Distributions Dot Plots

19 Q

9th - Uni

Lesson 2.5--Normal Distributions--Review - Printable Shapes-of-distributions Worksheets Grade 12 - Quizizz
Lesson 2.5--Normal Distributions--Review

20 Q

12th

Comparing Distribution - Printable Shapes-of-distributions Worksheets Grade 12 - Quizizz
Comparing Distribution

20 Q

9th - 12th

Classify Shapes - Printable Shapes-of-distributions Worksheets Grade 12 - Quizizz
Classify Shapes

20 Q

5th - Uni

Normal Distribution Practice - Printable Shapes-of-distributions Worksheets Grade 12 - Quizizz
Normal Distribution Practice

14 Q

12th

Shape of Distribution of Box and Whisker Plot - Printable Shapes-of-distributions Worksheets Grade 12 - Quizizz
Shape of Distribution of Box and Whisker Plot

20 Q

6th - Uni

Statistical Inferences Quiz - Printable Shapes-of-distributions Worksheets Grade 12 - Quizizz
Statistical Inferences Quiz

15 Q

12th

Semester 2, Unit 6 Probability Distribution Review - Printable Shapes-of-distributions Worksheets Grade 12 - Quizizz
Semester 2, Unit 6 Probability Distribution Review

8 Q

9th - 12th

Data Display Dot Plots Bar Graphs Scatter Plots - Printable Shapes-of-distributions Worksheets Grade 12 - Quizizz
Data Display Dot Plots Bar Graphs Scatter Plots

20 Q

9th - Uni

Statistics & Probability: Analyzing One-Variable Data: Part 1 - Printable Shapes-of-distributions Worksheets Grade 12 - Quizizz
Statistics & Probability: Analyzing One-Variable Data: Part 1

35 Q

12th - Uni

Algebra Mean Median Skew - Printable Shapes-of-distributions Worksheets Grade 12 - Quizizz
Algebra Mean Median Skew

18 Q

9th - Uni

Box and Whisker Plots, Z-scores - Printable Shapes-of-distributions Worksheets Grade 12 - Quizizz
Box and Whisker Plots, Z-scores

20 Q

11th - 12th

Mean and Median Skew - Printable Shapes-of-distributions Worksheets Grade 12 - Quizizz
Mean and Median Skew

20 Q

10th - Uni

Intro to Sampling Distribution for Sample Means - Printable Shapes-of-distributions Worksheets Grade 12 - Quizizz
Intro to Sampling Distribution for Sample Means

8 Q

12th

Dilations of Shapes - Printable Shapes-of-distributions Worksheets Grade 12 - Quizizz
Dilations of Shapes

20 Q

8th - Uni

Decomposing 2D Shapes Area - Printable Shapes-of-distributions Worksheets Grade 12 - Quizizz
Decomposing 2D Shapes Area

20 Q

6th - Uni

AP Statistics Unit 1 Vocabulary Quiz - Printable Shapes-of-distributions Worksheets Grade 12 - Quizizz
AP Statistics Unit 1 Vocabulary Quiz

14 Q

12th

6.1-6.2 Review Statistics - Printable Shapes-of-distributions Worksheets Grade 12 - Quizizz
6.1-6.2 Review Statistics

14 Q

12th

Match Area Formulas with Shapes - Printable Shapes-of-distributions Worksheets Grade 12 - Quizizz
Match Area Formulas with Shapes

15 Q

6th - Uni

Center and Spread - Printable Shapes-of-distributions Worksheets Grade 12 - Quizizz
Center and Spread

20 Q

9th - 12th

SHS Unit 7 EOC Review - Printable Shapes-of-distributions Worksheets Grade 12 - Quizizz
SHS Unit 7 EOC Review

51 Q

9th - 12th

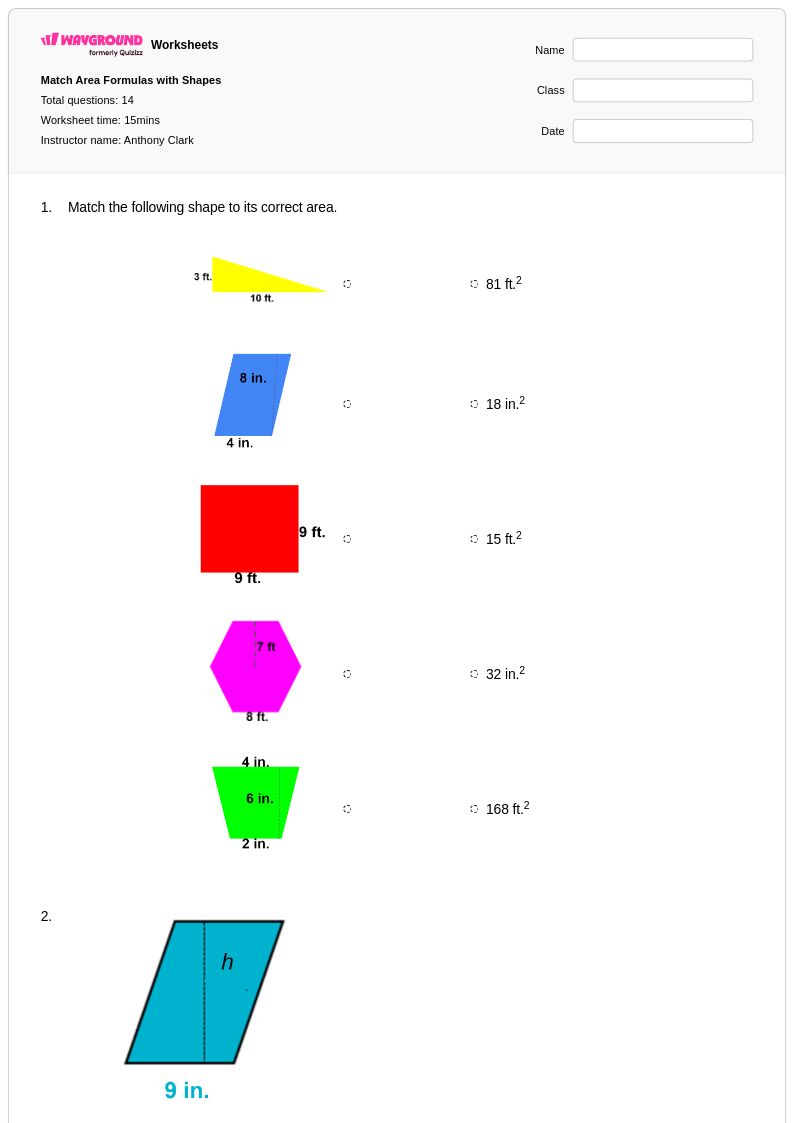
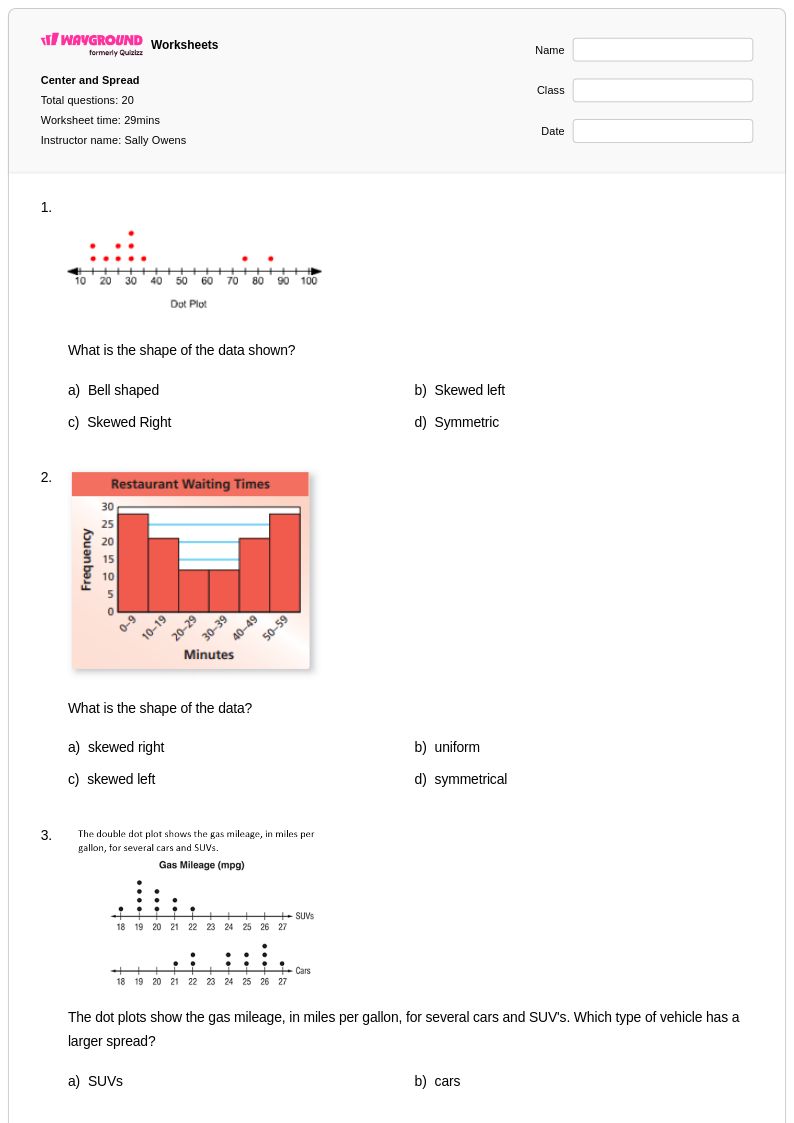
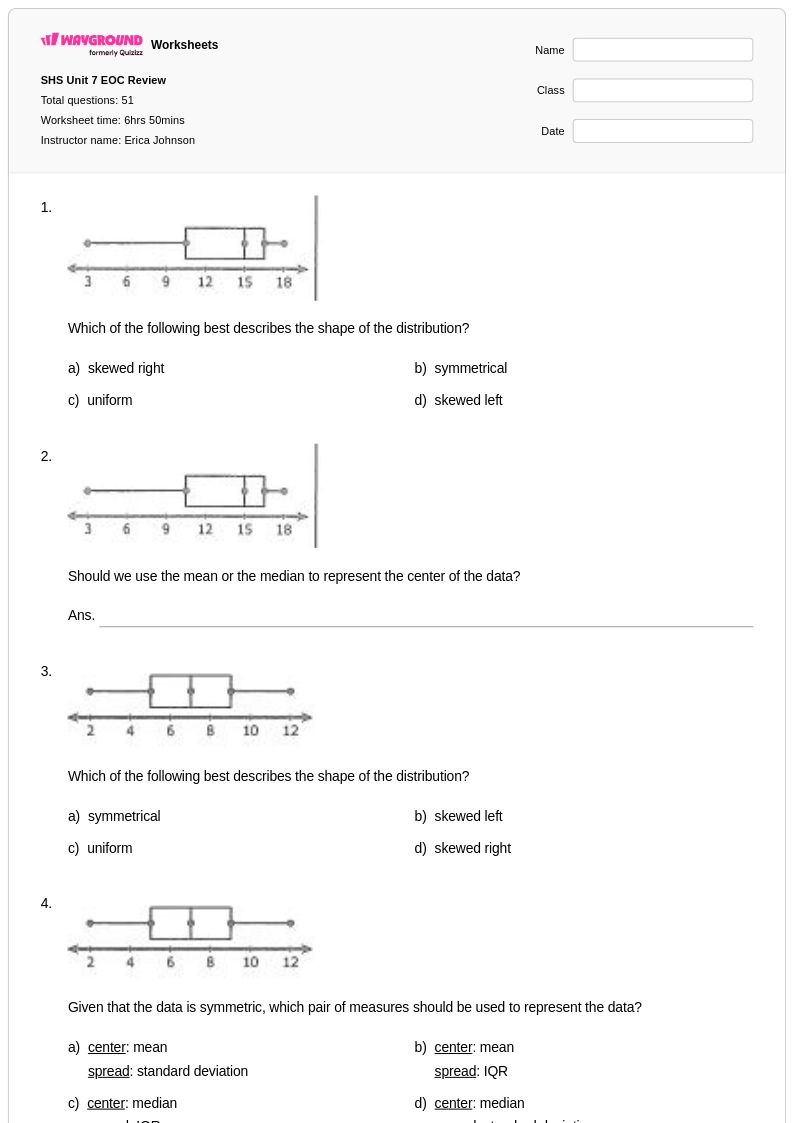
Explore printable Shapes of Distributions worksheets for Grade 12

Shapes of distributions worksheets for Grade 12 students provide comprehensive practice with analyzing and interpreting the visual characteristics of data sets, a fundamental skill in advanced probability and statistics coursework. These worksheets from Wayground (formerly Quizizz) focus on helping students identify and describe key distribution properties including symmetry, skewness, modality, and outliers across various graphical representations such as histograms, box plots, and dot plots. Students work through carefully structured practice problems that develop their ability to recognize normal distributions, uniform distributions, and skewed distributions while building vocabulary to describe center, spread, and shape using precise statistical language. Each worksheet includes detailed answer keys and is available as free printable pdf resources, making them accessible for both classroom instruction and independent study.

Wayground (formerly Quizizz) empowers educators with millions of teacher-created resources specifically designed for Grade 12 probability and statistics instruction, featuring robust search and filtering capabilities that allow teachers to quickly locate worksheets aligned with curriculum standards and learning objectives. The platform's differentiation tools enable instructors to customize worksheet difficulty levels and content focus areas, supporting both remediation for students who need additional practice with basic distribution concepts and enrichment activities for advanced learners ready to tackle complex real-world data analysis scenarios. Available in both printable and digital formats including downloadable pdfs, these resources seamlessly integrate into lesson planning workflows while providing flexible options for skill practice, formative assessment, and homework assignments that reinforce students' understanding of how data shape reveals important information about underlying populations and processes.