
14 Q
9th - 12th
20 Q
7th - 12th
20 Q
5th - Uni
15 Q
5th - Uni
15 Q
9th - 12th
13 Q
5th - Uni
15 Q
10th
11 Q
9th - 12th
20 Q
7th - Uni
20 Q
6th - Uni
11 Q
4th - Uni
15 Q
8th - 12th
20 Q
9th - 12th
10 Q
8th - Uni
20 Q
5th - Uni
18 Q
7th - Uni
17 Q
7th - Uni

22 Q
9th - 12th
15 Q
7th - Uni
15 Q
5th - Uni
17 Q
9th - 12th
22 Q
8th - Uni
15 Q
9th - 12th
20 Q
5th - Uni
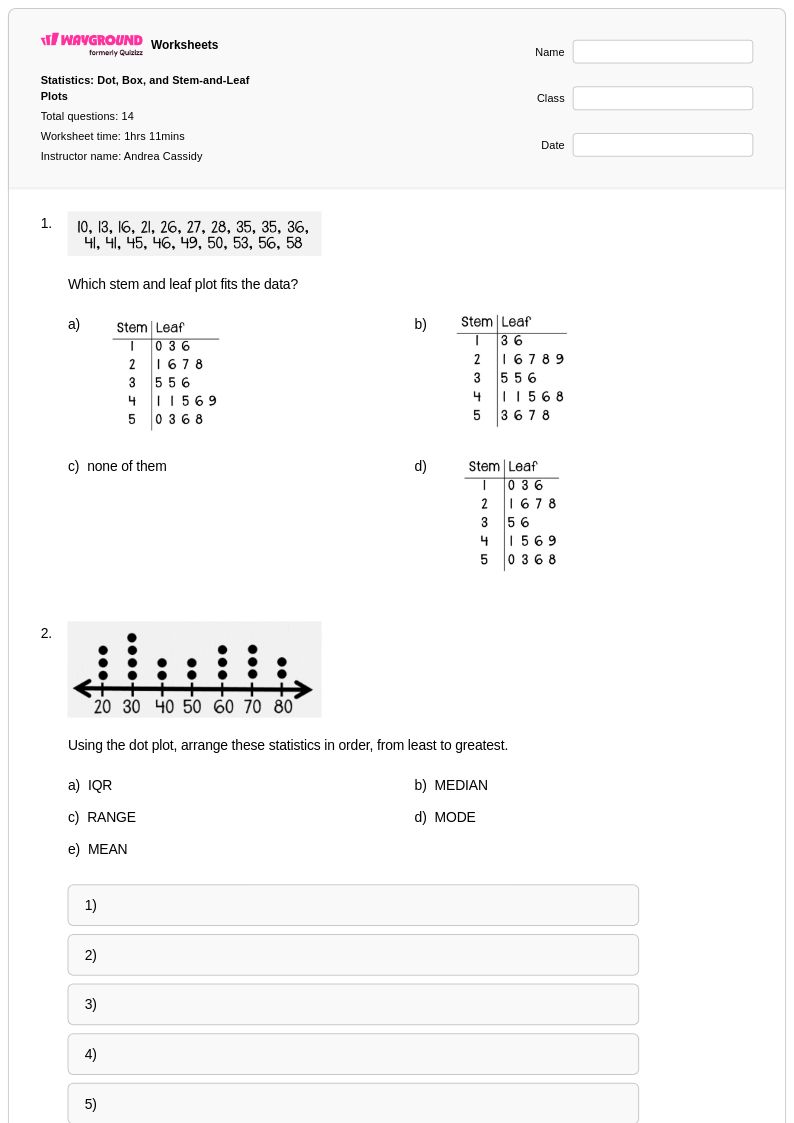
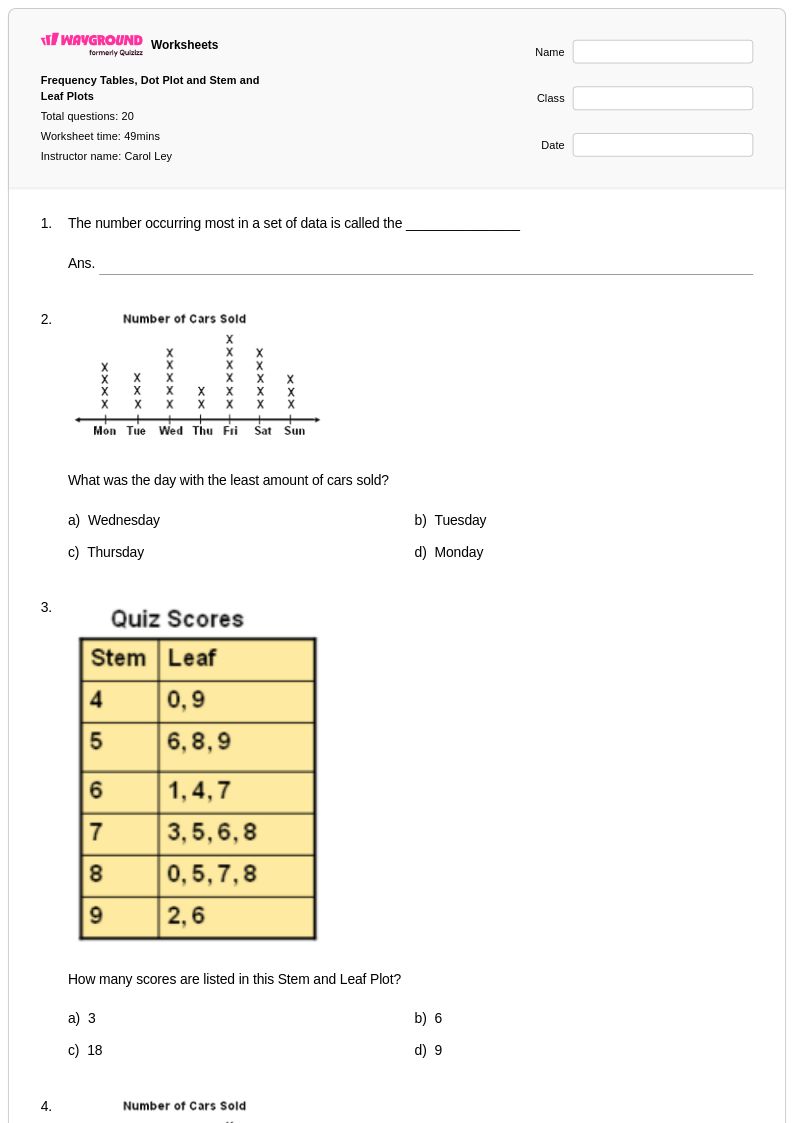
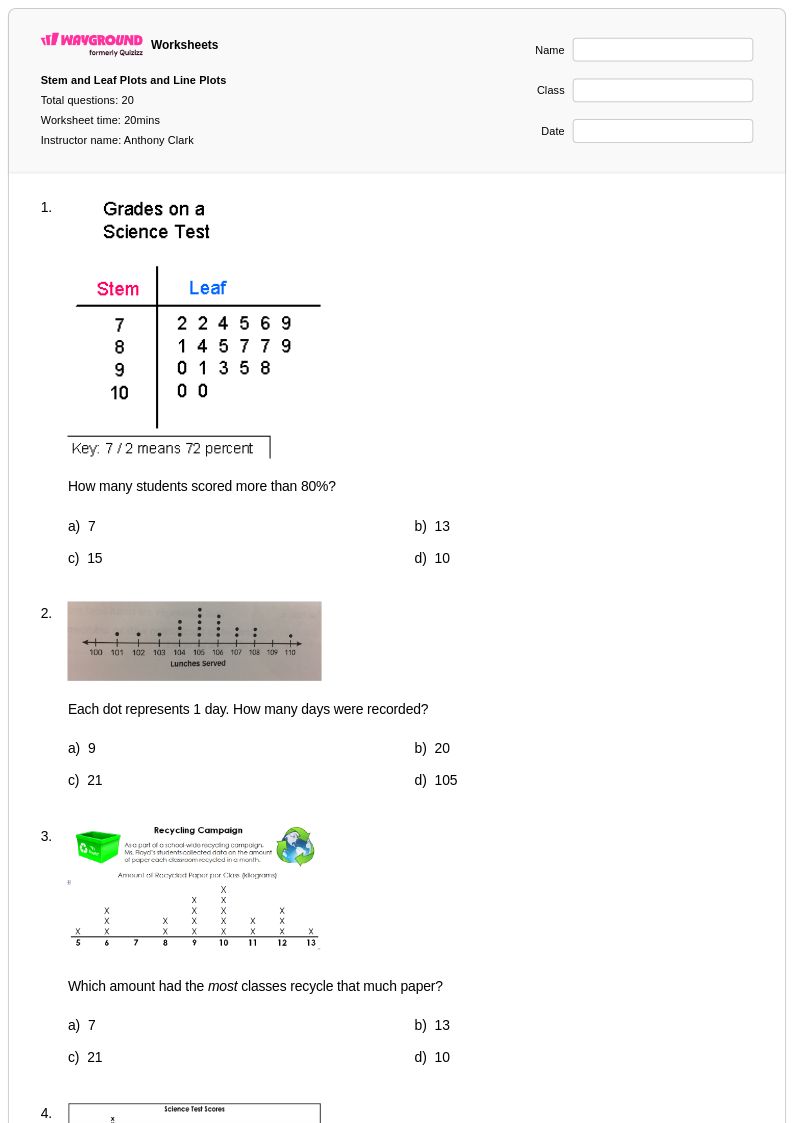
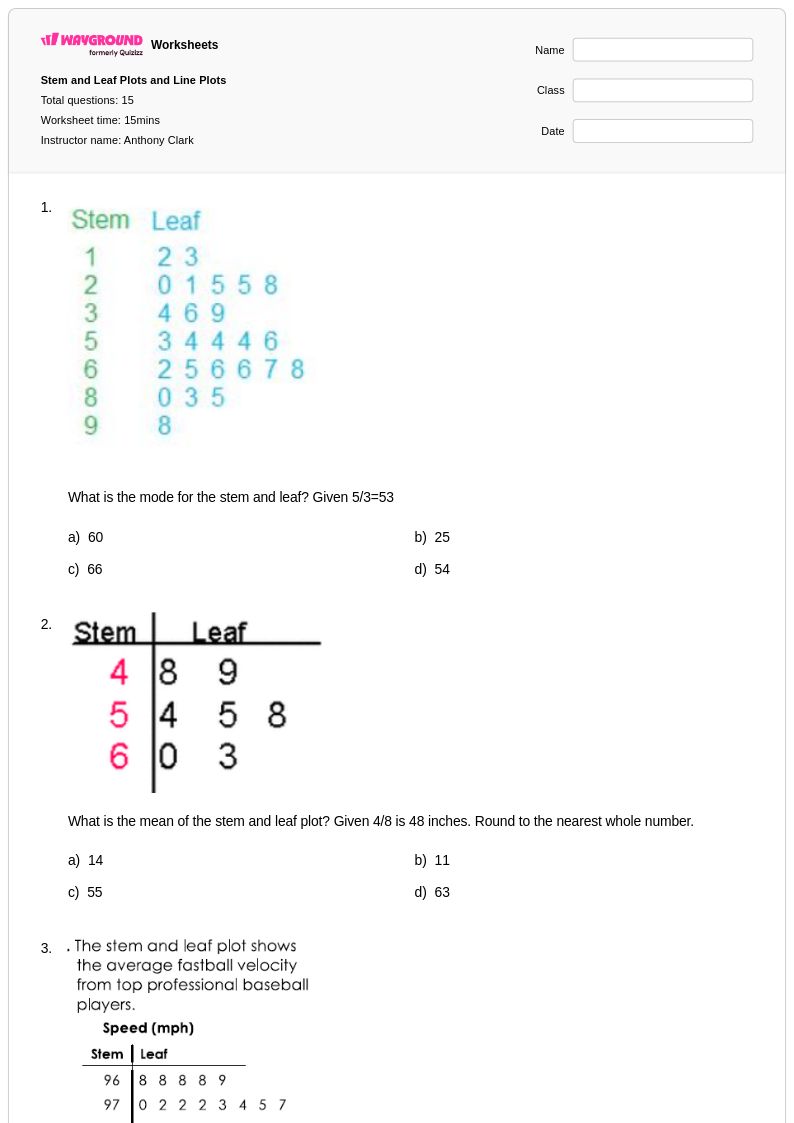
Explore Stem and Leaf Plot Worksheets by Grades
Explore Other Subject Worksheets for grade 10
Explore printable Stem and Leaf Plot worksheets for Grade 10
Stem and leaf plots represent a fundamental data organization and visualization technique that Grade 10 students must master to analyze numerical datasets effectively. Wayground's comprehensive collection of stem and leaf plot worksheets provides students with structured practice in constructing, reading, and interpreting these statistical displays. These carefully designed practice problems strengthen essential skills including data ordering, pattern recognition, distribution analysis, and statistical reasoning. Each worksheet comes with a detailed answer key to support independent learning and self-assessment, while the free printable format ensures accessibility for all students. The pdf resources cover various complexity levels, from basic stem and leaf construction using simple datasets to advanced applications involving back-to-back plots, outlier identification, and comparative analysis between multiple data sets.
Wayground's extensive library of teacher-created stem and leaf plot resources empowers educators with millions of high-quality materials specifically aligned to Grade 10 mathematics standards. The platform's robust search and filtering capabilities allow teachers to quickly locate worksheets that match their specific curriculum requirements and student ability levels. Advanced differentiation tools enable seamless customization of practice problems to accommodate diverse learning needs, while the availability of both printable and digital formats, including downloadable pdf versions, provides maximum classroom flexibility. These comprehensive resources support effective lesson planning by offering varied approaches to stem and leaf plot instruction, targeted remediation materials for struggling students, and enrichment opportunities for advanced learners, ensuring that all Grade 10 students develop proficiency in this critical data analysis skill.