
20 Q
9th - 12th
19 Q
8th - Uni
12 Q
8th - Uni
20 Q
8th - Uni
15 Q
8th - Uni
13 Q
8th - Uni

17 Q
8th - Uni
15 Q
9th - Uni
20 Q
9th - 12th
20 Q
8th - Uni
15 Q
8th - Uni
20 Q
9th - 12th
20 Q
8th - Uni
9 Q
7th - 12th
20 Q
8th - Uni
20 Q
8th - Uni
20 Q
8th - Uni
15 Q
8th - Uni
20 Q
8th - Uni
20 Q
8th - Uni
15 Q
8th - Uni
20 Q
8th - Uni
20 Q
8th - Uni
15 Q
8th - Uni
Explore Scatter Plot Association Worksheets by Grades
Explore Other Subject Worksheets for grade 10
Explore printable Scatter Plot Association worksheets for Grade 10
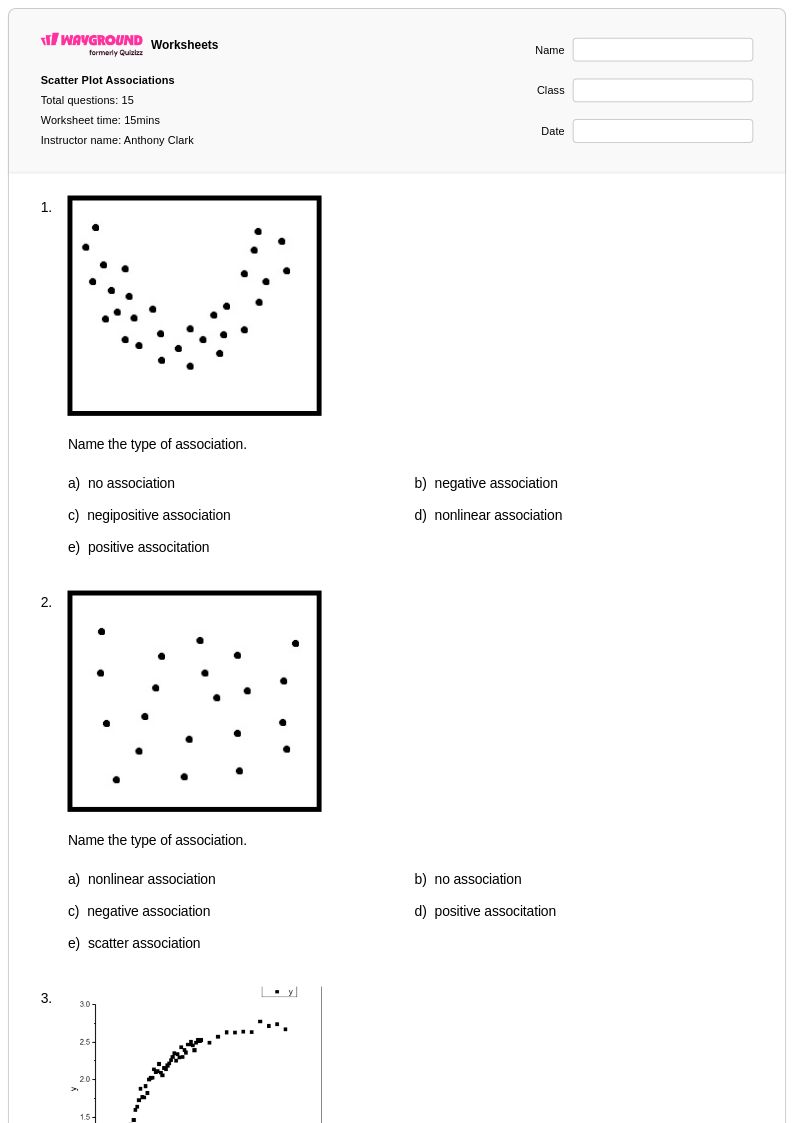
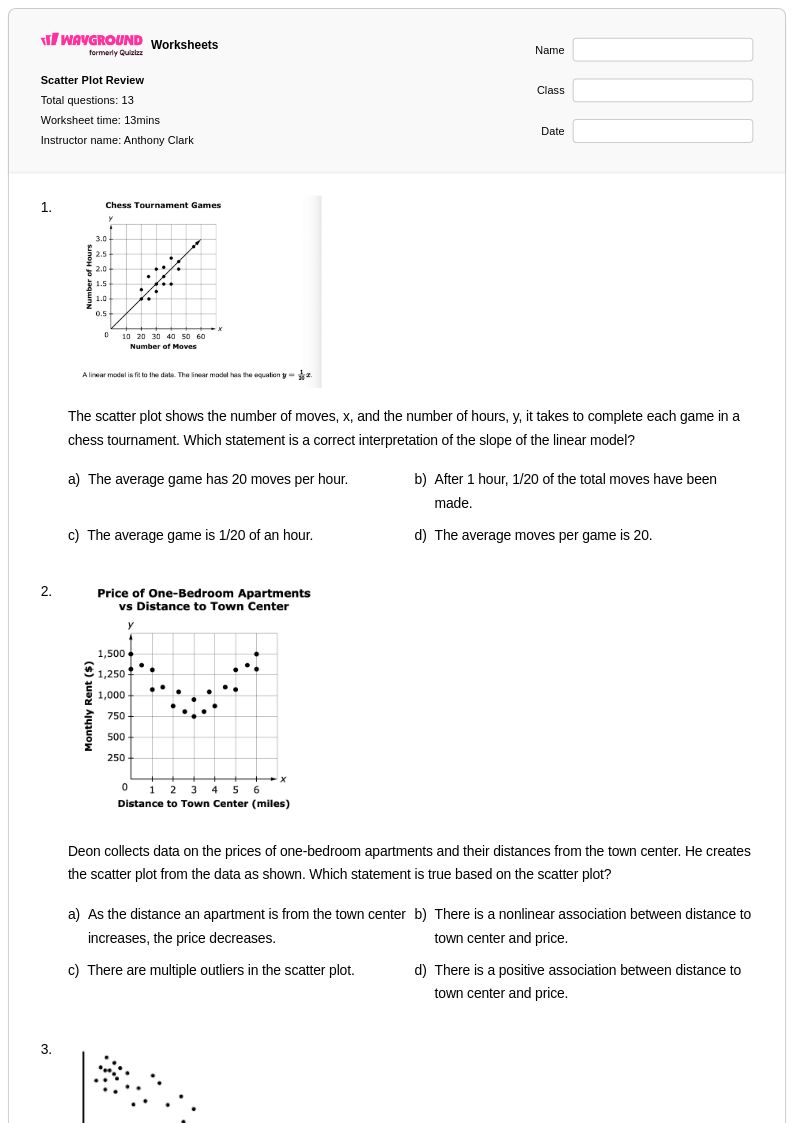
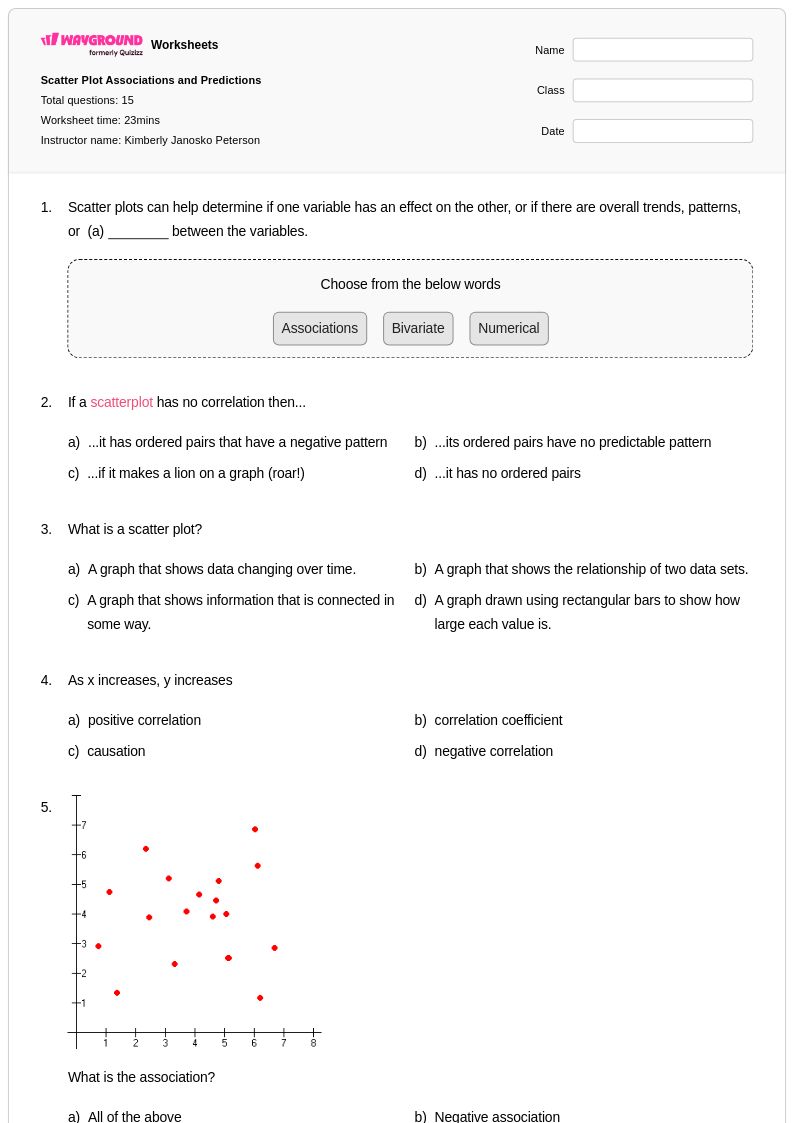
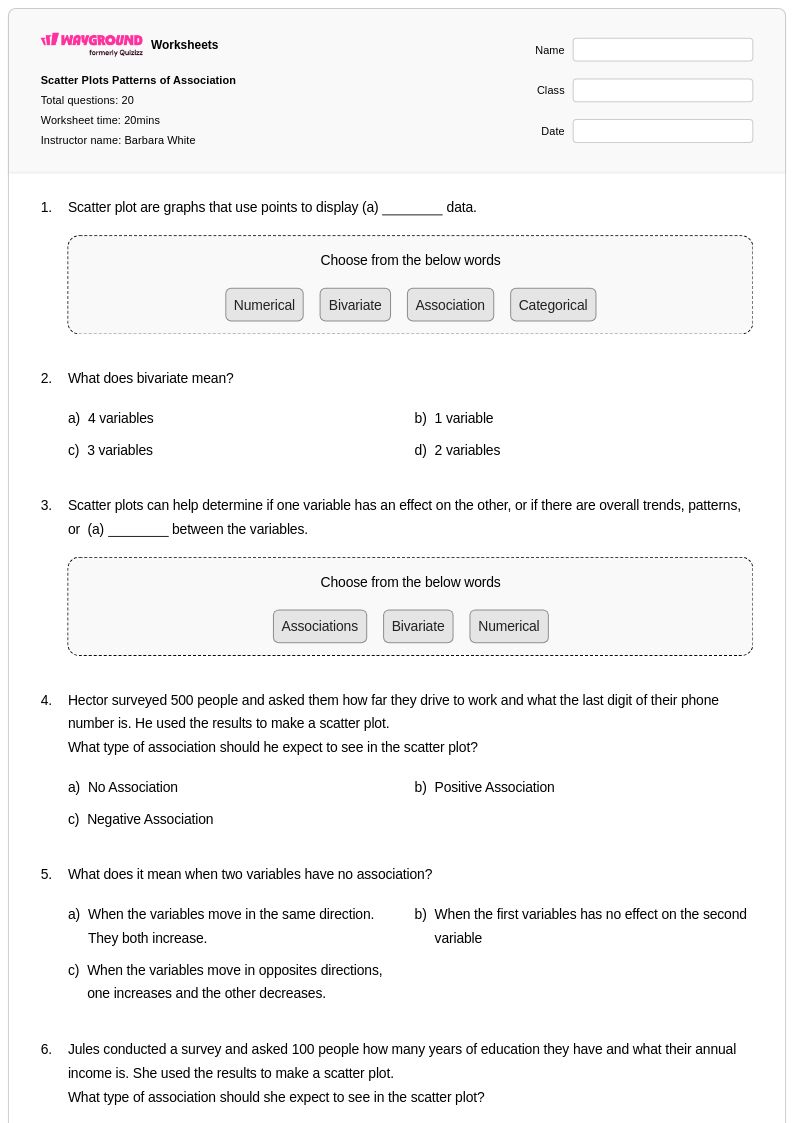
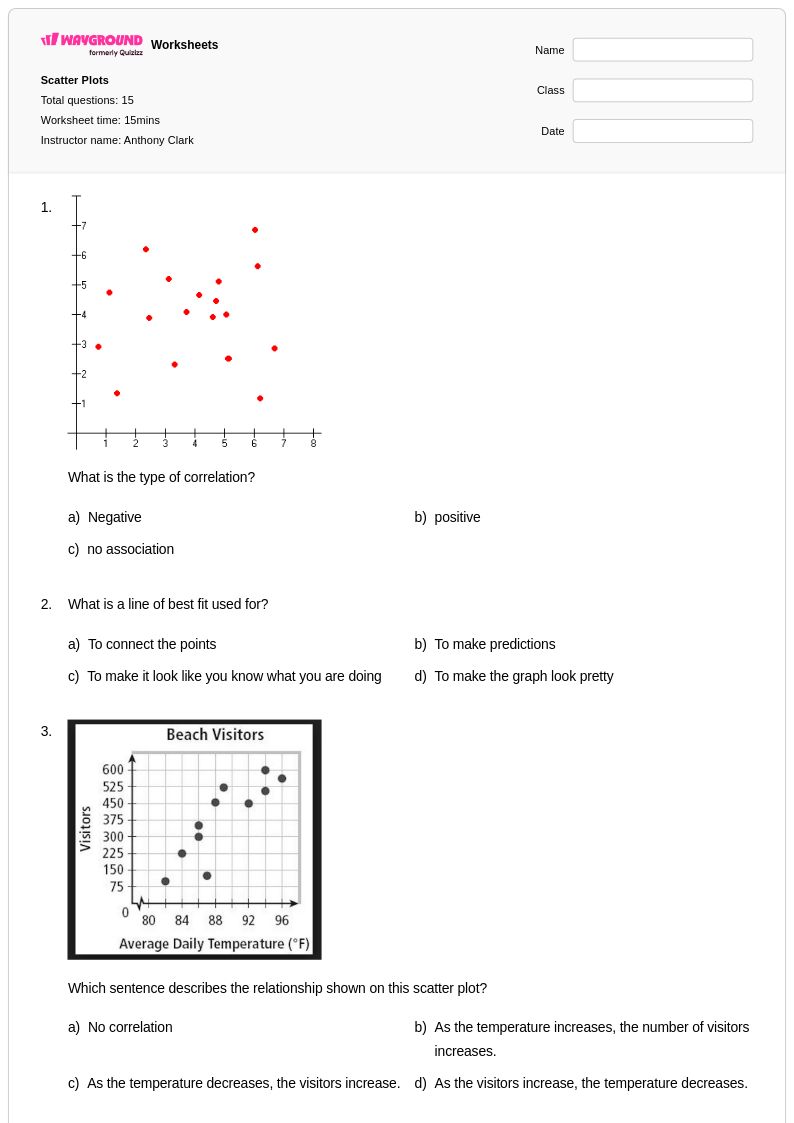
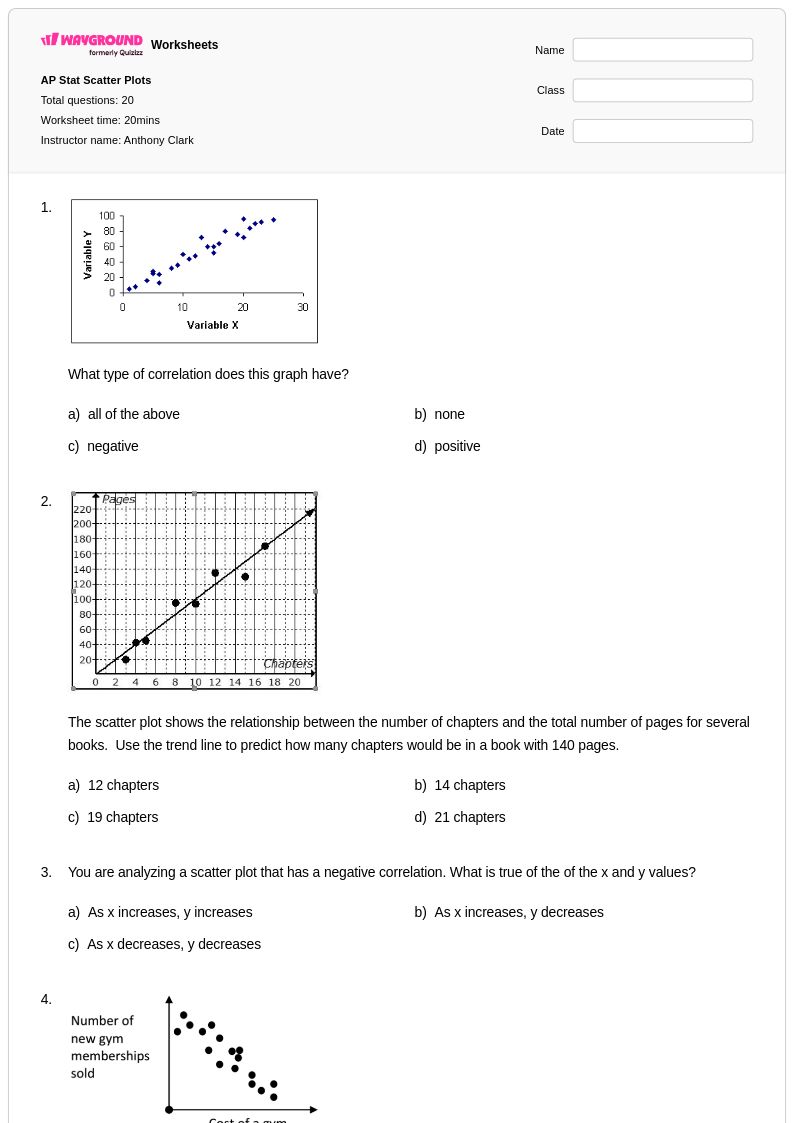
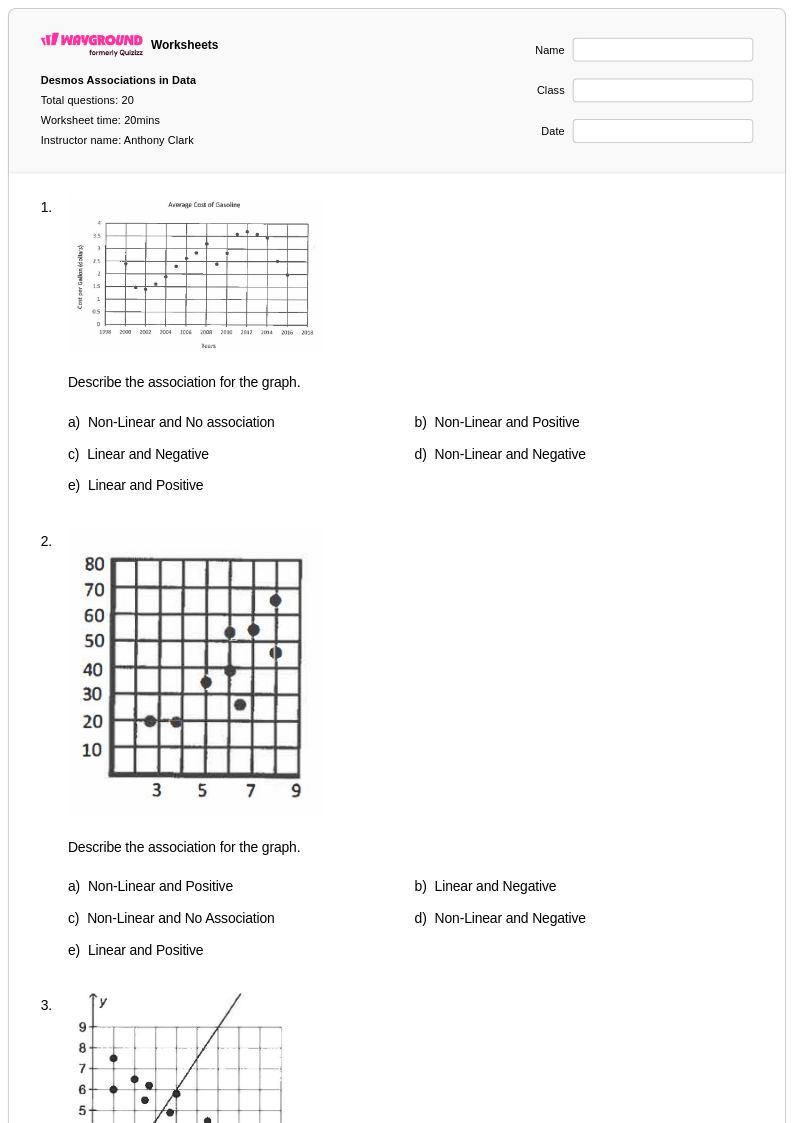
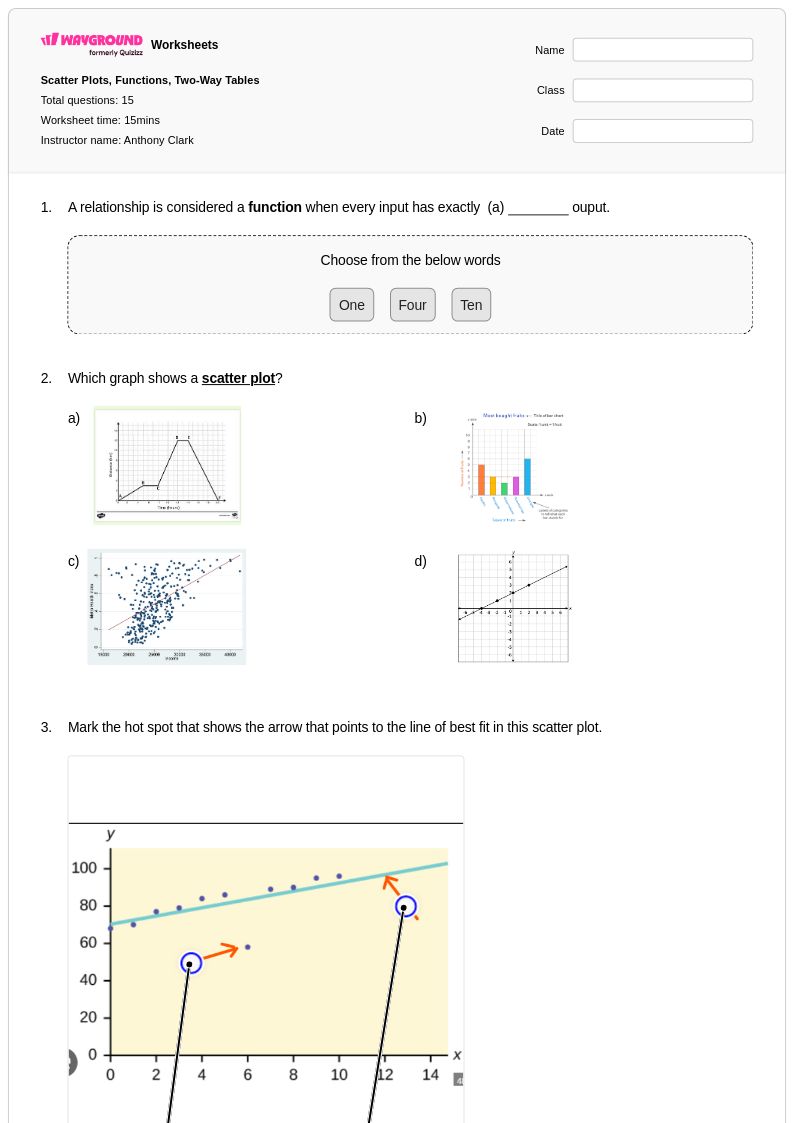
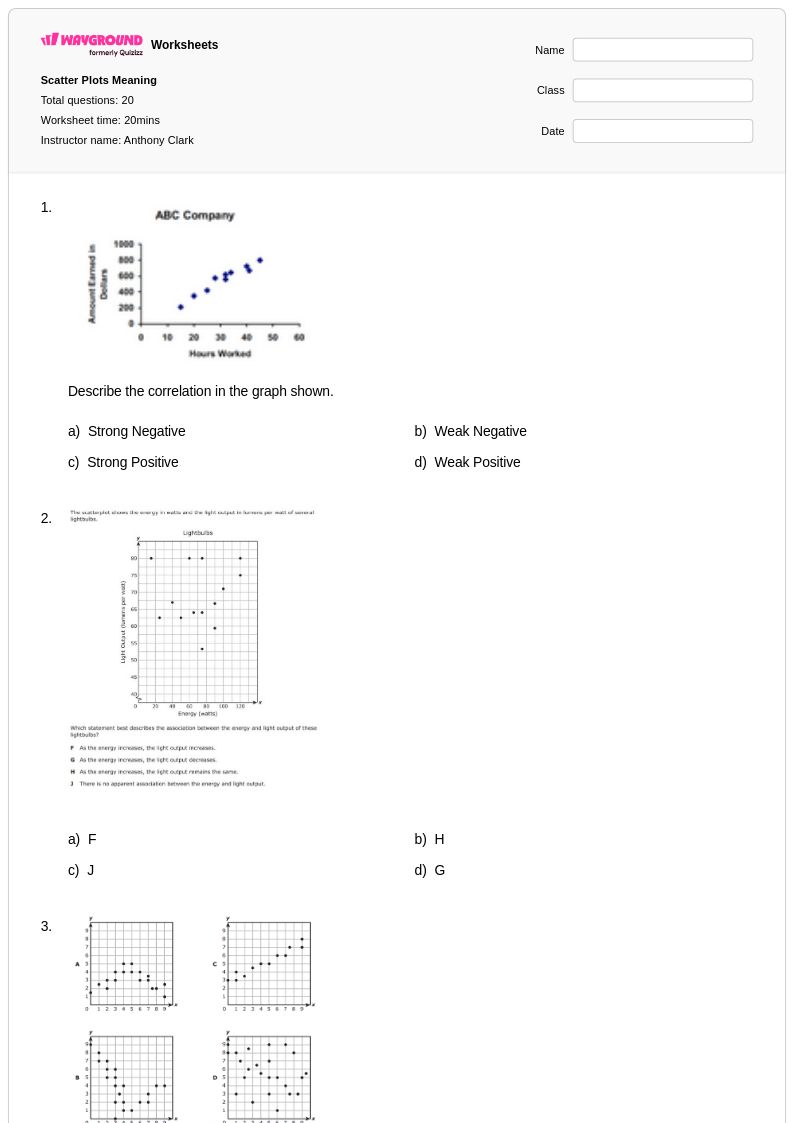
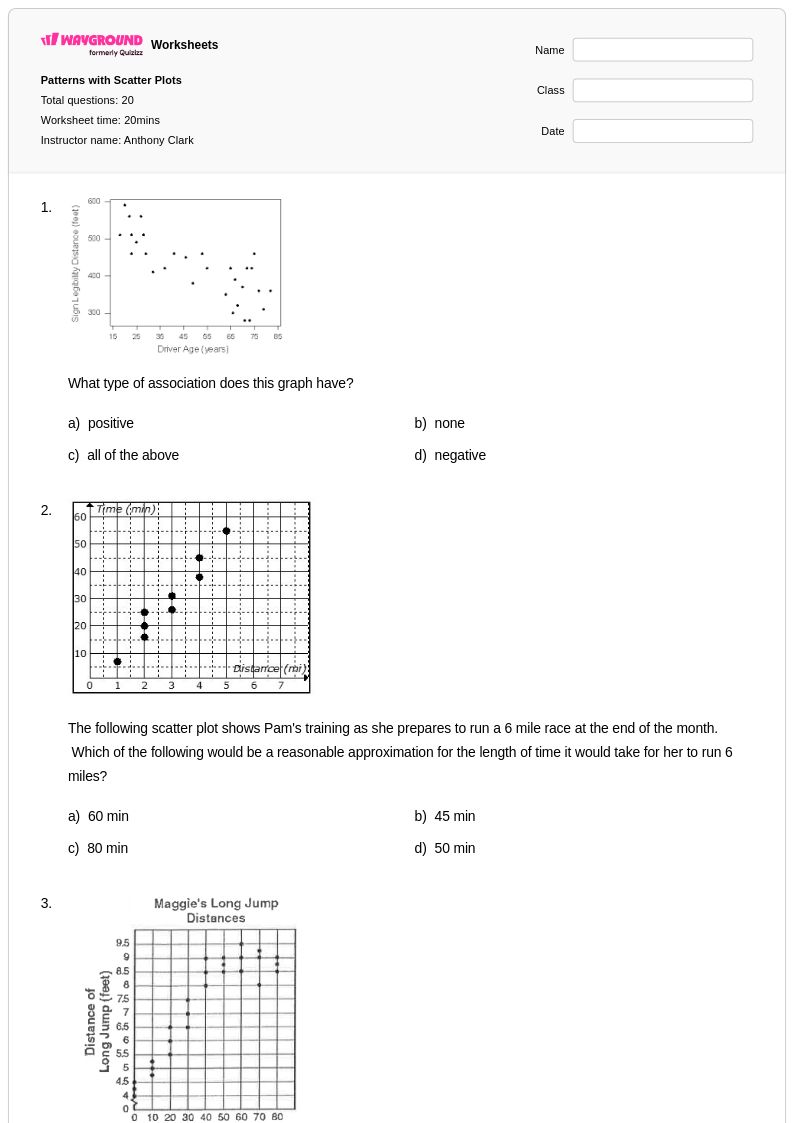
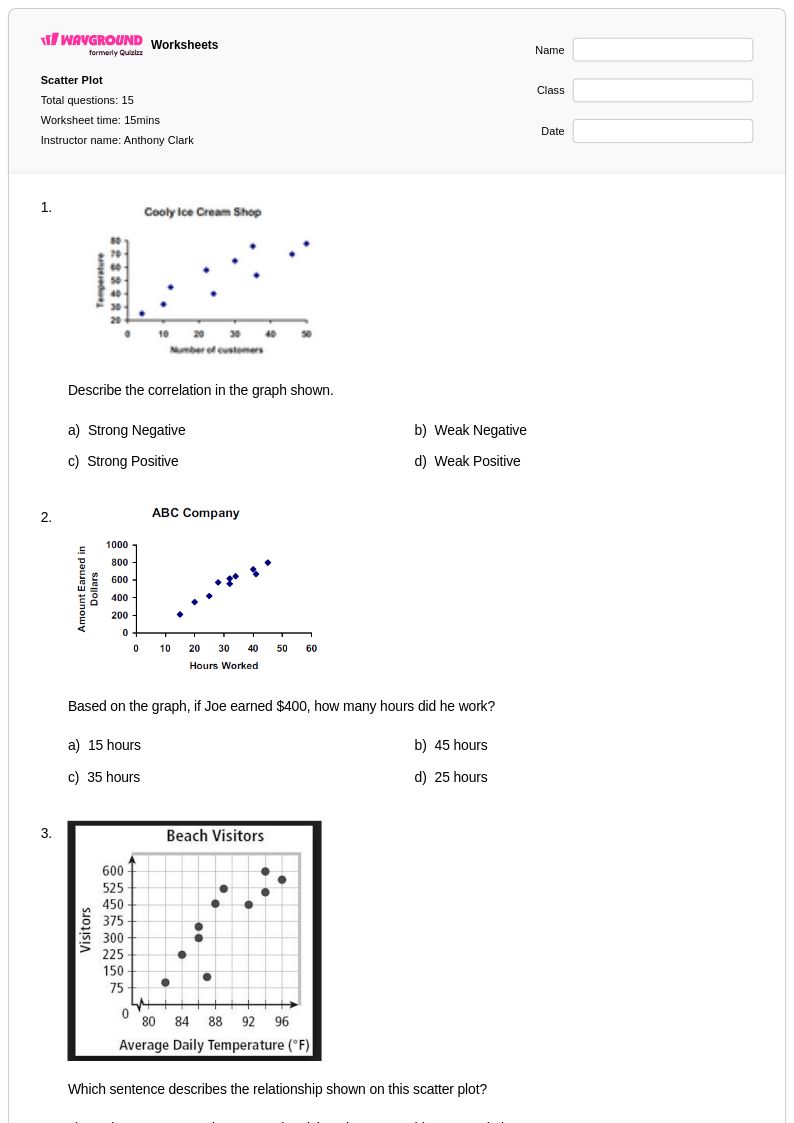
Scatter plot association worksheets for Grade 10 mathematics provide students with essential practice in analyzing the relationship between two quantitative variables through visual data representation. These comprehensive worksheets guide students through identifying positive, negative, and no correlation patterns while developing critical skills in data interpretation and statistical reasoning. Students work through practice problems that challenge them to examine real-world datasets, determine the strength and direction of associations, and make predictions based on scatter plot trends. Each worksheet includes detailed answer keys that support independent learning and self-assessment, with free printable pdf formats ensuring accessibility for all learners seeking to master this fundamental statistical concept.
Wayground, formerly Quizizz, empowers educators with millions of teacher-created scatter plot association resources specifically designed for Grade 10 mathematics instruction. The platform's advanced search and filtering capabilities allow teachers to quickly locate worksheets aligned with curriculum standards, while differentiation tools enable customization for diverse learning needs and ability levels. Teachers can seamlessly transition between printable pdf versions for traditional classroom use and digital formats for interactive learning experiences, supporting flexible lesson planning and delivery. These comprehensive worksheet collections facilitate targeted remediation for struggling students, provide enrichment opportunities for advanced learners, and offer systematic skill practice that builds confidence in data analysis and graphing concepts essential for mathematical literacy.