
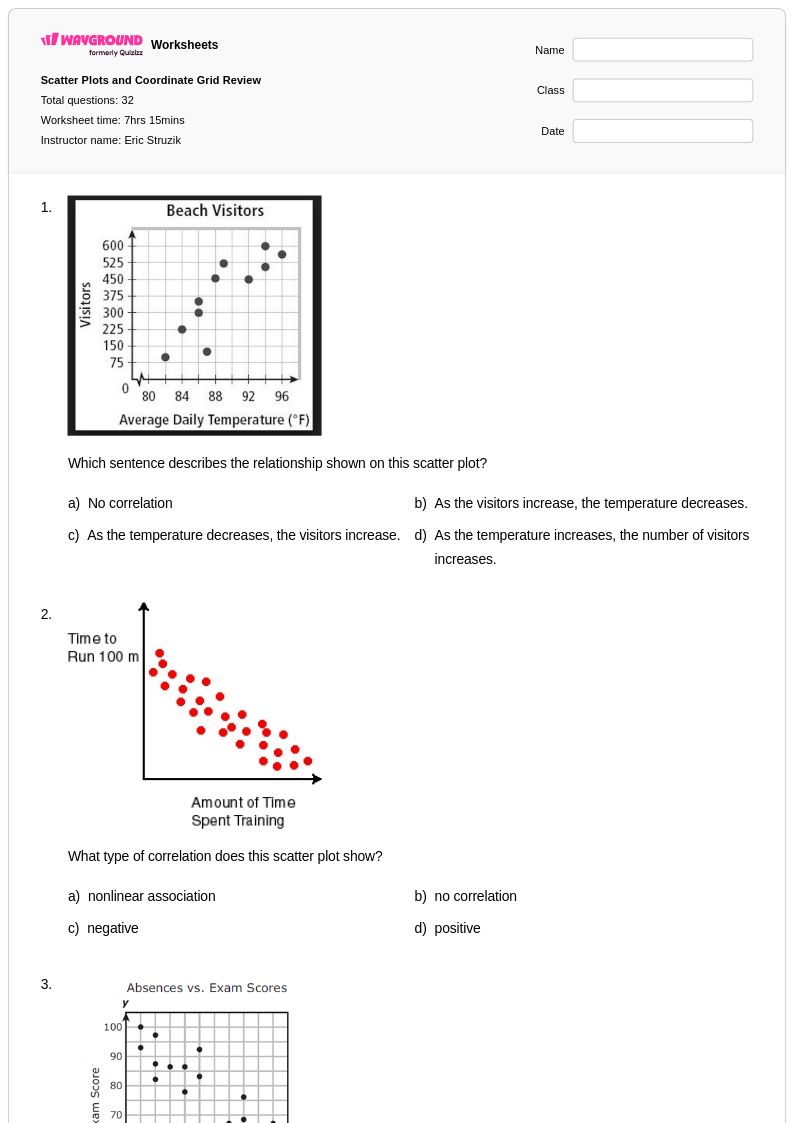
32Q
7th
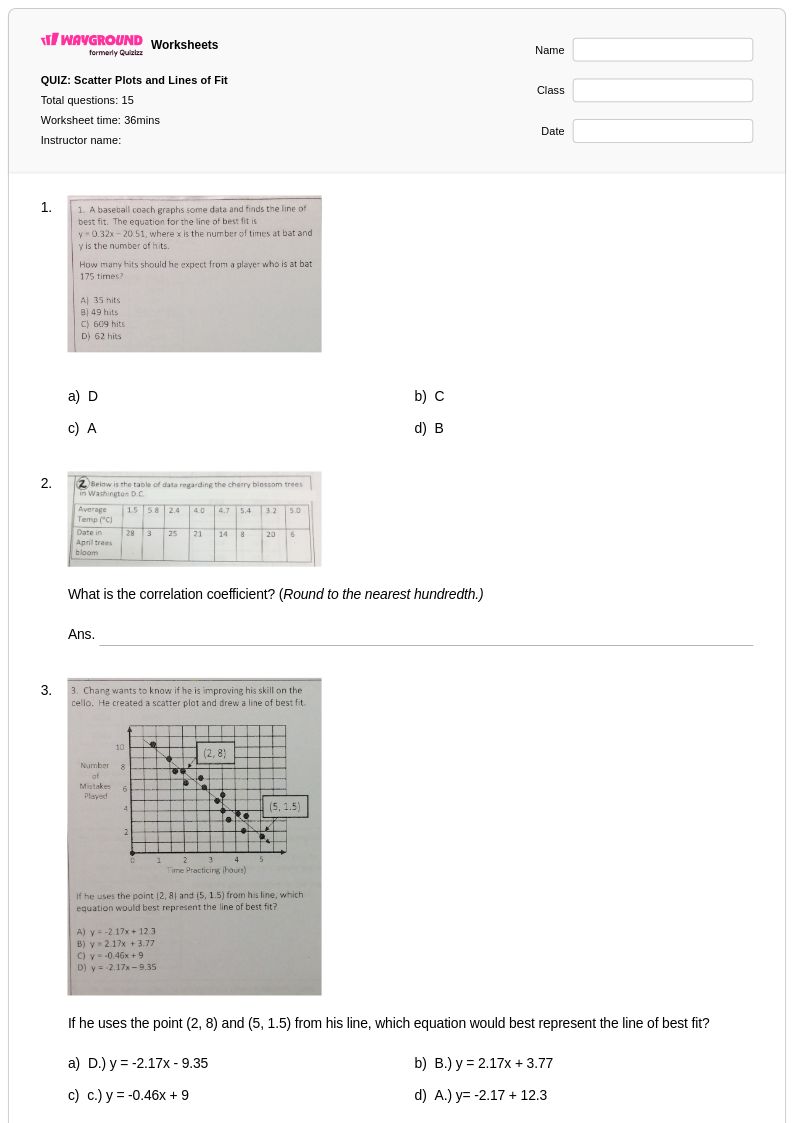
15Q
7th - 10th
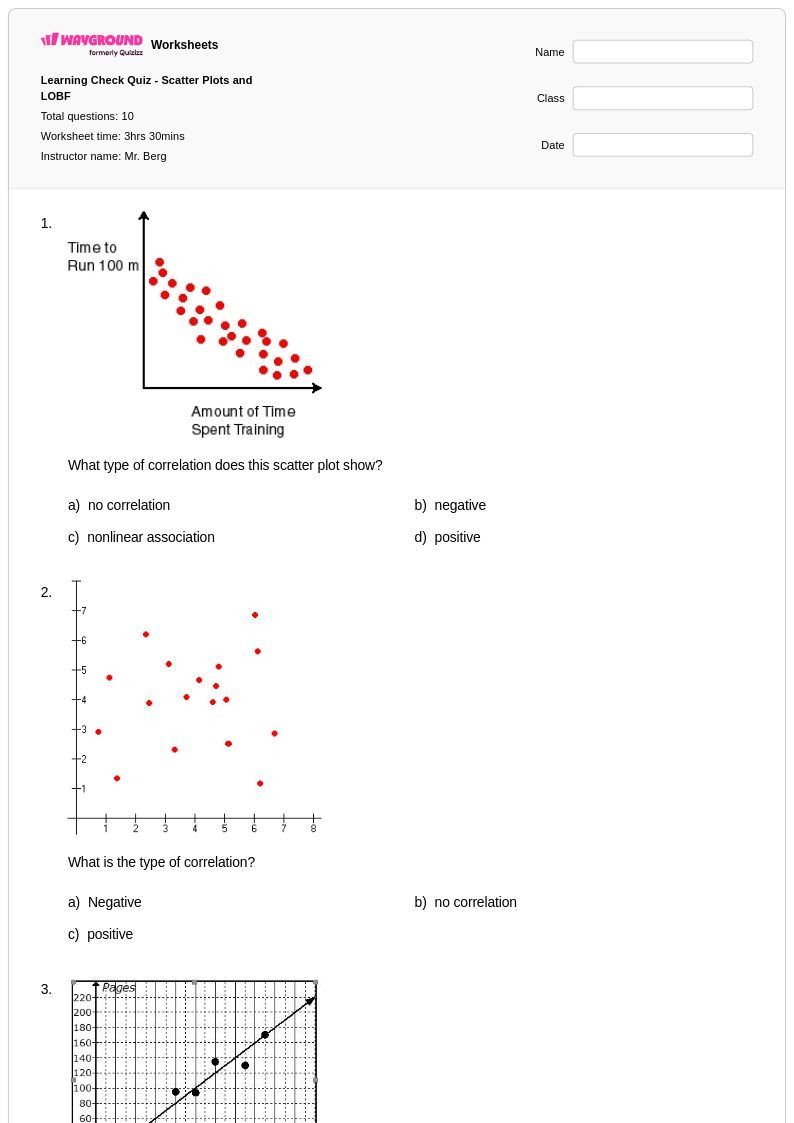
10Q
7th - 8th
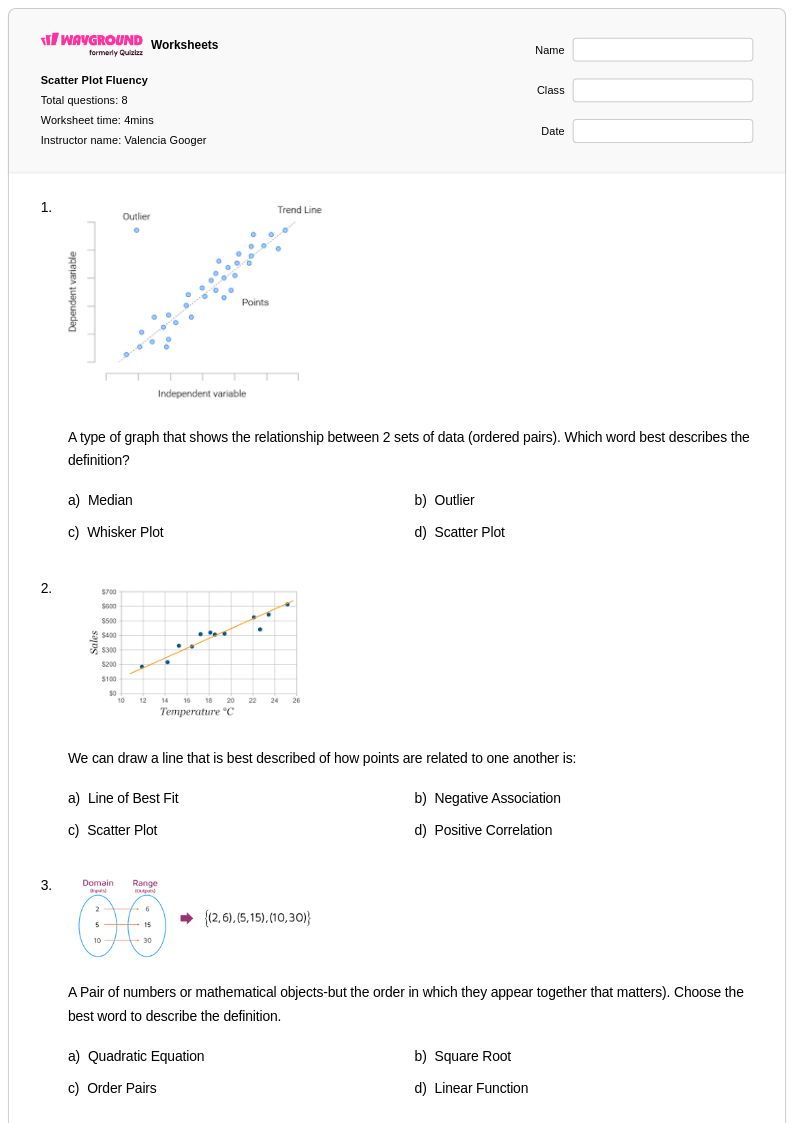
8Q
7th - 8th
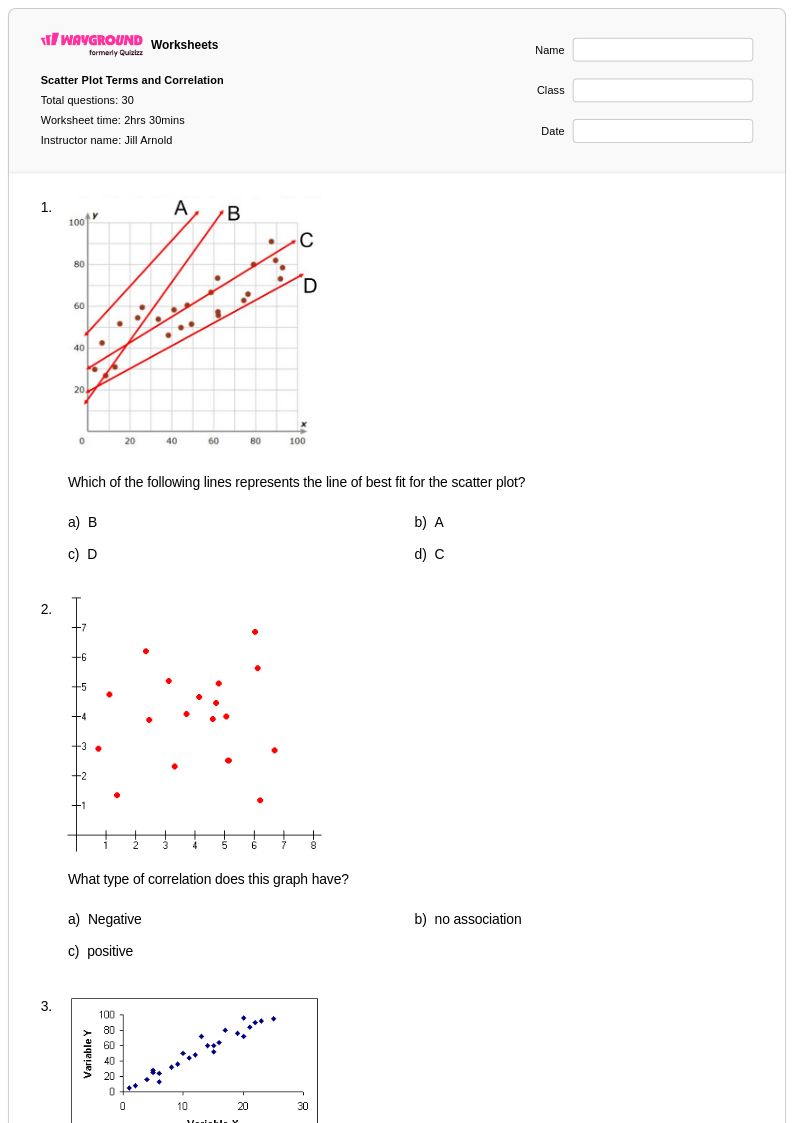
30Q
7th - 8th
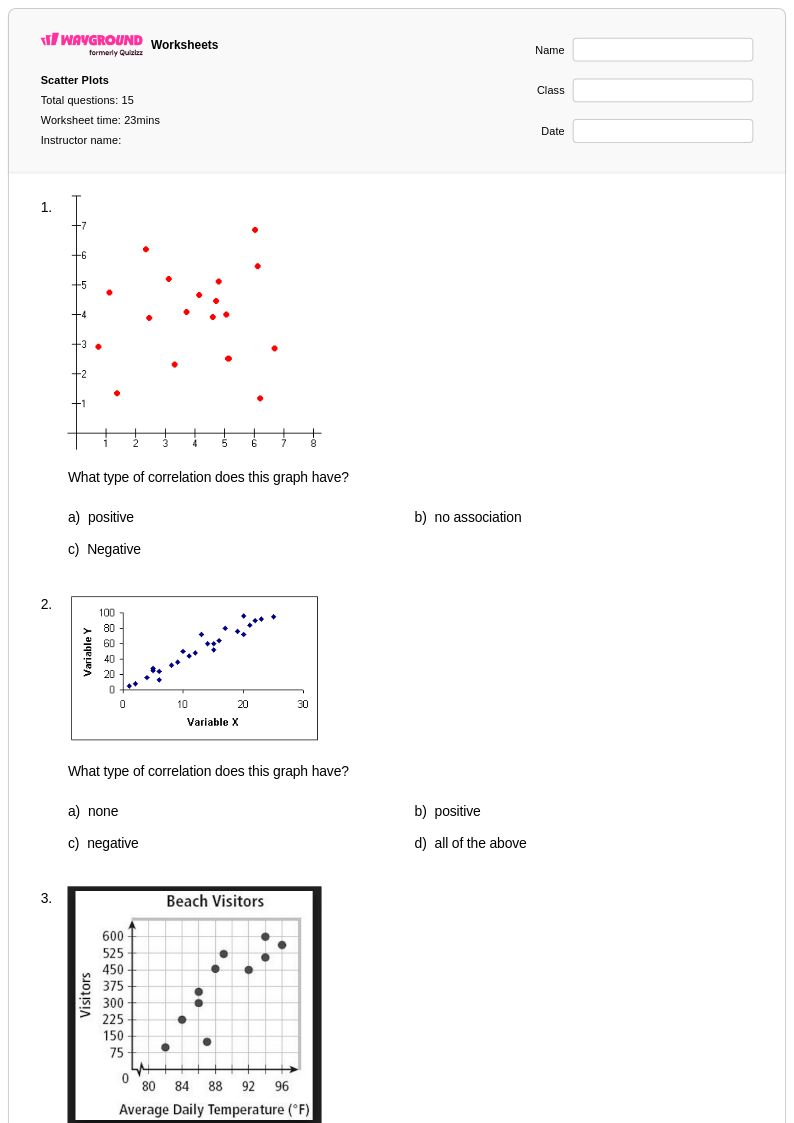
15Q
7th
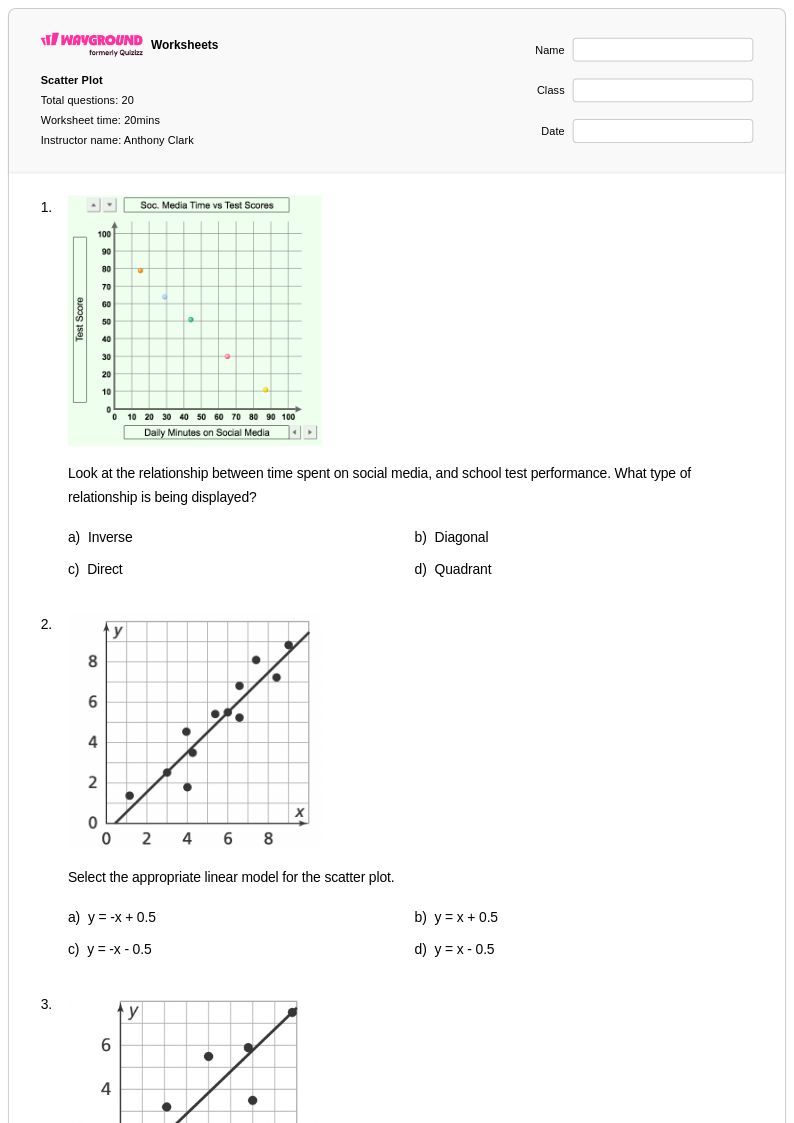
20Q
6th - Uni
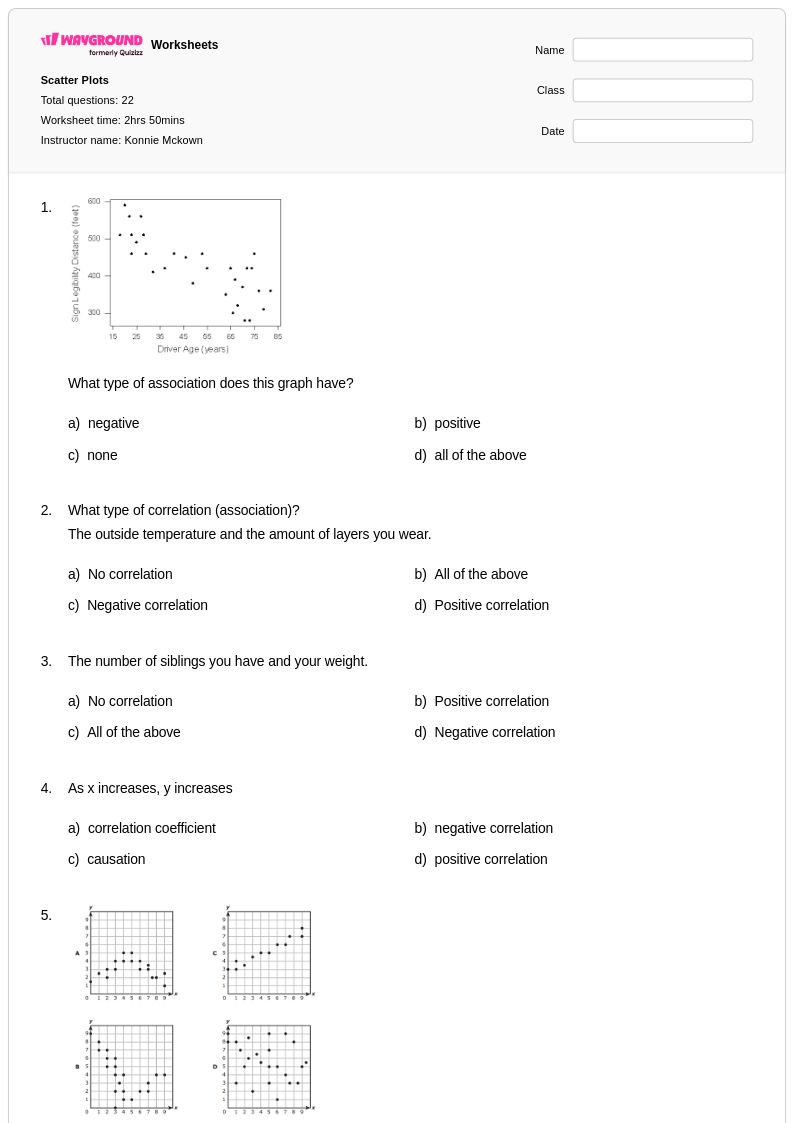
22Q
7th
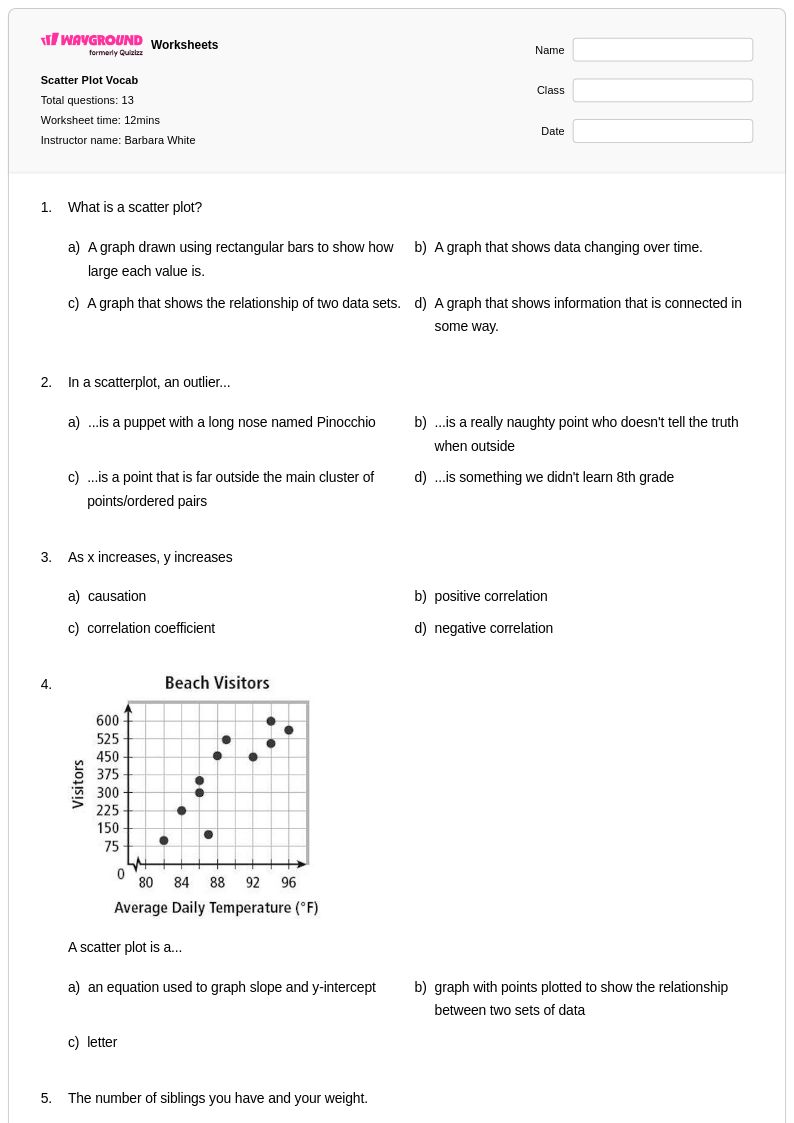
13Q
6th - 8th
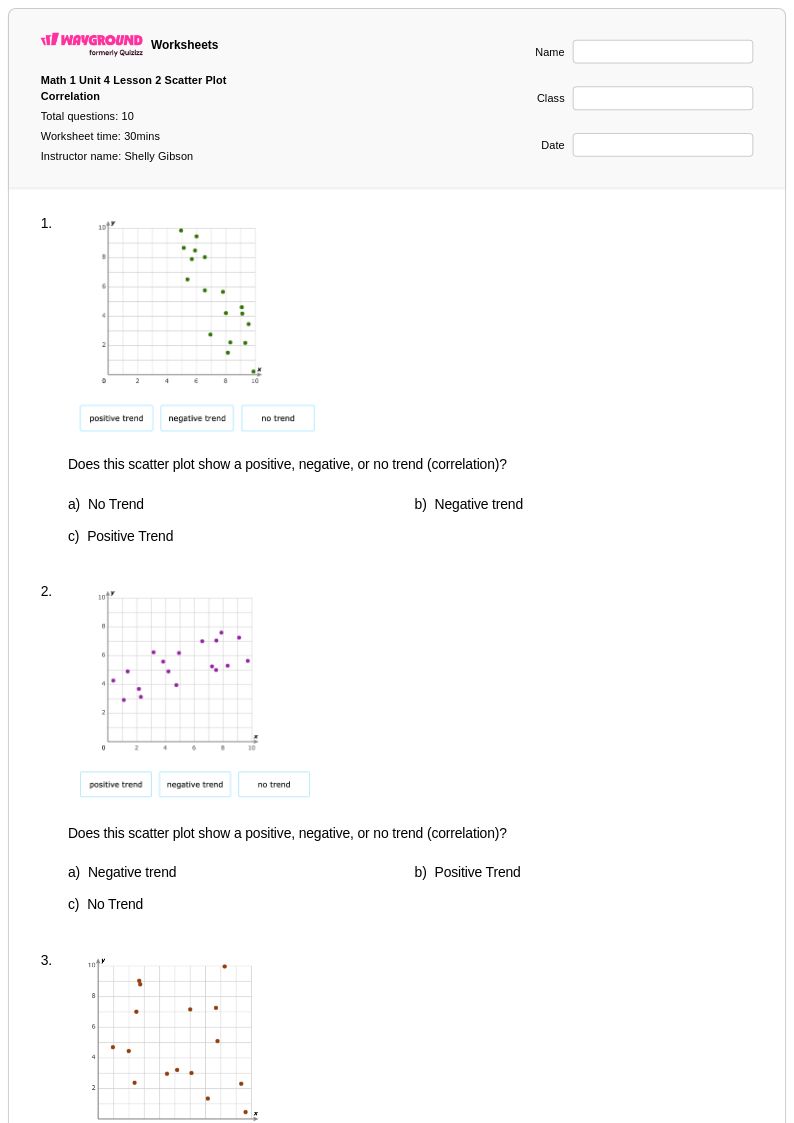
10Q
6th - 8th
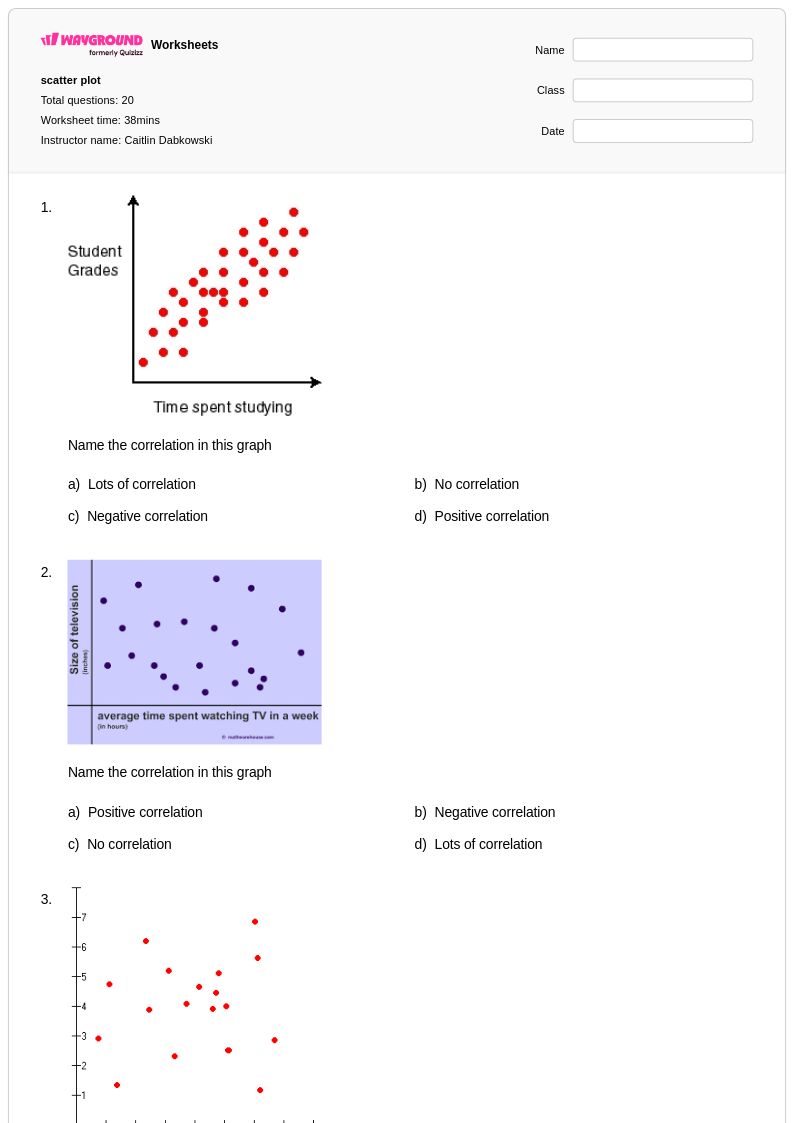
20Q
7th
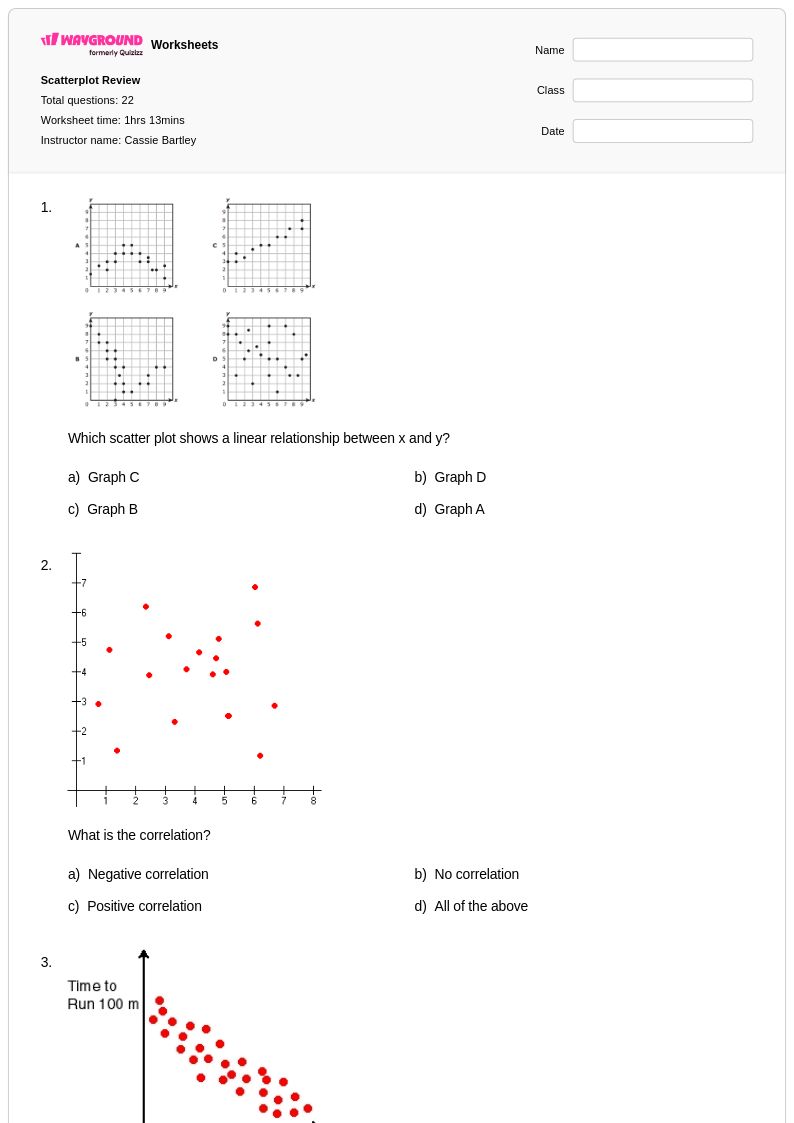
22Q
6th - 8th
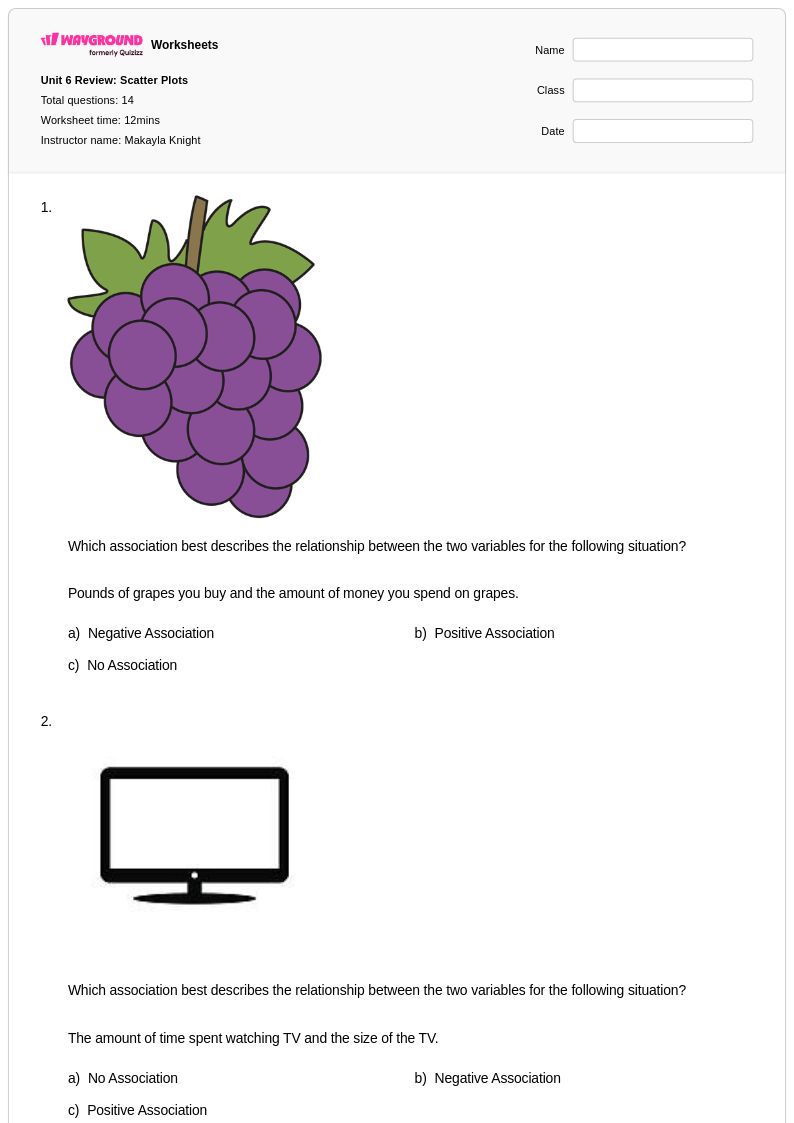
14Q
6th - 8th
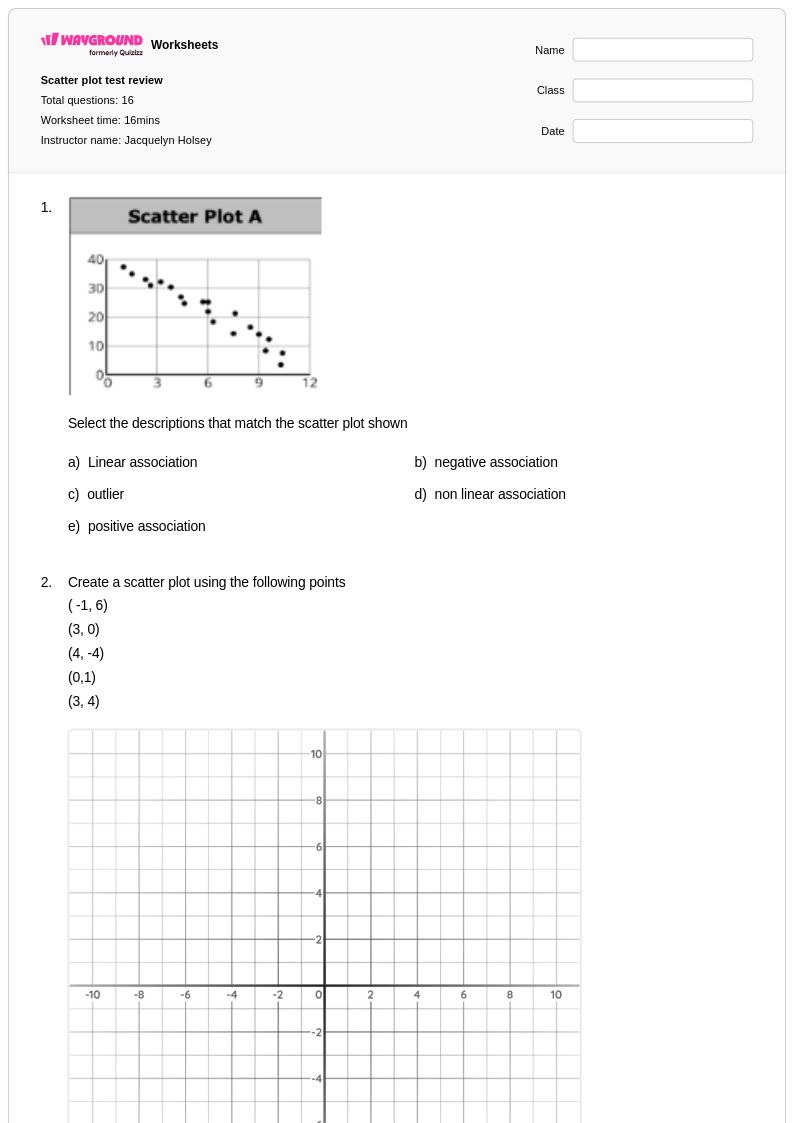
16Q
6th - 8th
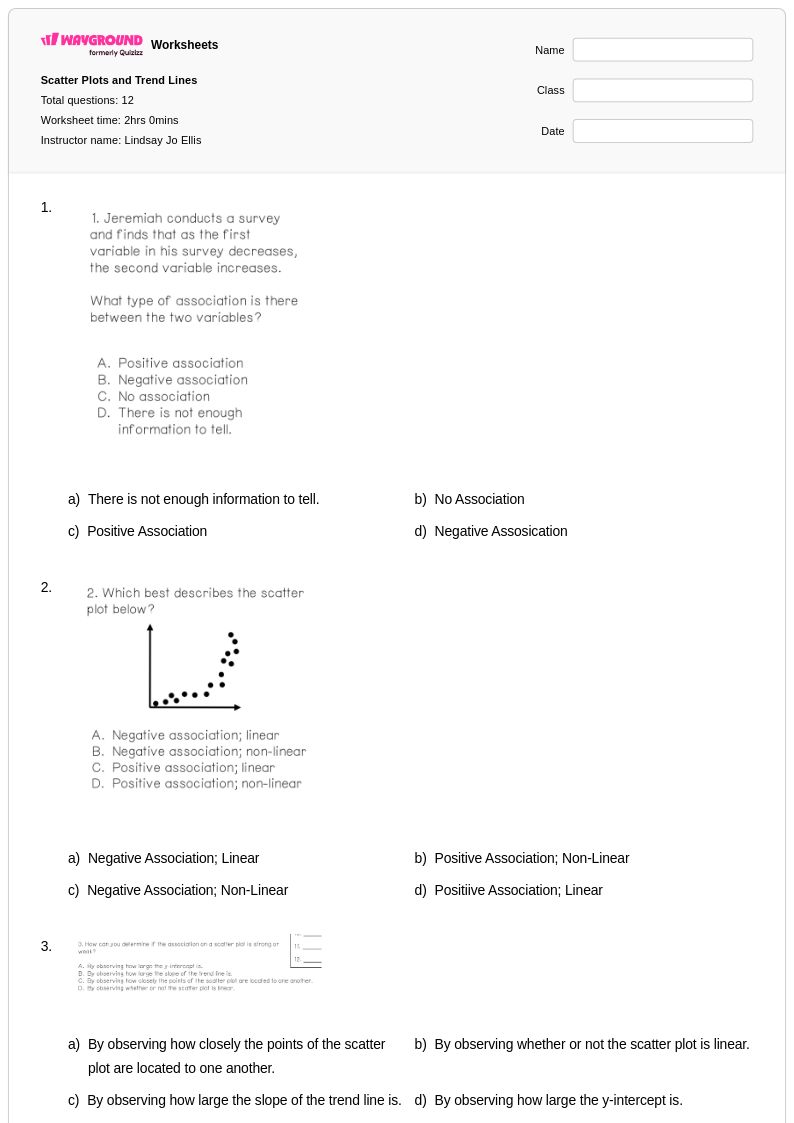
12Q
7th - 9th
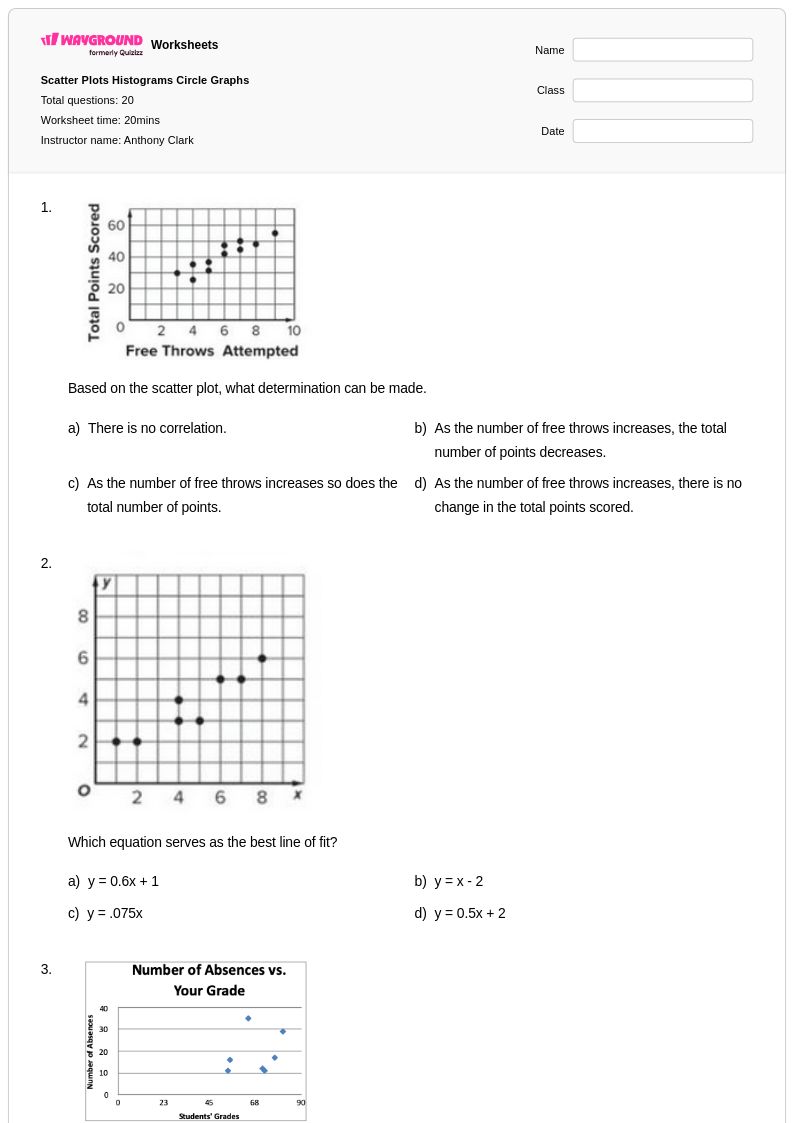
20Q
7th - Uni
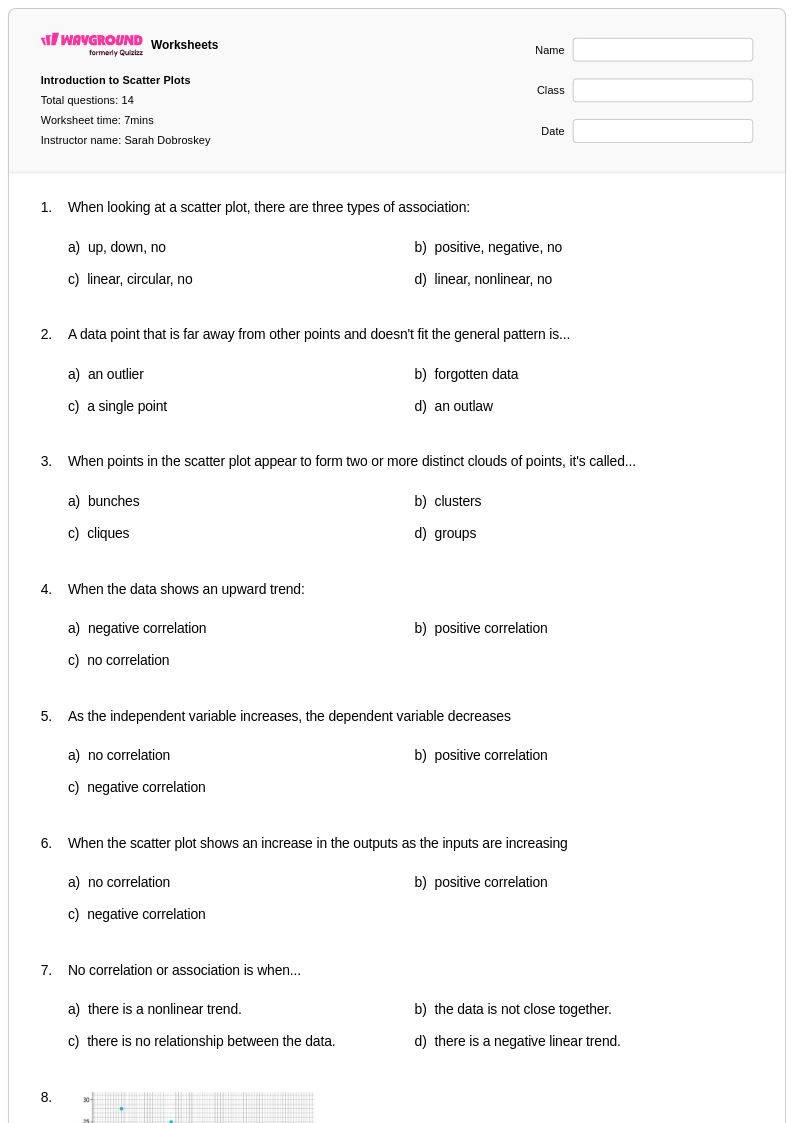
14Q
7th - 9th
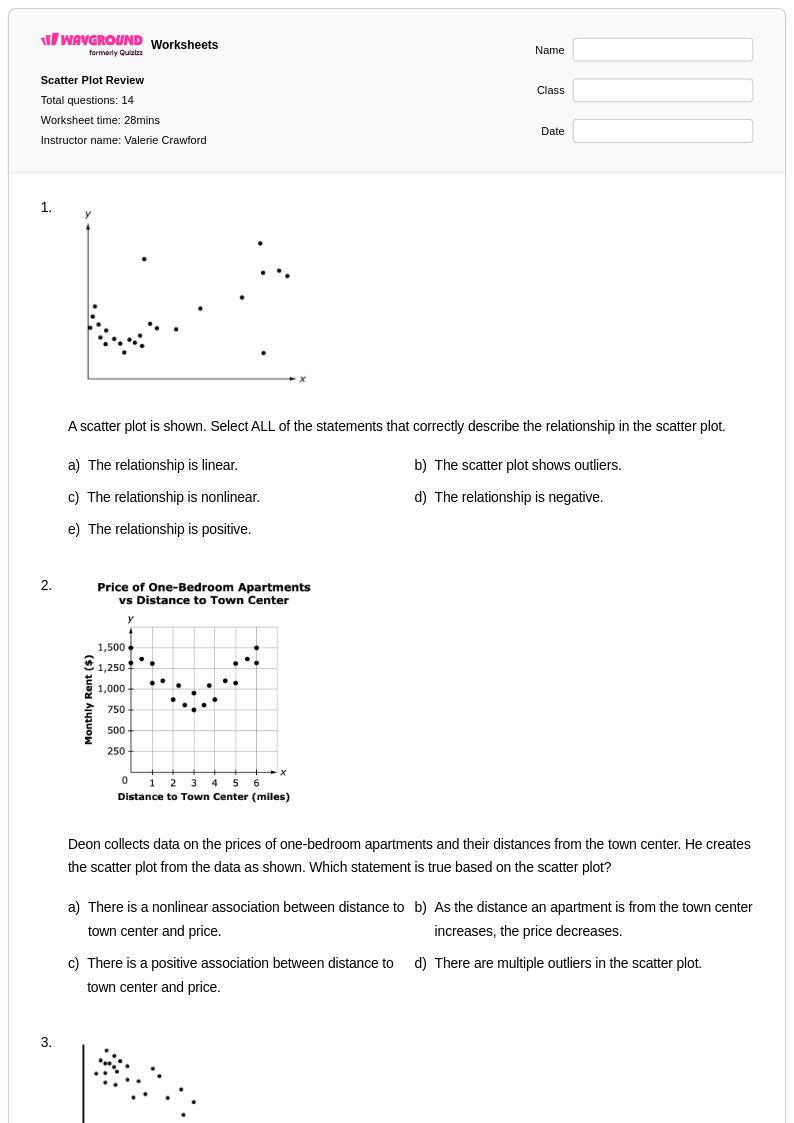
14Q
7th - 9th
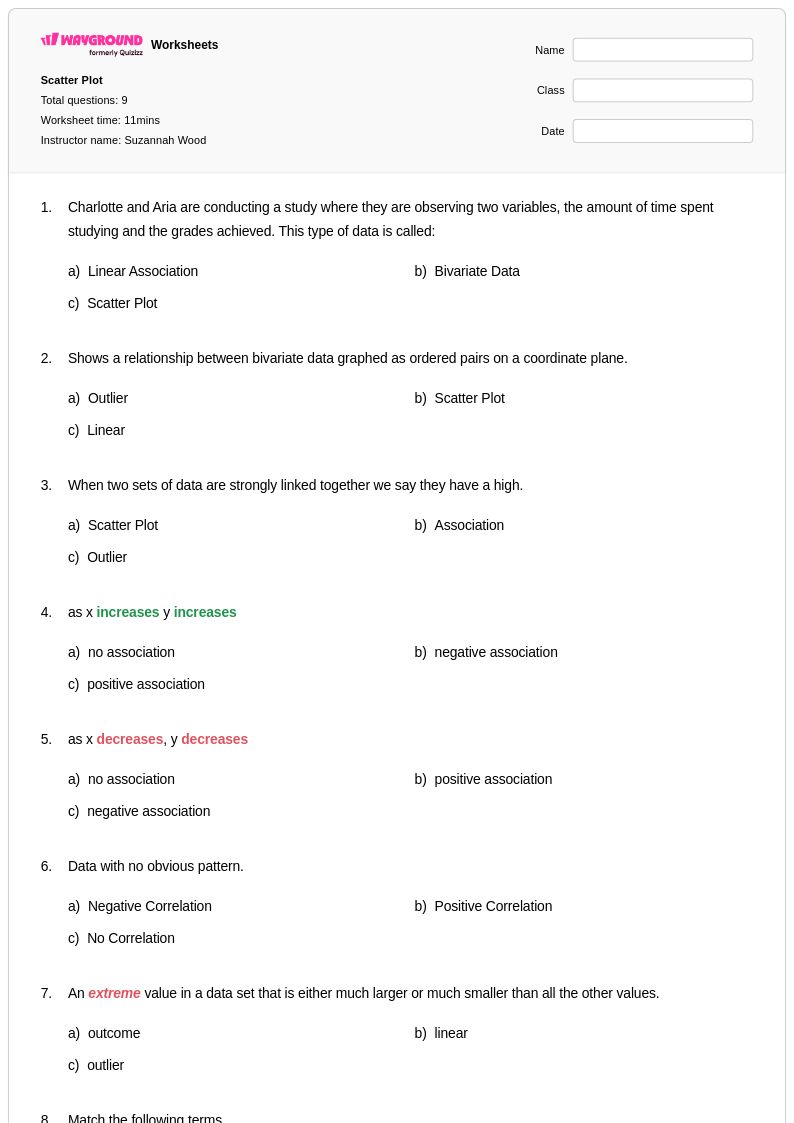
9Q
7th - 12th
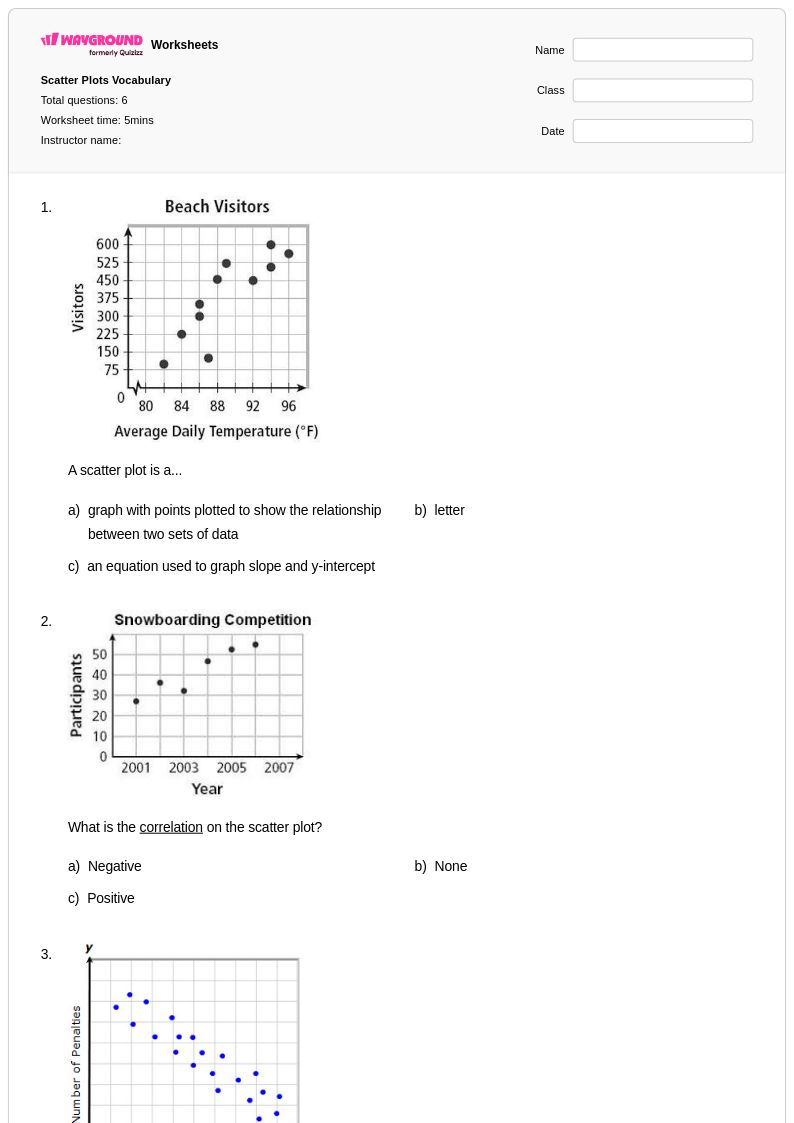
6Q
6th - 8th
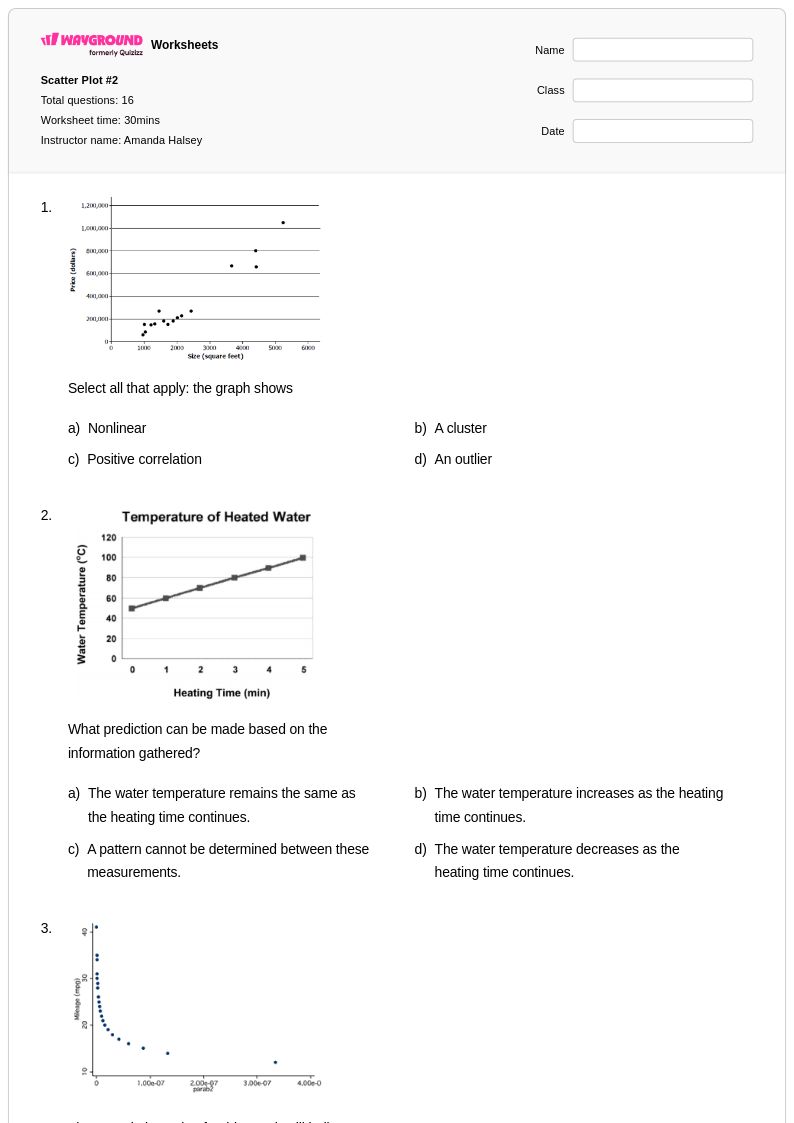
16Q
6th - 8th
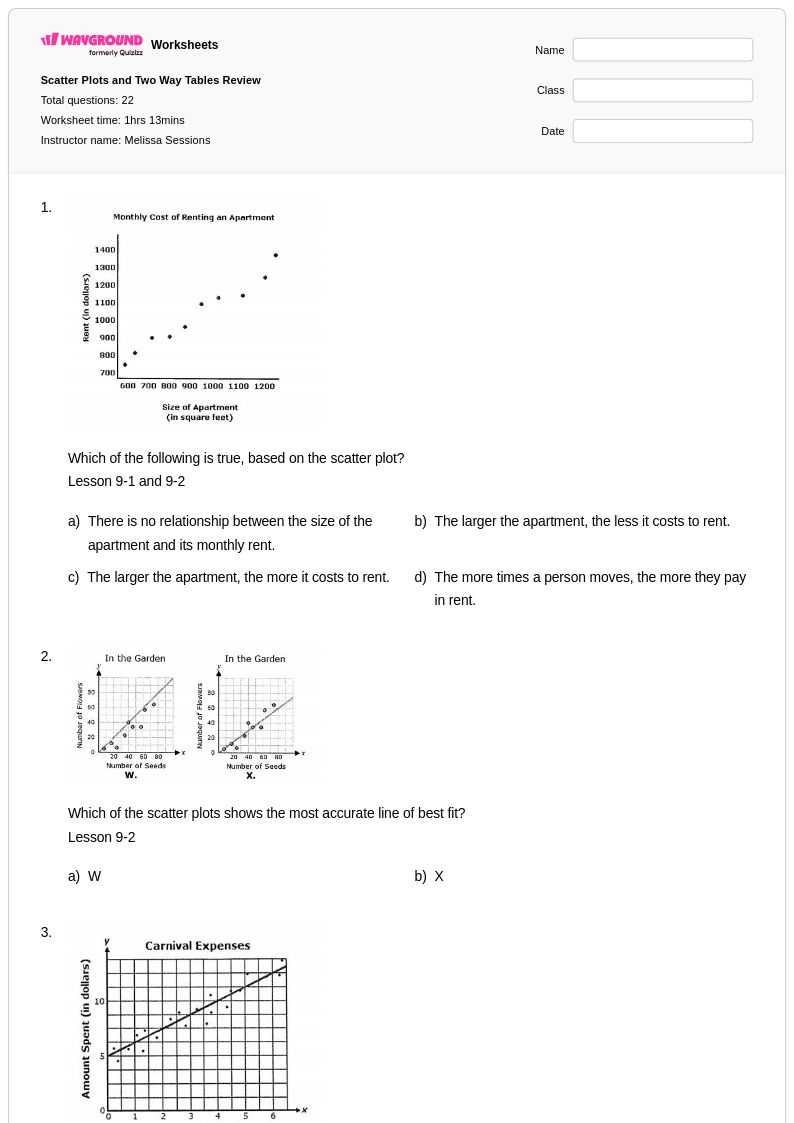
18Q
6th - 8th
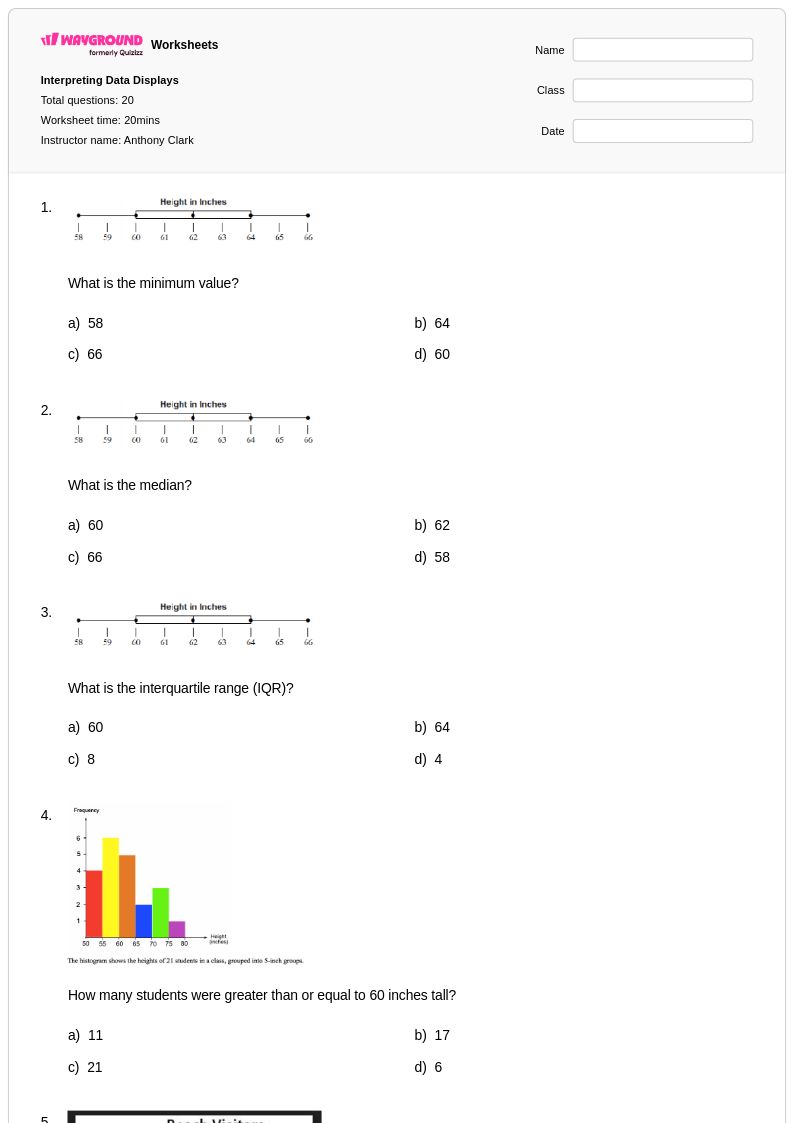
20Q
6th - Uni
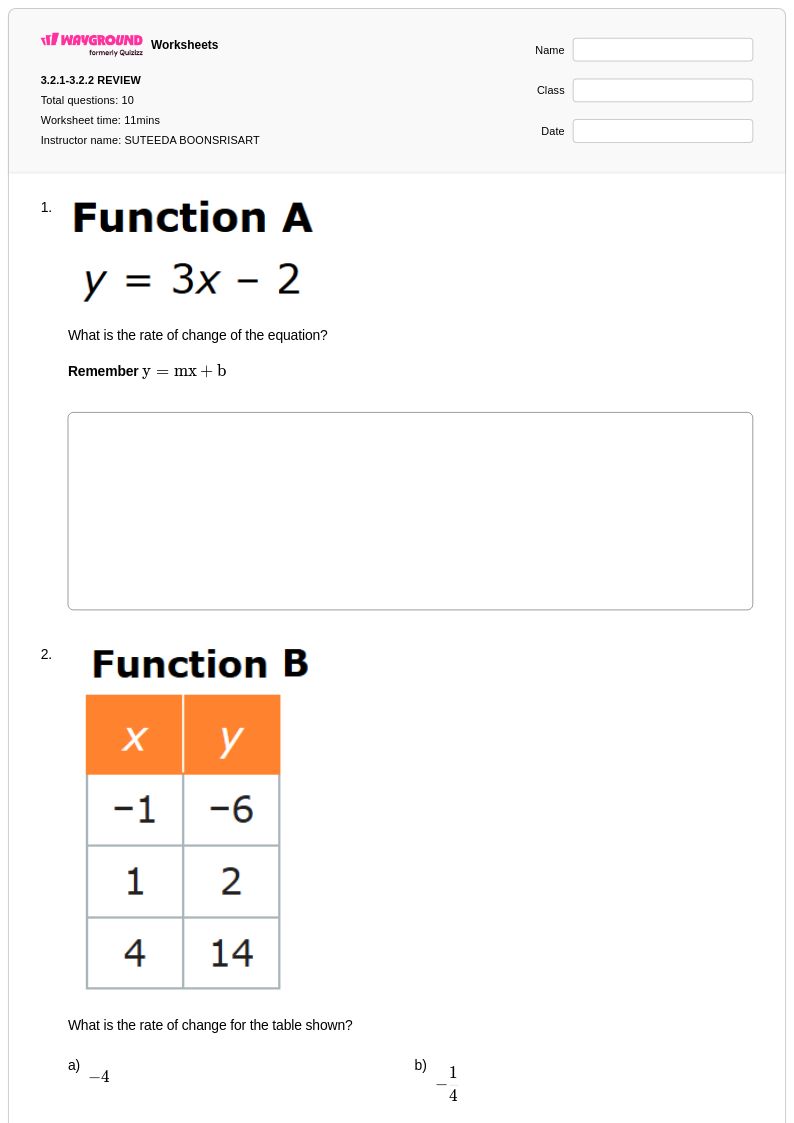
10Q
6th - 8th
Explorar Scatter Plot Correlation hojas de trabajo por grados
Explore otras hojas de trabajo de materias para class 7
Explore printable Scatter Plot Correlation worksheets for Class 7
Scatter plot correlation worksheets for Class 7 students available through Wayground (formerly Quizizz) provide comprehensive practice in analyzing the relationship between two variables through visual data representation. These expertly designed worksheets strengthen essential mathematical skills including identifying positive, negative, and no correlation patterns, interpreting scatter plot trends, and drawing lines of best fit to make predictions from data sets. Students work through carefully structured practice problems that progress from basic plot reading to advanced correlation analysis, with each worksheet including a detailed answer key to support independent learning and self-assessment. The free printable resources are available in convenient PDF format, making them easily accessible for classroom use, homework assignments, or additional skill reinforcement at home.
Wayground (formerly Quizizz) empowers educators with an extensive collection of millions of teacher-created scatter plot correlation worksheets specifically designed for Class 7 mathematics instruction. The platform's robust search and filtering capabilities allow teachers to quickly locate resources aligned with curriculum standards and student ability levels, while built-in differentiation tools enable seamless customization of content difficulty and complexity. These versatile worksheets are available in both printable PDF and interactive digital formats, providing flexible options for diverse learning environments and teaching preferences. Teachers can efficiently plan targeted lessons, implement remediation strategies for struggling learners, offer enrichment opportunities for advanced students, and provide consistent skill practice that builds mathematical confidence in data analysis and graphical interpretation.
FAQs
What is the focus of scatter plots in 7th grade?
How do I teach the "line of best fit" informally?
What skills do these 7th-grade scatter plot worksheets build?
What misconceptions might 7th graders have about trend lines?
How can I use this worksheet for classwork or homework?