Free Printable Distance and Time Graphs Worksheets for Class 7
Class 7 distance and time graphs worksheets from Wayground help students master interpreting motion data through engaging printables, practice problems, and comprehensive answer keys for effective learning.
Explore printable Distance and Time Graphs worksheets for Class 7
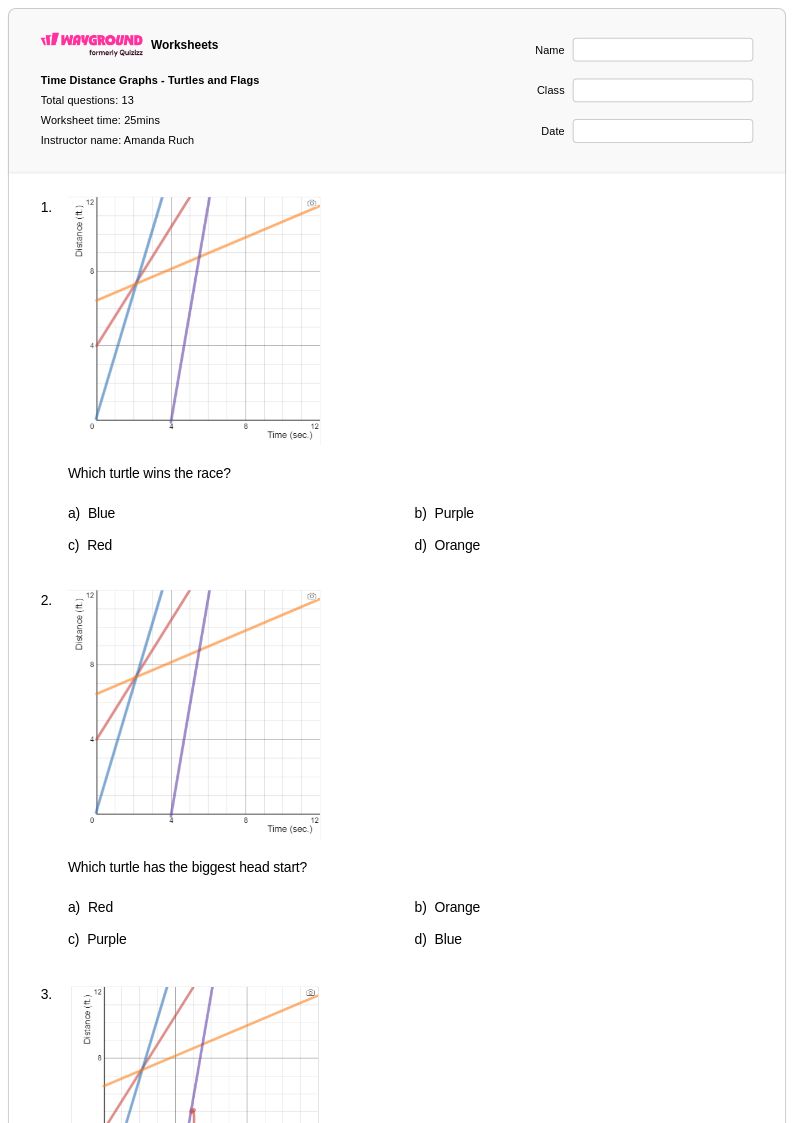
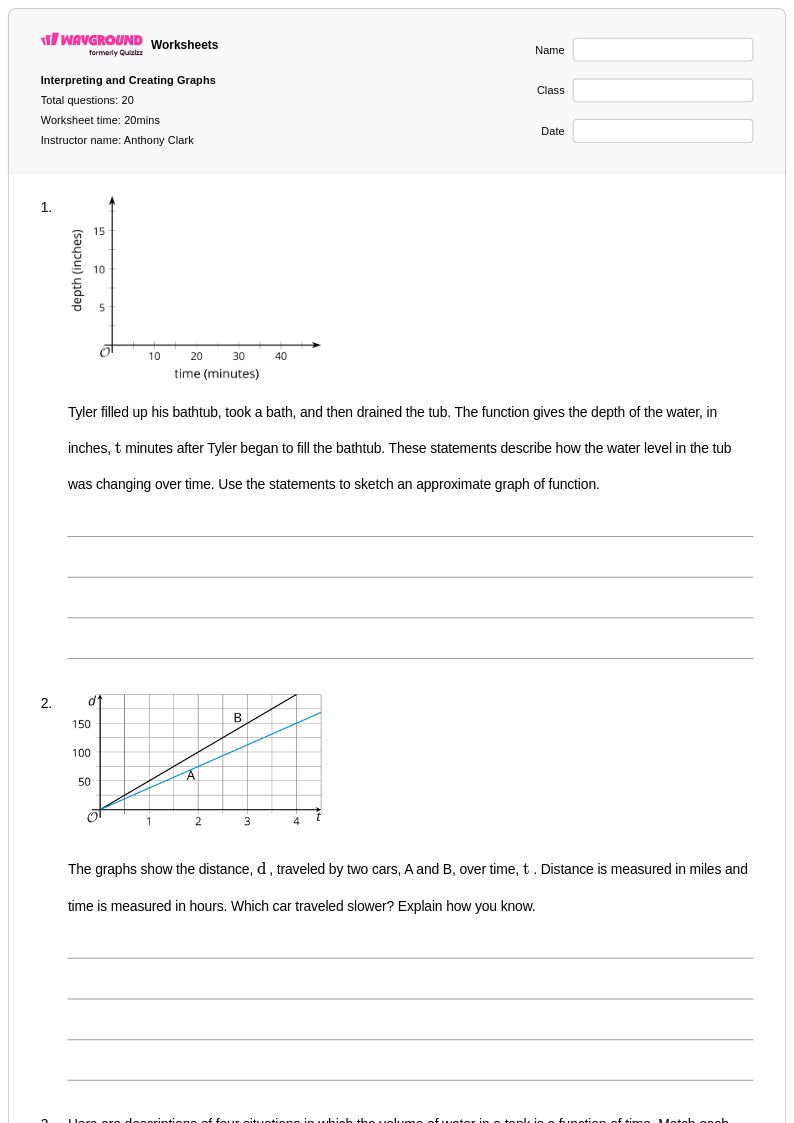
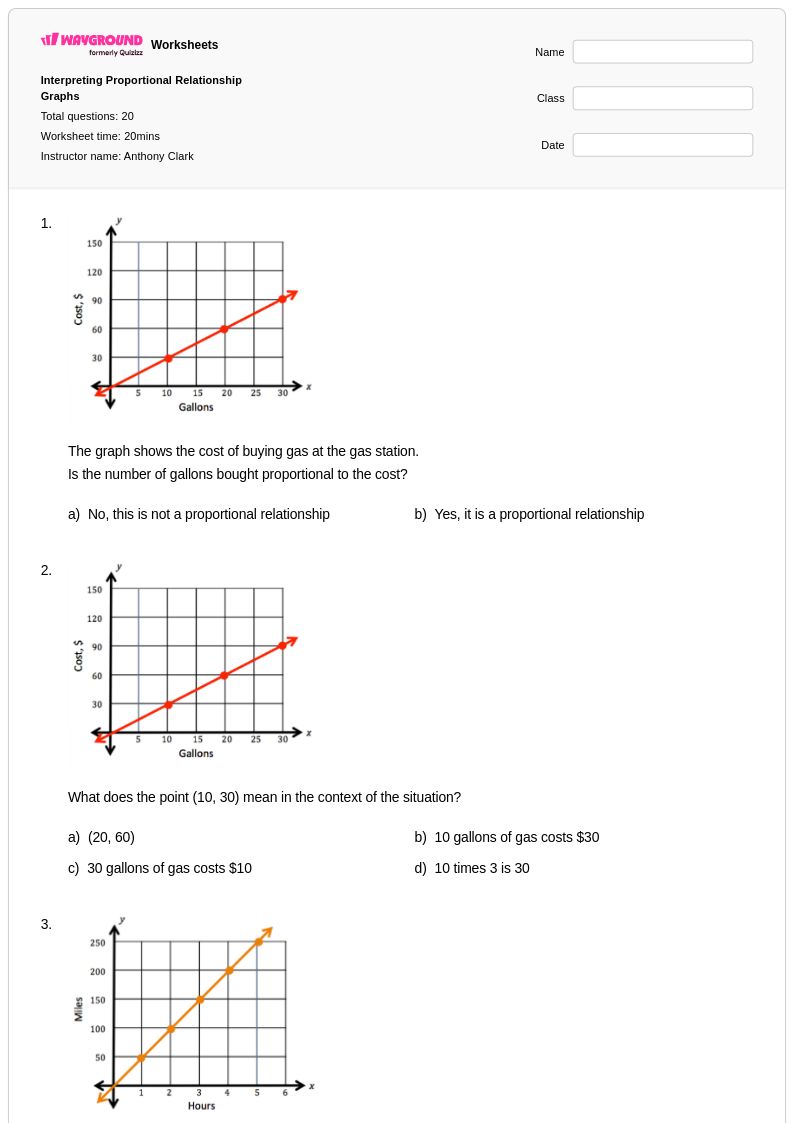
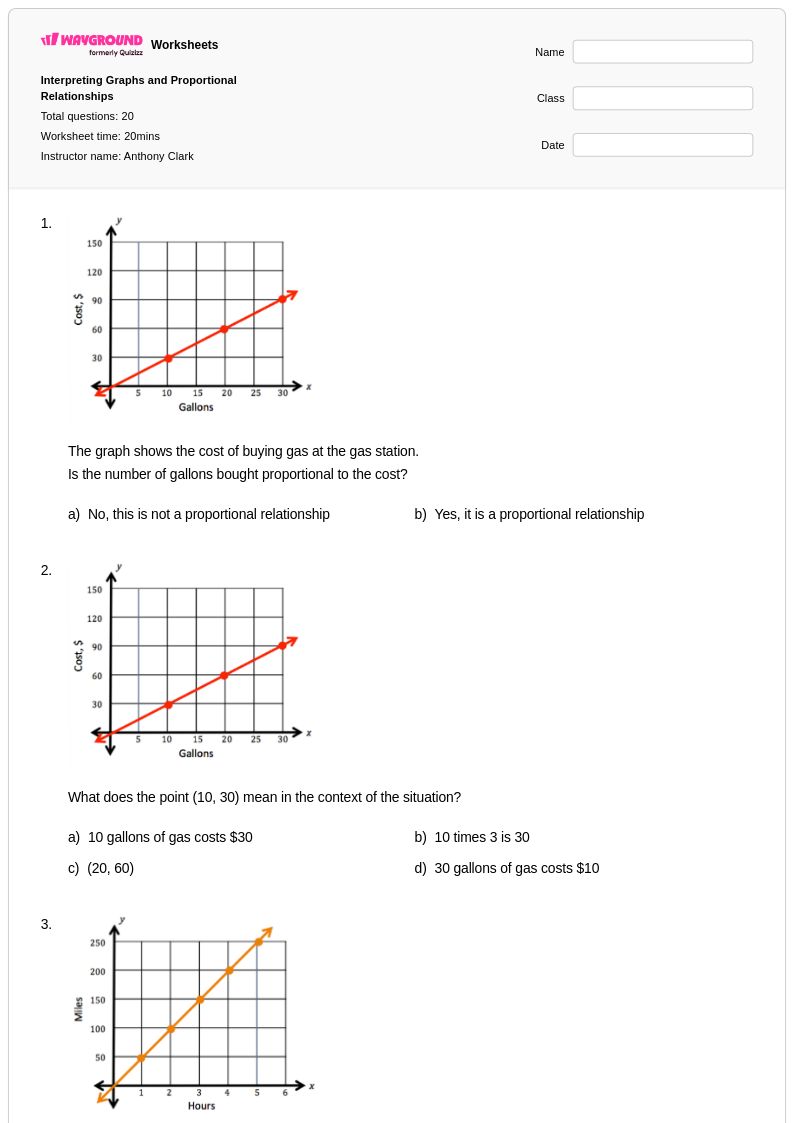
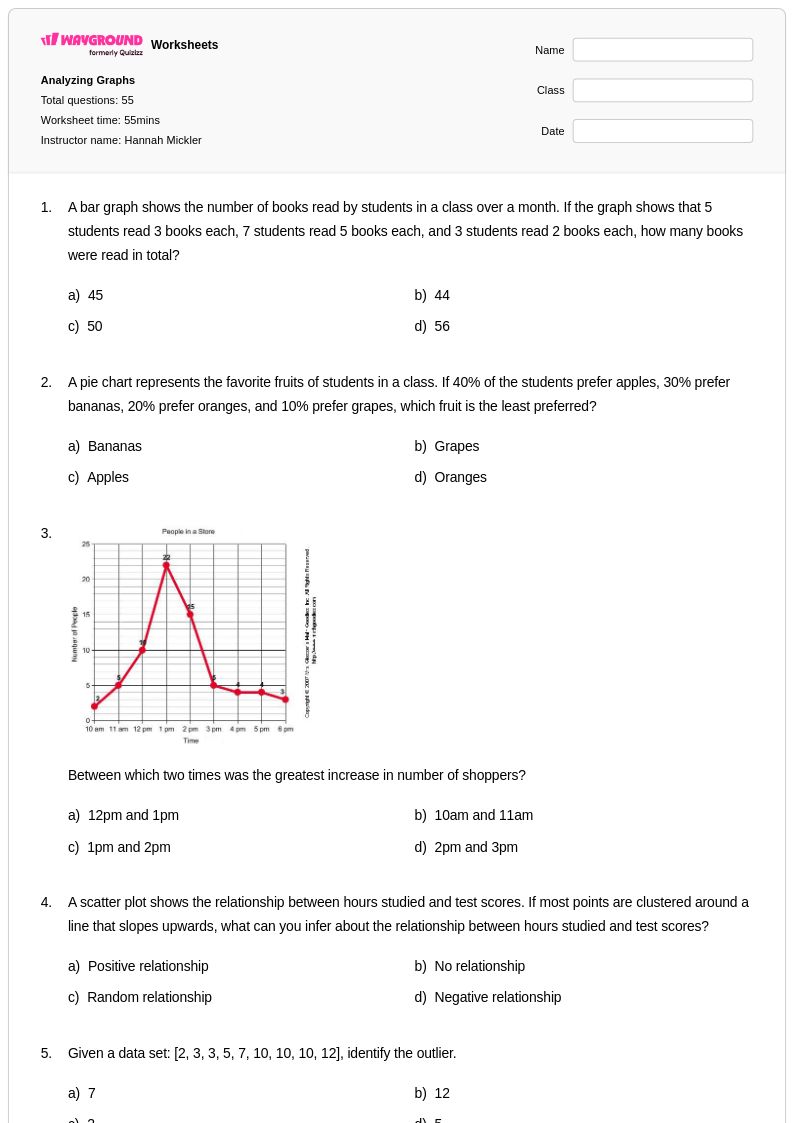
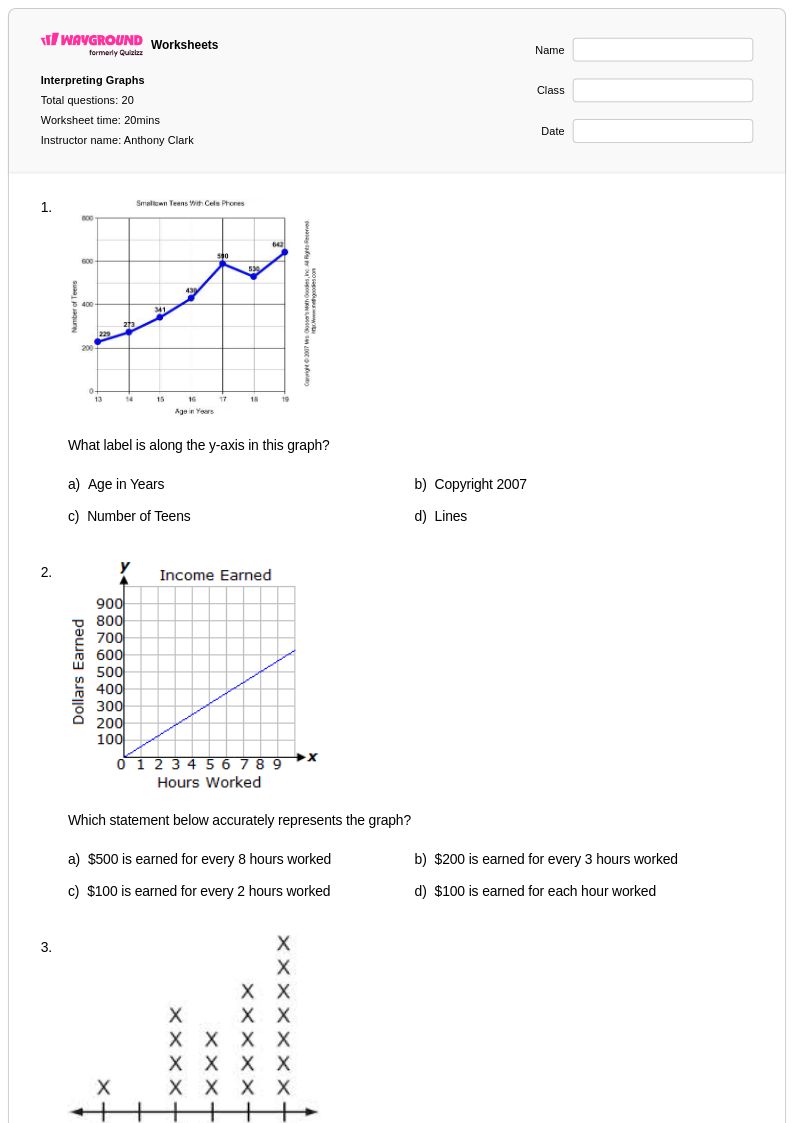
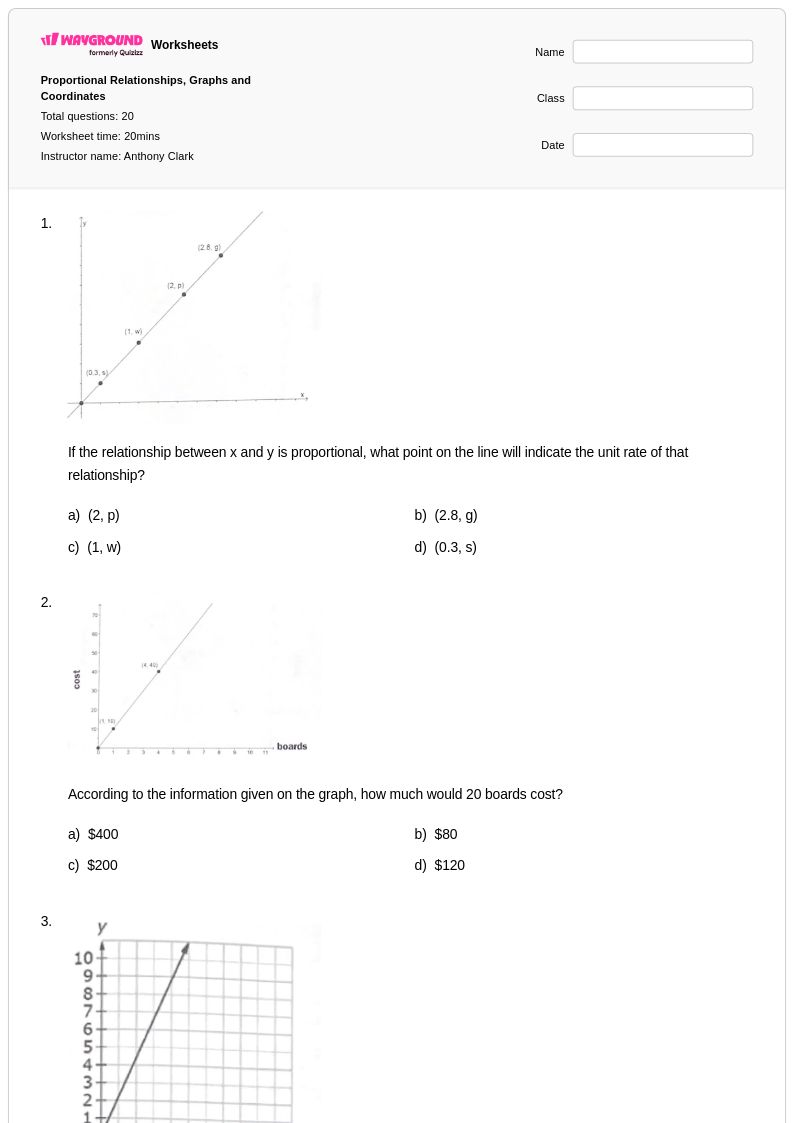
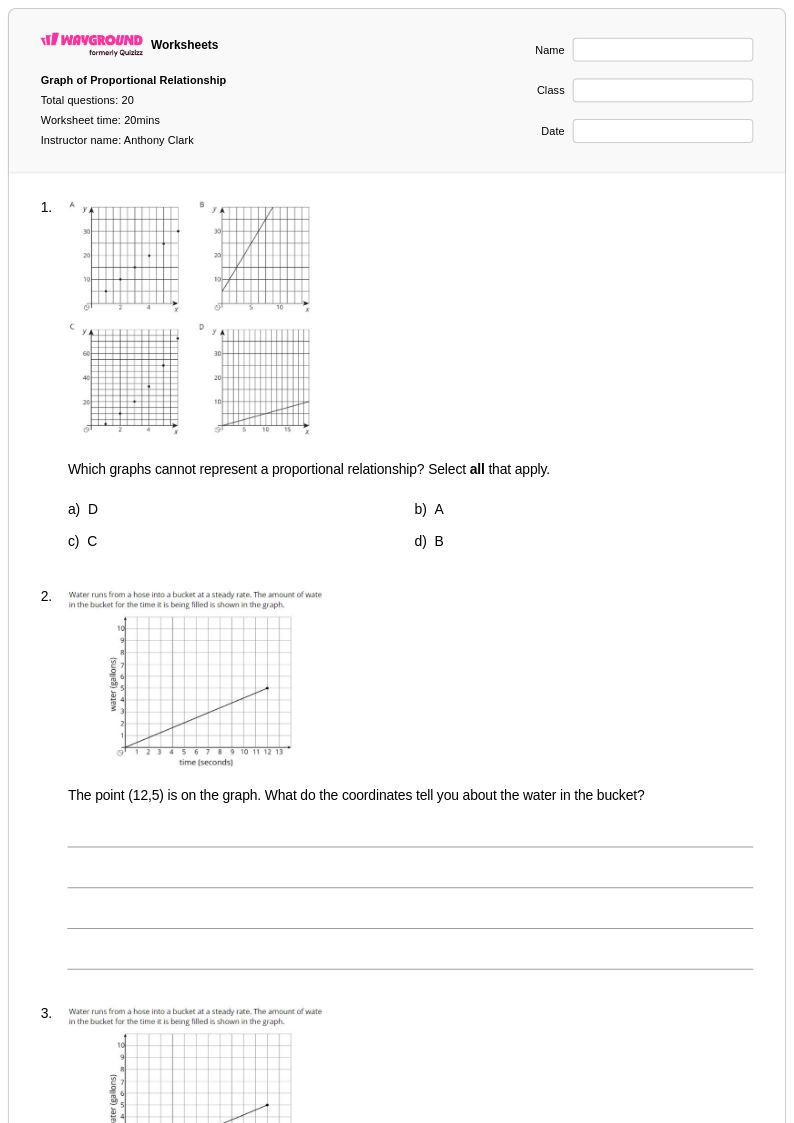
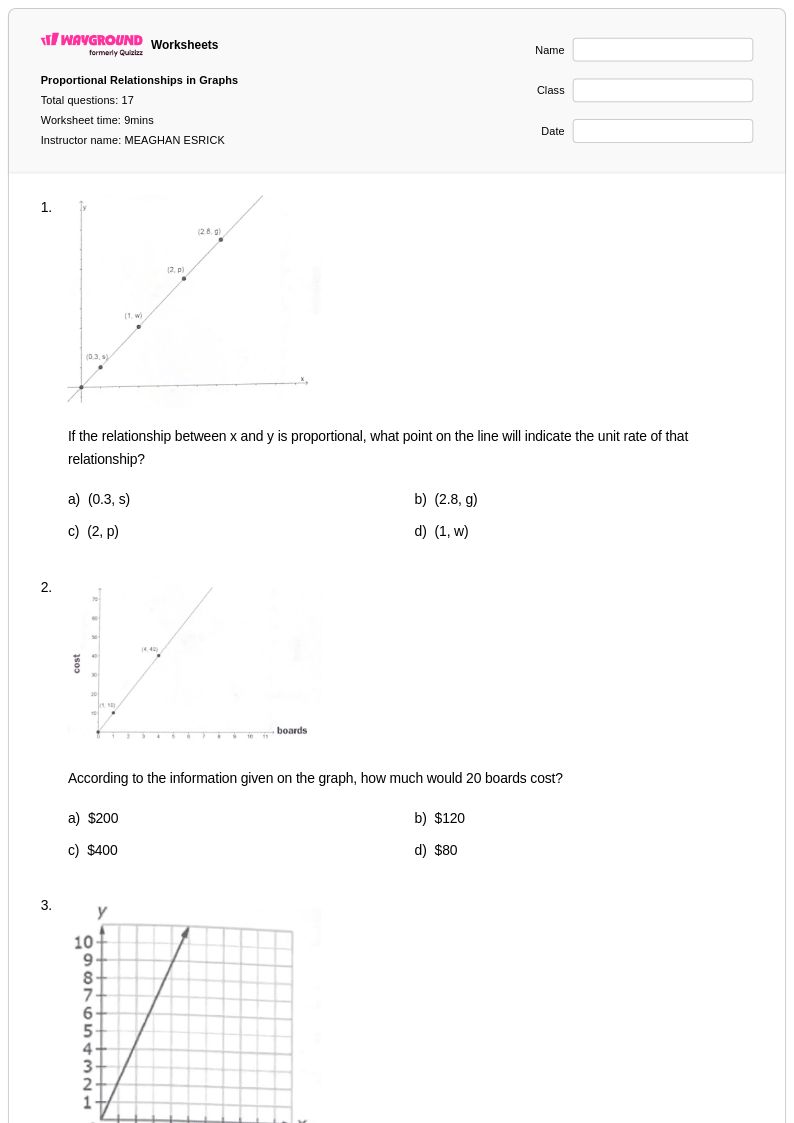
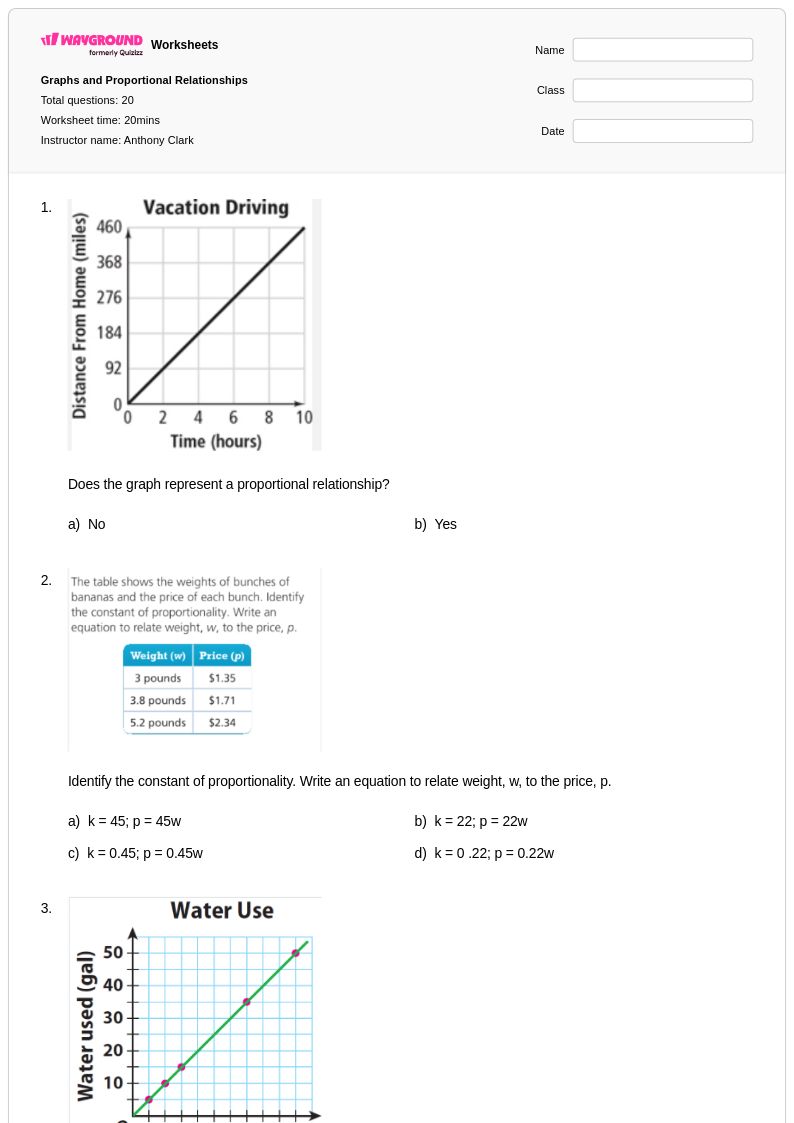
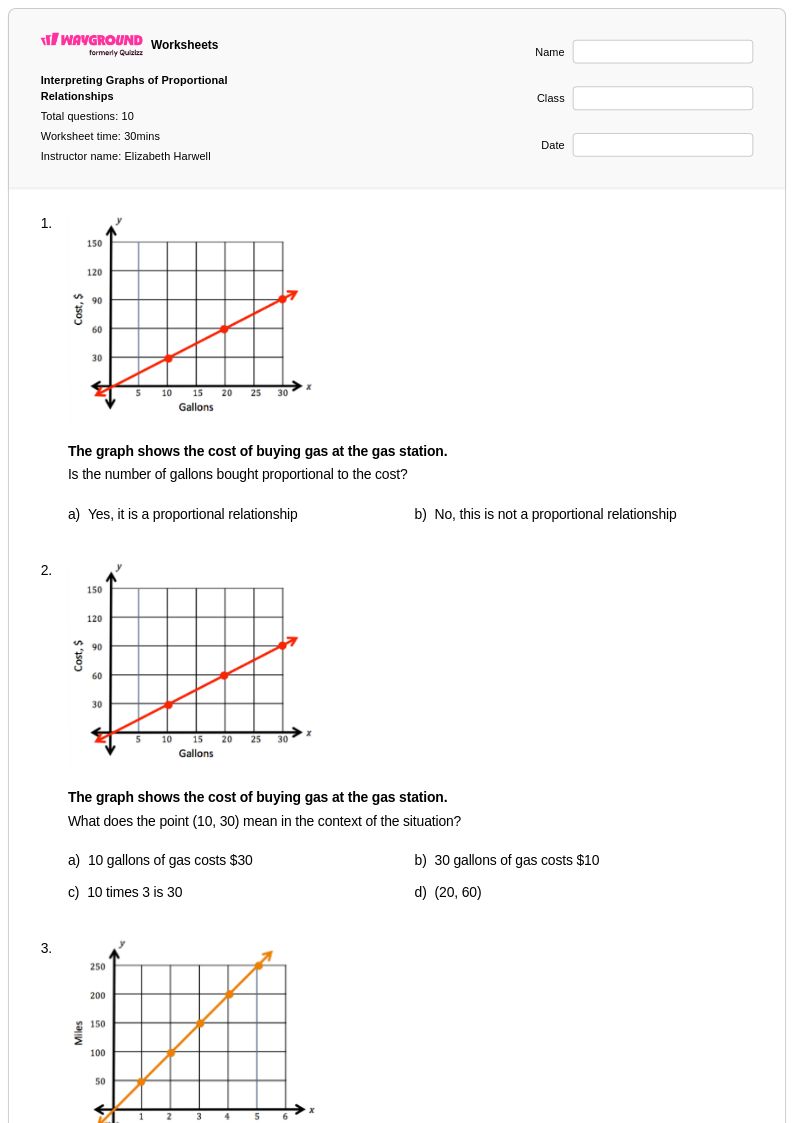
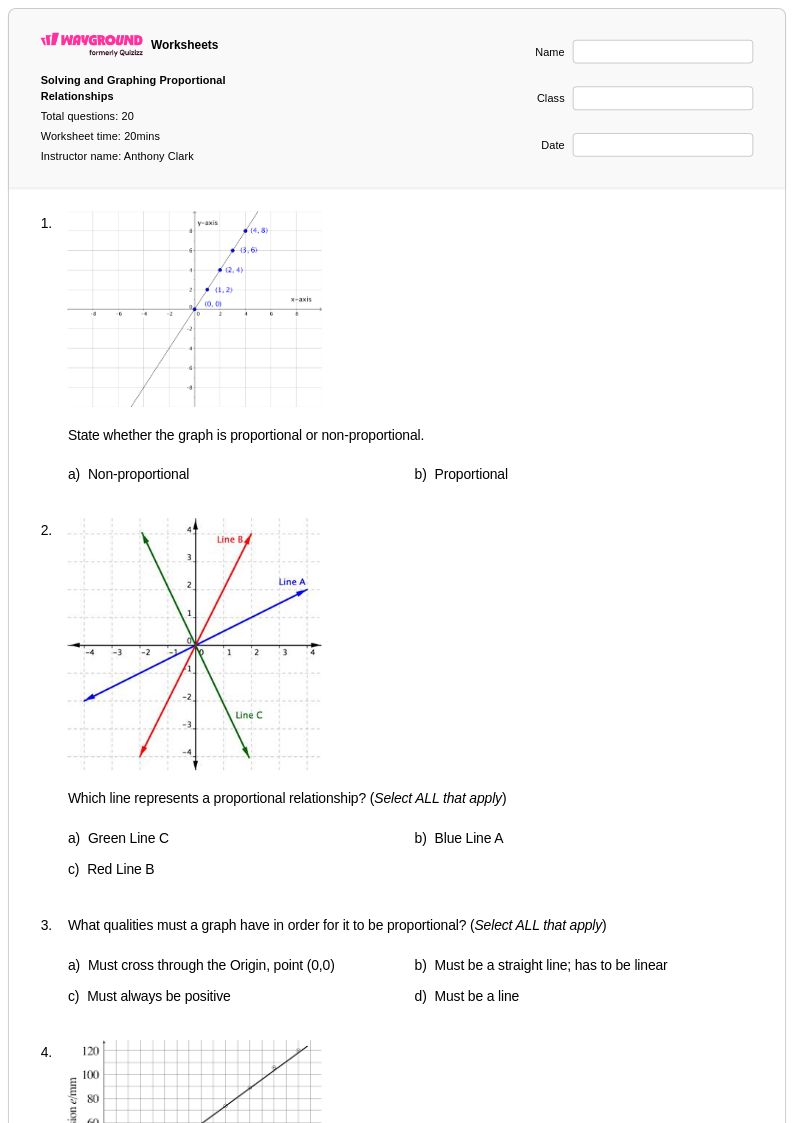
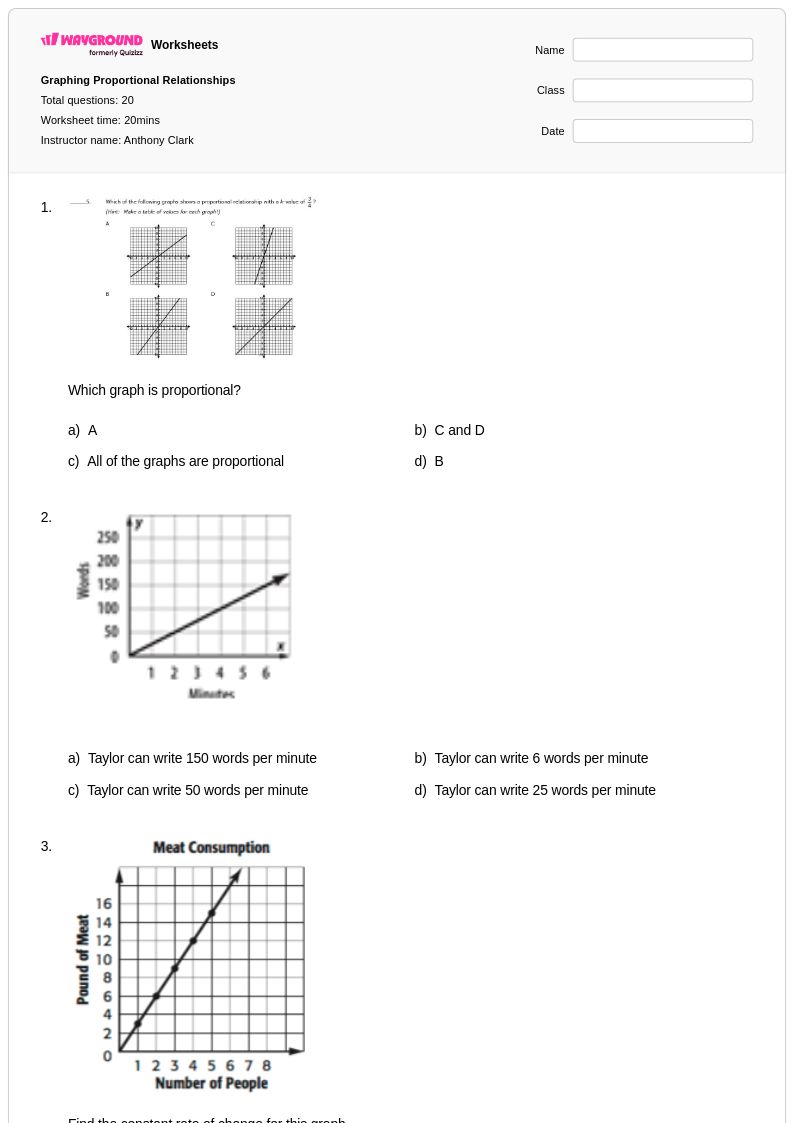
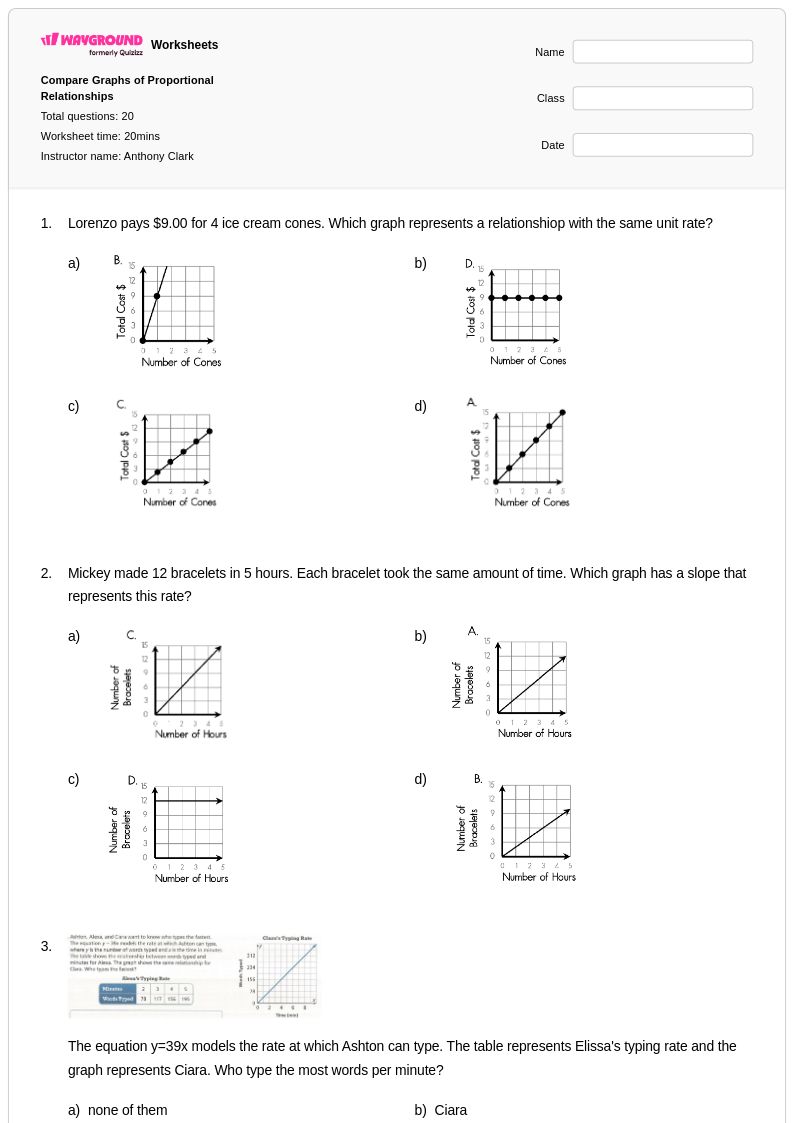
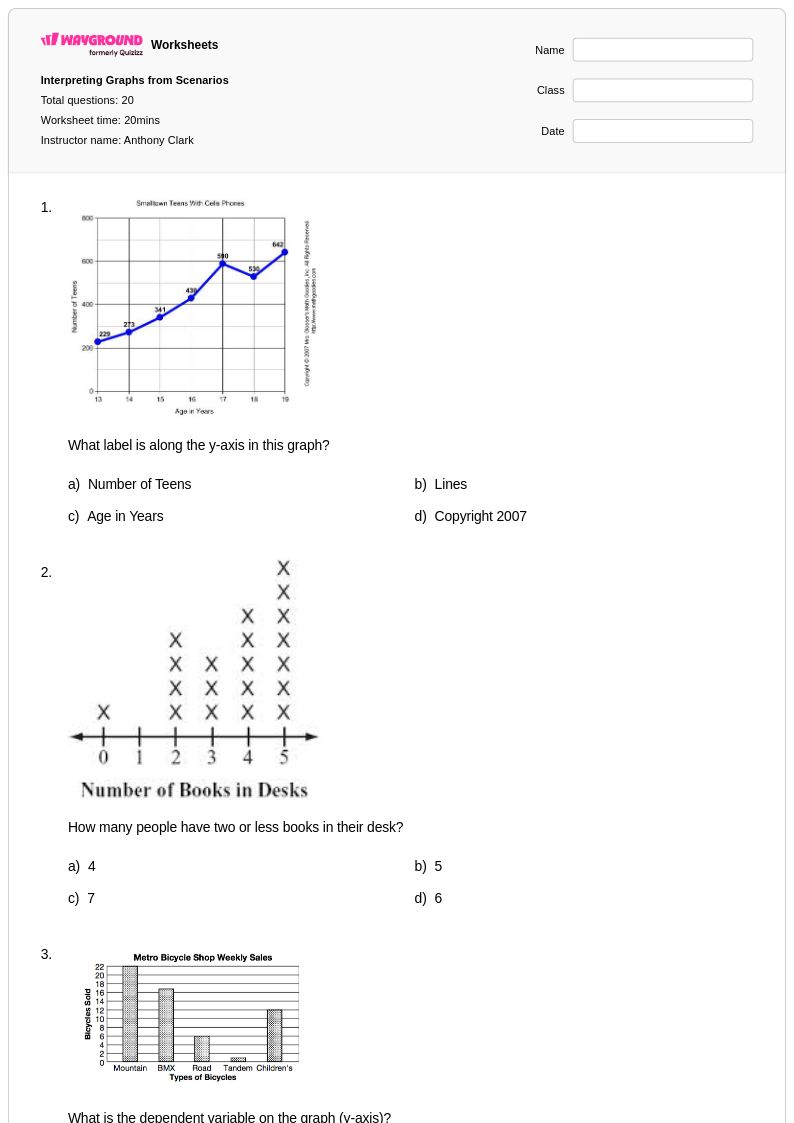
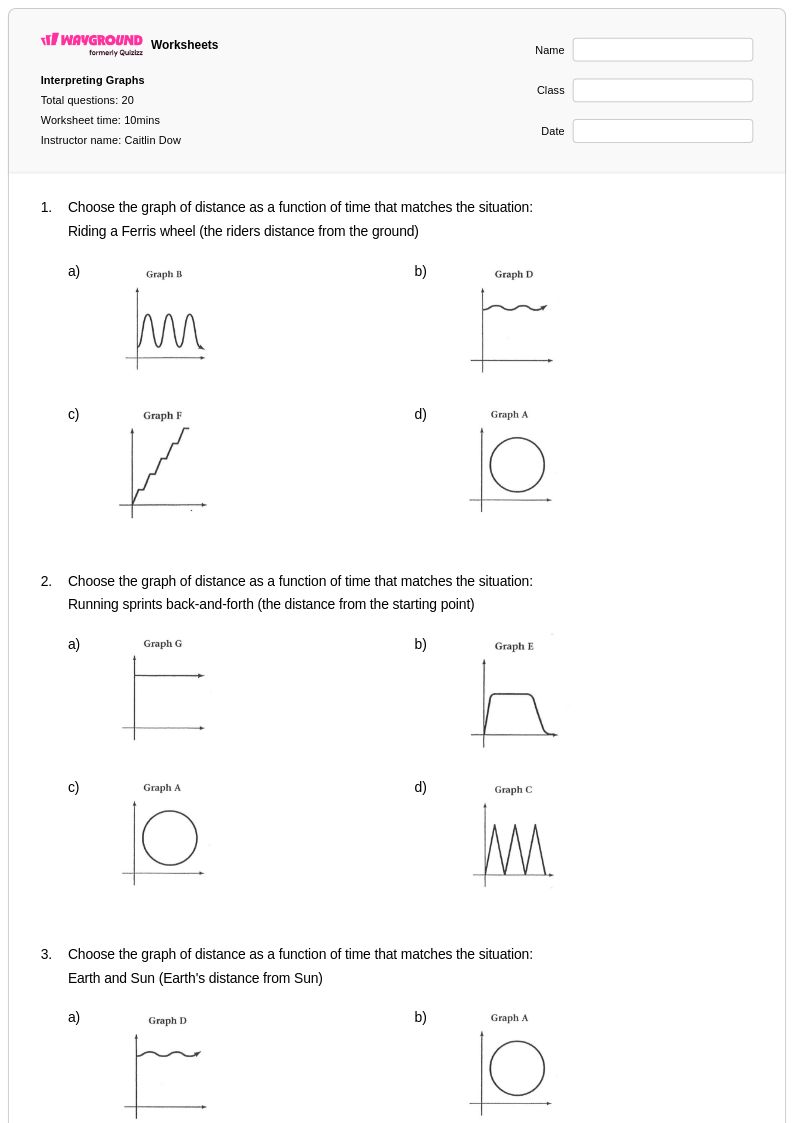
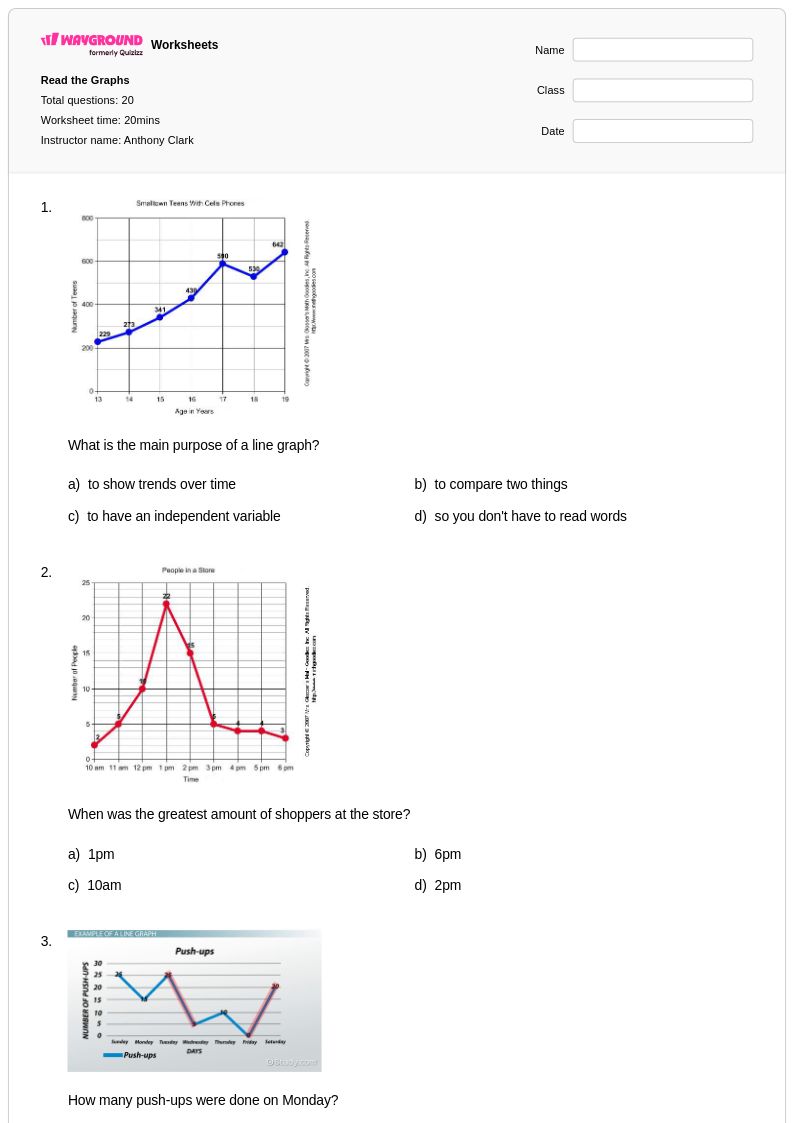
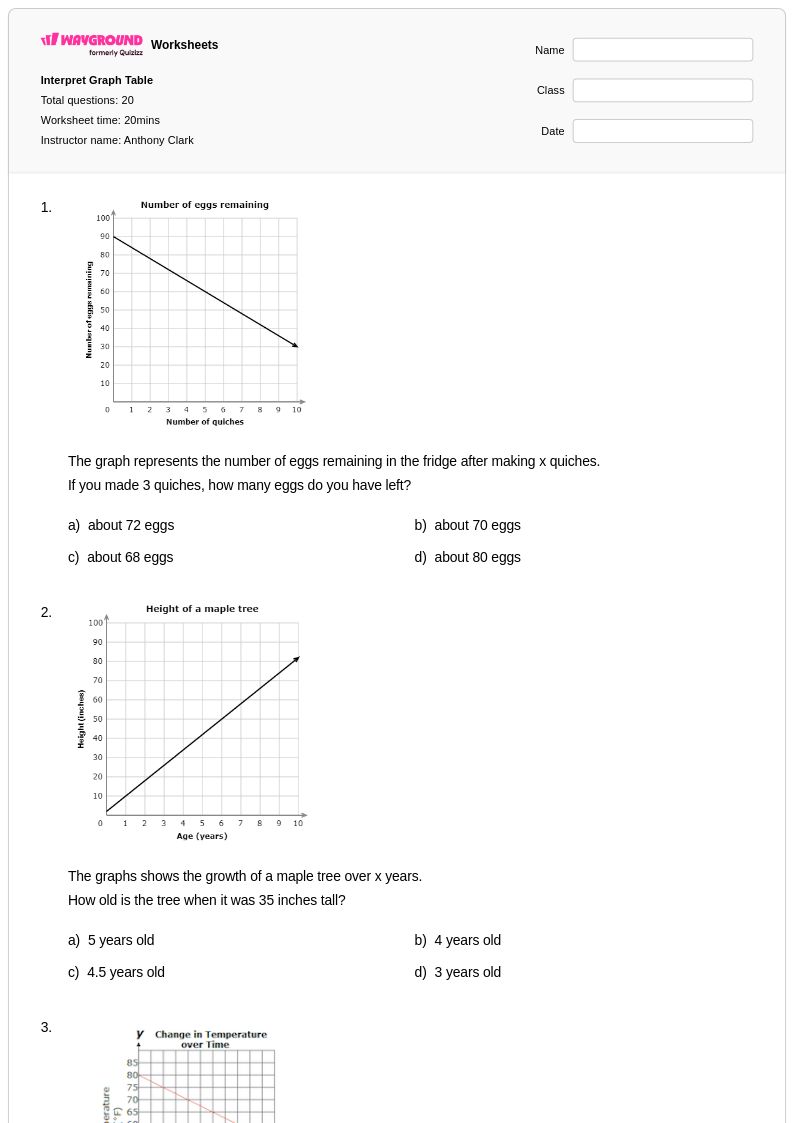
Distance and time graphs provide Class 7 students with essential skills for interpreting and analyzing motion data through visual representations. Wayground's comprehensive collection of distance and time graph worksheets helps students master the fundamental concepts of reading coordinates, calculating speed and velocity, and understanding the relationship between distance traveled and elapsed time. These expertly designed practice problems guide learners through interpreting linear and non-linear motion patterns, identifying periods of acceleration and constant speed, and drawing conclusions about object movement from graphical data. Each worksheet includes a detailed answer key to support independent learning and self-assessment, while the free printable pdf format ensures accessibility for both classroom instruction and home practice.
Wayground's extensive library, featuring millions of teacher-created resources, empowers educators with robust search and filtering capabilities to locate precisely targeted distance and time graph materials aligned with Class 7 mathematics standards. Teachers can easily differentiate instruction by selecting worksheets that match individual student needs, whether for remediation of basic graphing concepts or enrichment through complex motion analysis problems. The platform's flexible customization tools allow educators to modify existing worksheets or create personalized practice sets, while the dual availability in both printable and digital pdf formats accommodates diverse classroom environments and learning preferences. These comprehensive resources streamline lesson planning and provide ongoing opportunities for skill reinforcement, enabling teachers to effectively address varying proficiency levels within their mathematics instruction.
FAQs
How do I teach distance-time graphs in Grade 7?
By Grade 7, students should already be comfortable with the idea that slope represents speed. The instructional focus shifts to comparing multiple objects on the same graph, interpreting non-constant motion (a curve rather than a straight line), and calculating average speed over an interval. A good entry point is giving students two overlapping lines on one graph and asking: which object is faster? When do they meet? Those questions push students to read the graph analytically rather than just describe it.
What exercises help Grade 7 students practice distance-time graphs?
Three types of practice work well at this level: interpreting multi-segment graphs (constant speed, then stopped, then faster), calculating speed from slope for specific segments, and constructing a graph from a written scenario. Wayground's Grade 7 worksheets move through these progressively, with answer keys included so students can self-check before moving on.
What errors do Grade 7 students commonly make on distance-time graph problems?
The flat-line misconception (stationary = moving slowly) persists from earlier grades and is worth revisiting. At Grade 7, a new error emerges: when calculating speed from a graph, students often read coordinates incorrectly — they pick a single point rather than computing rise over run between two points. Another common slip is confusing distance-time graphs with speed-time graphs, especially once both appear in the same unit.
How do I use Wayground's Grade 7 distance-time graph worksheets?
Assign them digitally through Wayground for instant submission and auto-scoring, or print the PDF for paper-based practice. Every worksheet includes a complete answer key. If you print and collect paper submissions, the Wayground for Teachers app lets you scan student work for grading — no manual re-entry needed.
How do distance-time graphs fit into the Grade 7 Common Core progression?
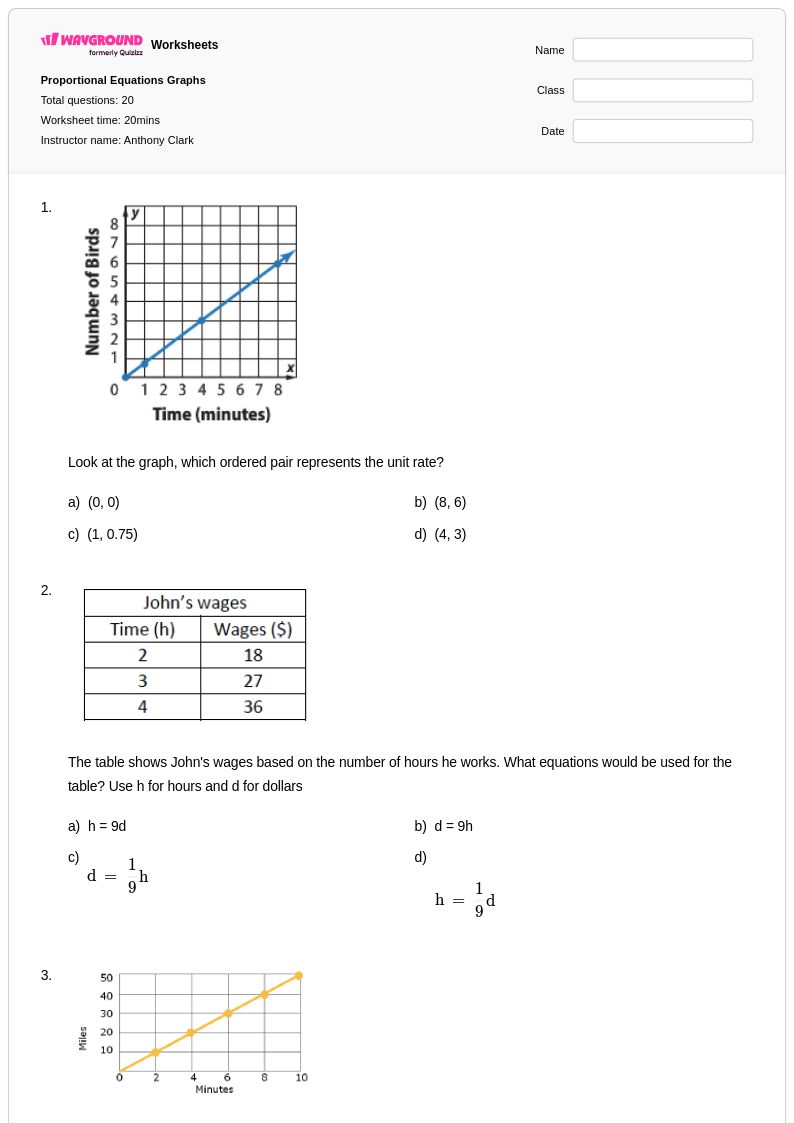
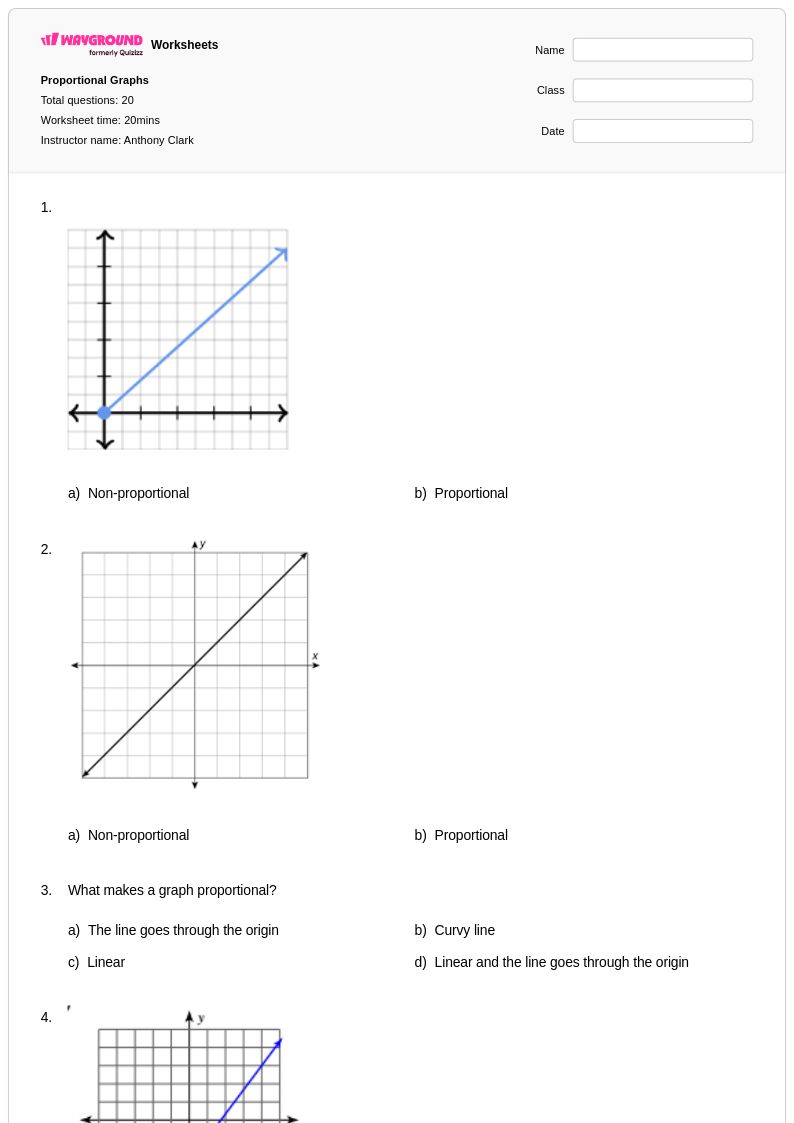
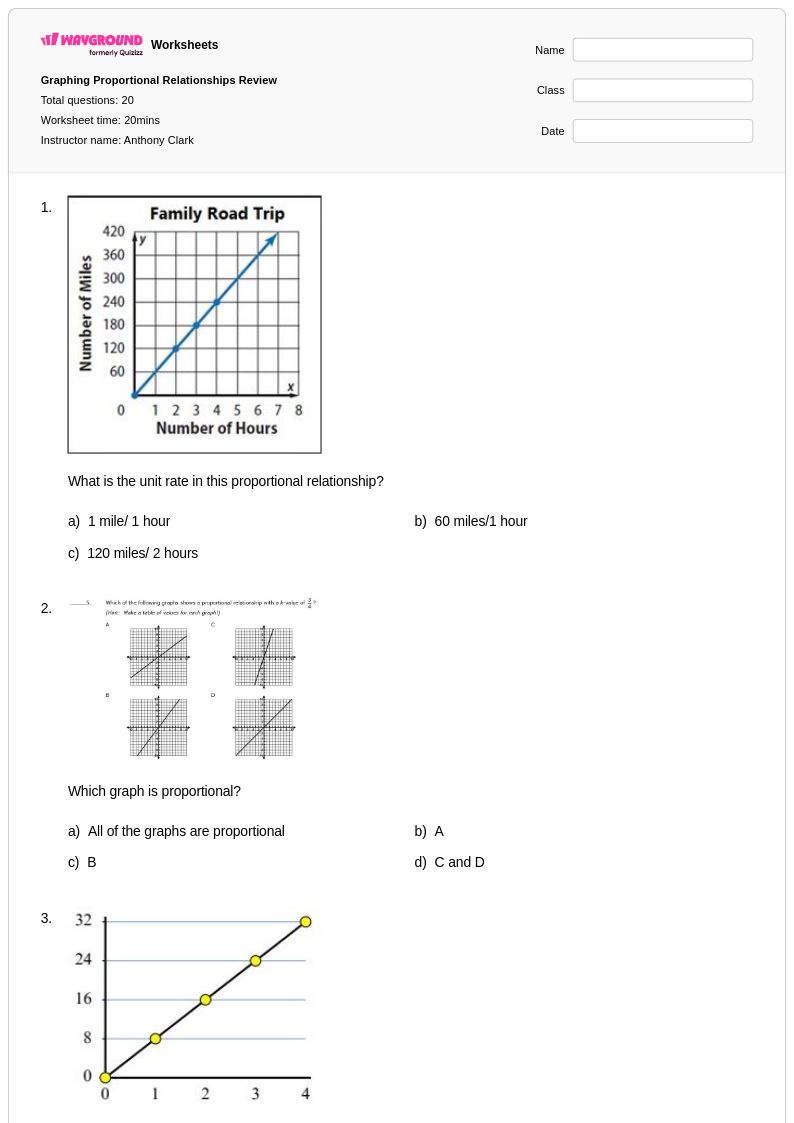
Grade 7 is where Common Core expects students to work fluently with proportional relationships and their graphical representations. A distance-time graph with constant speed is a proportional relationship — the line passes through the origin and the slope is the unit rate (speed). This makes distance-time graphs a direct application of the Grade 7 proportionality standard. The concept also sets up Grade 8 work on linear functions, where students generalize from specific graphs to equations of the form y = mx.
Can I differentiate these worksheets for students at different levels?
Yes. For students who need more support, Wayground's reduced answer choices option limits the number of options displayed, which helps students who are overwhelmed by open-ended graph questions. For layout accessibility, you can generate an alternate version of the same worksheet with larger font or wider spacing — same problems, easier to read. Advanced students can be directed to multi-segment or non-linear graph problems within the same worksheet collection without needing a separate assignment.