
 Worksheets
APES - Population
Total questions: 42
Worksheet time: 31mins
A group of individuals of the same species living in the same area is a/an
population
community
ecosystem
biome
Which of the following would increase population size? mark all that apply
immigration
emigration
increased birth rates
increased death rates


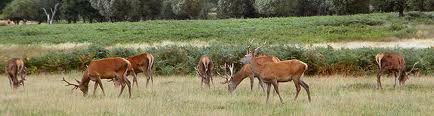
When the availability of food, water, space and shelter become less than what populations need.
carrying capacity
limiting factor
exponential growth
population density


Which limiting factor would increase due to an increase in population density?
Unusual weather
Natural disaster
Births
Disease

What does the graph represent?
Emigration
Exponential growth
Immigration
Logistic Growth


Water lilies do not grow in desert sand because water availability to these plants in a desert is
a limiting factor.
a competition factor.
the logistic growth curve.
the carrying capacity.
Which of the graphs below shows exponential growth?


Which of the graphs below shows logistical growth?

Based on this age structure, which of the following countries would be predicted to have rapid growth in the upcoming generations?
Bulgaria
Saudi Arabia
Austria
Greece
Which of the following statements about total fertility rate is correct
TFR is equal to the crude birth rate minus the crude death rate.
TFR is the average number of children each woman must have to replace the current population.
TFR is generally higher in developed countries than in developing countries
TFR is equal to the growth rate of a country
TFR is the average number of children each woman will give birth to during her childbearing years.
Using the rule of 70, a population growing at 10% would double in
7 years
10 years
17 years
15 years
not enough information to tell

Identify two main contributors for the dramatic increase in the world population over the last century.
increased access to birth control
development of modern medicine
increased immigration
introduction of the Industrial Revolution

Estimated growth rate of organisms living under optimal conditions
biotic potential
boom & bust (cyclic)
linear (constant) growth
logistic growth
I. They produce many offspring in a short period of time.
II. They have very low survivorship early in life.
III. They take a long time to reach reproductive maturity.

Which curve best describes an organism that invests a lot of energy in parenting?

Even if a country reduces its birth rate and maintains replacement-level fertility, its population will still continue to grow for several decades because of
lower death rates
increased income.
population momentum
better health care.
increased life expectancy.
Populations whose age structure diagrams are narrower at the bottom than at the top have
high death rates
the same proportion of individuals in each age group
a declining population
a high growth rate
all of the above
A metropolitan region of 100,000 people has 2000 births, 500 deaths, 200 emigrants, and 100 immigrants over a 1-year period. Its population growth rate is
1.2 percent.
1.4 percent
1.6 percent.
1.8 percent.
2.0 percent.

Tracks organisms that tend to live long lives (low death rate and high survivorship rate); toward the end of their life expectancies, however, there is a dramatic increase in the death rate. (type I = blue line, type II = red line, type III = green line, type IV is none of the lines)
Type I
Type II
Type III
Type IV
Describes organisms with a high death rate (or low survivorship rate) immediately following birth. Examples include bacteria, fishes, and invertebrates. (type I = blue line, type II = red line, type III = green line, type IV is none of the lines)
Type I
Type II
Type III
Type IV
What is the Total Fertility Rate (TFR) of a population at replacement level?
1
2
3
4
Which of the following is necessary for a country to progress to stage 3 in the DTM?
Industrial revolution
Increased education for women
Increased access to health care
Increased access to food

