wayground logo

Free Printable Worksheets

Font size

S
M
L
XL
Worksheets

Storms and Predicting the Weather

Total questions: 60

Worksheet time: 2hrs 2mins

Name
Class
Date
1.

How are hurricanes put into categories?

a)

the amount of rain that falls

b)

how big the center eye is

c)

how fast the wind speed is

d)

if the water is cool or warm

2.

A rotating storm with wind speeds over 119 km/h (74 mph) is...

a)

Tornado

b)

Hurricane

c)

Thunderstorm

d)

Tsunami

3.

Why do hurricanes rotate?

a)

the coriolis effect

b)

continental deflections

c)

global winds

d)

the sun

4.

A huge mass of ocean water that floods land by the coast is called

a)

Hurricane

b)

Storm surge

c)

Rain wall

d)

Ocean surge

5.

Which one describes a tornado?

a)

a rotating storm with wind and rain that forms over warm ocean water

b)

a storm that has severe lightning, thunder, and heavy rain

c)

flooding that happens near the coastlines

d)

a rotating column of air with very high wind speed

6.
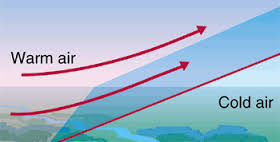
name this front
a)
warm front
b)
cold front
c)
stationary front
d)
occluded front
7.
name this front
a)
warm front
b)
cold front
c)
stationary front
d)
occluded front
8.
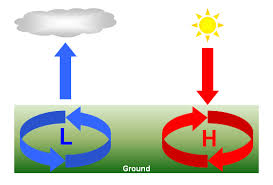
what kind of pressure predicts good weather?
a)
high
b)
low
c)
cold
d)
stationary
9.
There are three forms of precipitation: rain, snow and sleet.
a)
True
b)
False
10.
When two air masses meet, there is a _____, or boundary.
a)
thunderstorm
b)
watch
c)
front
d)
cloud
11.

What is at the center of the hurricane?

a)

nose

b)

mouth

c)

eye

d)

ear

12.

What is a meteorologists?

a)

A person who reports the traffic

b)

A zologist

c)

A person who studies the weather and tries to predict it.

d)

A person who reports the weather on the news.

13.

What is an isobar?

a)

Lines joining on the map that have the same air pressure

b)

Lines joining on the map that have the same tempature

14.

What is an isotherm?

a)

Lines joining on the map that have the same air pressure

b)

Lines joining on the map that have the same tempature

15.

Standard symbols on weather maps show fronts, areas of high and low pressure, types of _______________, and temperatures.

a)

condensation

b)

precipitation

c)

exaltation

16.

What is not a symbol for precipitation?

a)

Sleet

b)

Isobars

c)

Rain

d)

Snow

17.
What is a meteorologist? 
a)
A scientist who studies fossils from ancient times 
b)
A scientist who studies cells and their function in the human body 
c)
A scientist who studies meteors in outer space 
d)
A scientist who studies and tries to predict weather 
18.
What is an isotherm? 
a)
A line on a weather map that connects points of equal air temperature
b)
 A line on a weather map that connects points of equal air pressure
c)
A pattern of weather that shows cloudy skies and precipitation
d)
A pattern of weather that brings clear skies and warm temperatures 
19.
What is an isobar? 
a)
A line on a weather map that connects points of equal air temperature
b)
A line on a map that shows which areas of the United states get more sun 
c)
 A line on a weather map that connects points of equal air pressure
d)
A line of latitude on a map that shows the different zones; tropic, temperate and polar
20.
What types of information are shown on a weather map?
a)
They show states and their capitals and their location in relation to the equator 
b)
They show predicted temperatures, including sun or clouds and types of expected precipitation (rain, snow, etc…)
c)
They show where you could expect an earthquake, tsunami or hurricane to happen 
d)
They show all the different climate types that exist in the United States 
21.
Why can’t meteorologists accurately predict long range weather? (more than 3 days)
a)
Meteorologist do not have the tools necessary to predict the weather for more than 7 days
b)
Weather patterns can shift or change quickly so there are too many uncertain variables that can affect future weather.
c)
Meteorologists are able to predict the weather for an area for up to a month in advance!
d)
Meteorologists can't predict the weather because technology can fail 
22.
Which system results in drier, fairer weather?
a)
high pressure
b)
low pressure
c)
hurricane
d)
weather system
23.

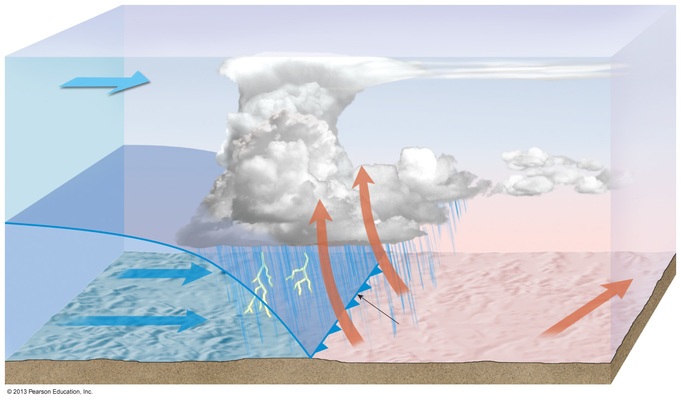
What type of front is shown?

a)

Warm Front

b)

Cold Front

c)

Occluded Front

d)

Stationary Front

24.
Which type of front is pictured?
a)
Cold front
b)
Warm front
c)
Occluded front
d)
Stationary front
25.
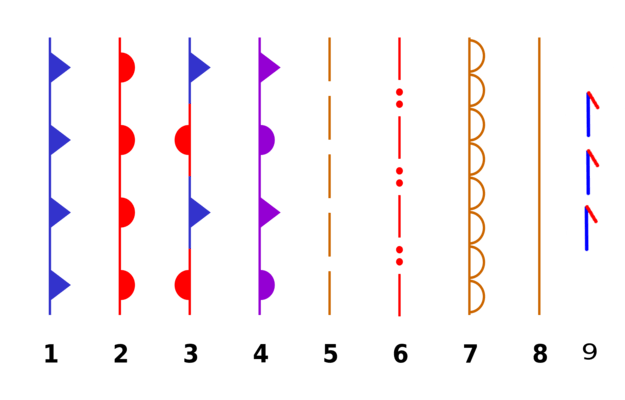
What does symbol # 3 mean?
a)
stationary front
b)
occluded front
c)
warm front
d)
cold front
26.
What type of storm front is this? 
a)
warm front
b)
cold front
c)
stationary front
d)
occluded front
27.
What front symbol is shown? 
a)
Occluded
b)
Stationary
c)
Warm 
d)
Cold
28.
This weather instrument measures the speed of wind.
a)
anemometer
b)
barometer
c)
rain gauge
d)
wind vane
29.
In____________, air moves counter clockwise towards the center of the mass.
a)
cyclone
b)
anticyclone
30.
In____________, air moves clockwise out from the center of the mass.
a)
cyclone
b)
anticyclone
31.
What does this symbol show? 
a)
High pressure
b)
Low pressure
c)
Low humitidy
d)
Longing for someone (strong feelings)
32.
What does this image show? 
a)
Hotness
b)
High altitude
c)
High pressure
d)
Hi five bro!
33.
This symbol represents
a)
a cold front
b)
an occluded front 
c)
a stationary front
d)
a warm front
34.
This symbol represents
a)
a cold front
b)
an occluded front 
c)
a stationary front
d)
a warm front
35.
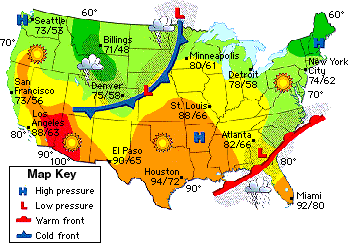
What direction is the cold front moving?
a)
Northwest
b)
Southeast
c)
Northeast
d)
Southwest
36.
Which city is experiencing thunderstorms?
a)
Denver
b)
New York 
c)
Miami 
d)
Boise
37.
Which city has the highest the highest temperature?
a)
Dallas
b)
Chicago
c)
Los Angeles
d)
Miami
38.
Which city is currently experiencing a snow storm?
a)
Seattle
b)
Los Angeles
c)
Chicago
d)
New York
39.
Which city has the lowest temperature on the map?
a)
Minneapolis
b)
Seattle
c)
New York
d)
Denver
40.
Which city has partly cloudy skies?
a)
Boise
b)
New York
c)
Atlanta 
d)
Dallas
41.
Which city is closest to a high pressure system?
a)
New York
b)
Miami
c)
Minneapolis
d)
Boise
42.
Which city is close to a warm front?
a)
Chicago
b)
New York
c)
Boise
d)
Denver
43.
Which city is experiencing cloudy skies and rain?
a)
New York 
b)
Seattle
c)
Dallas
d)
Boise
44.
Choose the best forecast for Los Angeles on Saturday.
a)
cooler temperatures
b)
warmer temperatures 
c)
low pressure
d)
snow
45.
Choose the best forecast for Dallas on Saturday.
a)
thunderstorms
b)
snow
c)
warmer temperatures
d)
clear skies
46.
Choose the best forecast for Boise on Saturday.
a)
cloudy 
b)
cooler temperatures
c)
snow
d)
rain
47.
Choose the best forecast for Minneapolis on Saturday.
a)
snow
b)
cloudy skies
c)
hail
d)
sunny skies
48.

You would expect to see clouds forming and possible precipitation

a)

in Utah (the H)

b)

in Florida

c)

in Nebraska (between the H and the L)

d)

in Indiana

49.
A high pressure system is located north of New York City. What type of weather will be experienced there?
a)
clear, sunny skies
b)
cloudy and rainy
50.
A low pressure system is located over Georgia. What type of weather will they have?
a)
clear, sunny skies
b)
cloudy and rainy
51.
What part of the illustration shows Evaporation? 
a)
1
b)
2
c)
3
d)
4
52.
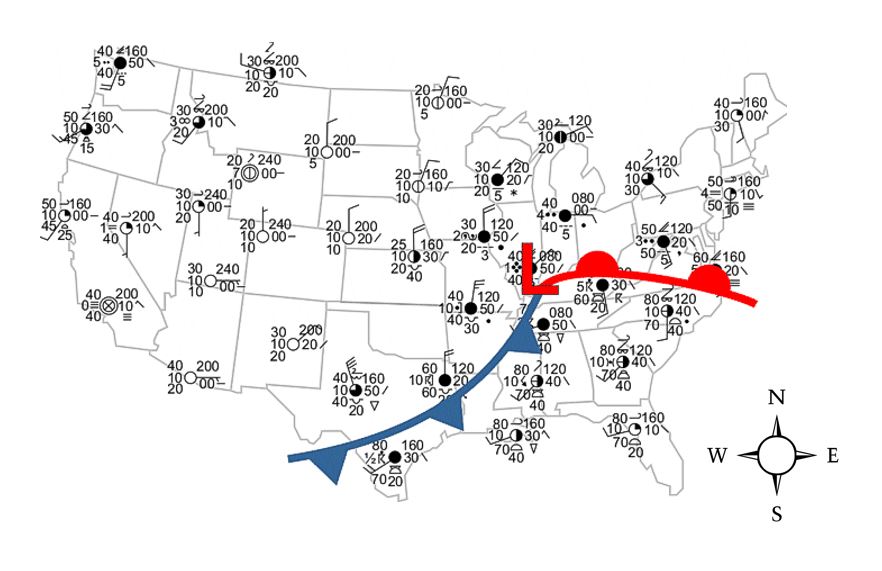
What front is moving through
Alabama and Georgia? 
a)
Warm
b)
Occluded
c)
Stationary
d)
Cold
53.
What front is moving through the NW part of the US?
a)
Stationary
b)
Warm
c)
Occluded
d)
Cold
54.
What direction is the warm front moving on the map? 
a)
North
b)
South
c)
East
d)
West
55.

Where is the Gulf Coastal States receiving its warm front from?

a)

Tropical currents

b)

Antartic currents

c)

Artic Jetstream

d)

Pacific currents

56.

Which cross section below best represents the air masses, air movement, clouds and precipitation occurring behind and ahead of the warm front located between stations A and B?

a)
b)
c)
d)
57.

Which things on the map indicate that this is a low pressure area?

a)

The letter "L"

b)

The barometric pressure decreases as you go toward the middle

c)

The counterclockwise movement of winds

d)

The high temperatures

e)

The differences between air temperature and dew point

58.

The arrows on which map represent the direction of surface winds associated with this low pressure system?

a)
b)
c)
d)
59.

What is the symbol for the warm and moist air mass?

a)

mT

b)

cT

c)

cM

d)

mP

e)

mA

60.

What is the symbol for the cold and dry air mass?

a)

cT

b)

cM

c)

cP

d)

mT

e)

mP