
 Worksheets
Math Skills
Total questions: 126
Worksheet time: 6hrs 56mins
6 kg = _____ g
6
6000
600
.006
(1 liter = 1000 ml)

7,000 g = ____ kg
70
700
7
0.07

648 g = ____ mg
6,480
64,800
648,000
64.8

240 cm = ___________ m
2400
24
2.4
0.24

3 km = ___________ mm
30
300
3,000
3,000,000

68 cm = ___________ mm
0.68
6.8
68
680

32.9 km = ___________ cm
32,900
329,000
3,290,000
32,900,000
Convert this number to standard notation: 7.1 x 10⁴
(a)
Convert this number into scientific notation: 0.068
6.9 x 10⁶
6.8 x 10⁻⁹
6.8 x 10⁻²
None of the above
When using scientific notation, a positive exponent means ...
the standard number is greater than one
the standard number is less than one
the negative sign doesn't have a meaning
None of the above
When using scientific notation, a negative exponent means ...
the standard number is greater than one
the standard number is less than one
the negative sign doesn't have a meaning
None of the above
Convert this number to standard notation: 1.4 x 10⁻²
(a)
Convert this number into scientific notation: 950,000
9.5 x 10⁵
9.5 x 10⁻⁹
9.5 x 10²
None of the above
Which value is the greatest
5.0 x 10⁻⁹
5.0 x 10⁻⁴
5.0 x 10⁶
5.0 x 10⁸
Which number is the least in value
5.0 x 10⁻⁹
5.0 x 10⁻⁴
5.0 x 10⁶
5.0 x 10⁸
1001
in scientific notation?
If the exponent is a positive number...
How do you measure the volume using a graduated cylinder?
Measurements must be taken from the top of the meniscus and at eye level
Measurements must be taken by looking from above the cylinder
Measurements must be taken by looking from below the cylinder
Measurements must be taken from the bottom of the meniscus and at eye level
In a measurement, significant figure consist of the digits known ___________.
only
plus one estimated digit
plus two estimated digits

How do we measure B with 3 significant digits?
9.2
9.20
9.25
9.00

How would you record measurement A?
7.8
7.82
7.825
7.90

How many significant digits would you report in this measurement?
1
2
3
4

What is the volume shown in this graduated cyclinder?
4.30 mL
4.35 mL
4.4 mL
4.40 mL

How many sig figs should be reported in this measurement of temperature?
1
2
3
4
How many sig figs are found in 0.020 mL?
1
2
3
4
How many sig figs are found in 2000 miles?
1
2
3
4
How many sig figs are in the conversion, 12 inches per foot?
1
2
3
infinite
Number of Significant Digits: 462
1
2
3
4
Number of Significant Digits: 807
1
2
3
4
Number of Significant Digits: 930
1
2
3
4
Number of Significant Digits: 1040
1
2
3
4
Number of Significant Digits: 0.125
1
2
3
4
Number of Significant Digits: 0.307
1
2
3
4
Number of Significant Digits: 0.0608
1
2
3
4
Number of Significant Digits: 0.06300
1
2
3
4
23.91 x 12.861 = 307.50651
Which of the following is the answer for the problem with the correct number of significant digits?
24.32 + 1.2
25.6
25.52
25.5
25
Which of the following is the answer for the problem with the correct number of significant digits?
0.0025 x 1.41
0.00
0.004
0.00353
0.0035
4.5 + 4.32 =
Divide these numbers and show the correct number of significant figures
0.04263 ÷ 0.306
0.139
0.1393
0.13931
0.14
An observation is different from an inference since:
Inferences always lead to experiments, observations do not
Observations do not temporarily explain something like inferences do
You make thousands of observations daily, but less inferences
Inferences can be proven, observations cannot be
Observations:
Require inferencing to be made
Do not lead to inferences
Are made using your senses
Only take place prior to hypothesis formation
This leads to that.
Observations lead to an inference
Inferences lead to an observation
Which of the following is an example of an inference:
The fish are small and seem to look the same
The water is shallow and very clear
It is a sandy and bare ecosystem
The fish are hiding from a possible predator
Which of the following is an example of an observation:
Hurricanes seem to make rough waves
The waves are rough today
Hurricanes lose strength over land
Hurricanes rotate since the Earth also rotates
Which of the following is an example of an inference:
Birds diving into the ocean means there are small fish there
Birds flying over the ocean typically do not flap their wings
Oceanic birds are larger than land birds
The fish is floating very still under the floating seaweed
Which of the following is an example of an observation:
The ocean creates foam when there are rough waves
The seaweed grows best with nutrients
The seaweed floats on the ocean water
The stronger the winds the bigger the waves are
An inferences is different from an observation since:
Inferences are made with your senses
You make thousands of inferences daily, more so than observations
It helps to explain something to make sense out of it, observations do not do that.
Inferencing comes before observation, and it starts the process of science.
The definition of an inference is:
A testable statement made on prior knowledge that leads to experimentation
Accurate and firm explanations of how the world around you works and why
Made with your senses to help learn about the world around you
An untested and temporary explanation of multiple similar observations.
You find a shark tooth that's long and pointy. Which of the following is the best possible inference:
The shark is a bottom feeder
The shark might eat squid
The shark eats large prey items
The shark is an invasive species
Using any of your 5 senses to describe the world around you.
Observation
Inference
Quantitative Observation
Logical Theory
An observation that has to do with numbers and labels like 3.5 cm.
Observation
Touch, Taste, Sight, Hearing, Smell
Qualitative Observation
Quantitative Observation
An observation that has to do with adjectives like heavy.
Centimeters
Inference
Qualitative Observation
Quantitative Observation

Observation or Inference: I think the weather is cold.
Observation
Inference
Observation or Inference: I notice the tree by the pond has no leaves on it.
Observation
Inference

Qualitative or Quantitative: There is 300 mL of liquid in this beaker.
Qualitative Observation
Quantitative Observation

Qualitative or Quantitative: I feel rough sand and a strong heat on the back of my neck.
Qualitative Observation
Quantitative Observation

Qualitative or Quantitative: We bought 3.4 pounds of fruit.
Qualitative Observation
Quantitative Observation

Qualitative or Quantitative: I hear a rush of wind, loud yells, and metal banging together.
Qualitative Observation
Quantitative Observation

Qualitative or Quantitative: The green bar is 3.5 centimeters long.
Qualitative Observation
Quantitative Observation

Which of these are an observation.
The animal lives in a cold climate.
The animals are a family.
The animals will go for a swim later.
The animals have long beaks.

What observation could be made about the picture.
The child is feeling cold.
The child will play outside.
The child is dressed with many clothes
The child will stay warm while he is outside.

What inference could be made about this picture.
The child is wearing mostly red.
This is a child.
The child is cold.
The child is overdressed.

The vertical axis of a line graph is called the __________.
slope
line of best fit
x-axis
y-axis

The horizontal axis of a line graph is called the __________.
slope
line of best fit
x-axis
y-axis
What is an independent variable?
the variable that changes because another variable changes
independent variables are only found on pie charts.
a variable most often found on the y-axis
the variable the experimenter changes or manipulates.
What is a dependent variable?
the variable the experimenter changes or manipulates.
the variable that changes because another variable changes
dependent variables are only found on pie charts
a variable most often found on the x-axis
Which type of graph best represents data that shows a change over a period of time?
line
bar
table
circle
You have been asked to make a graph which represents everyone's favorite video game system in your class. Which type of graph would work best?
line
bar
circle
table
What type of graph would you make to show how many of your classmates were born in each month of the year?
line
bar
circle
scatter plot
What is a variable?
something used to compare the parts of a whole
Something that is useful for displaying data or information that changes over time
Any display of information with tabs, rows and/or columns
Anything in an experiment that can change and can affect the outcome of the experiment


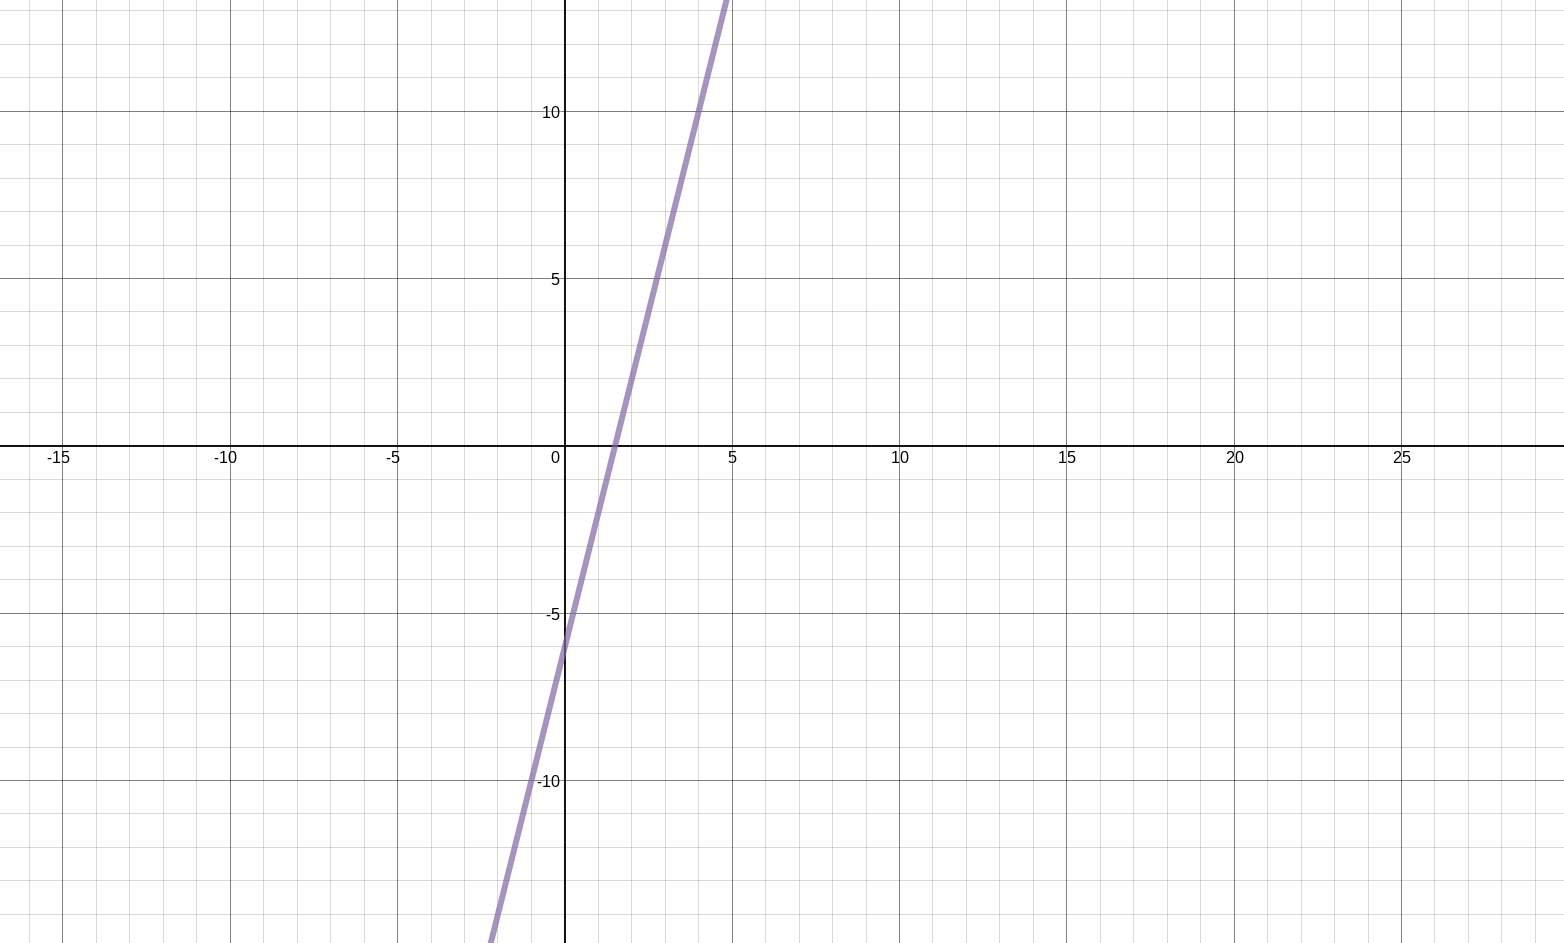
y = 4x - 6?

(in the form y = mx + c)
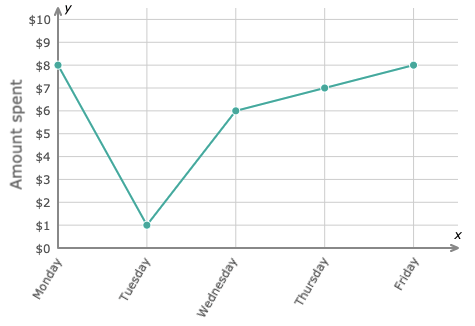
How much money was spent on Thursday?
1
6
7
8
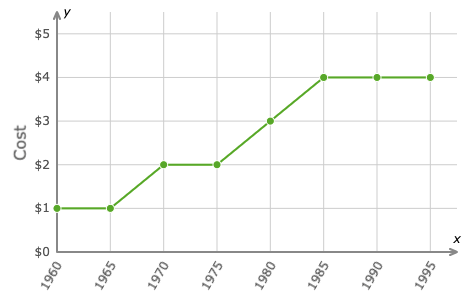
What year did a ticket cost $3.00?
1960
1970
1980
1990
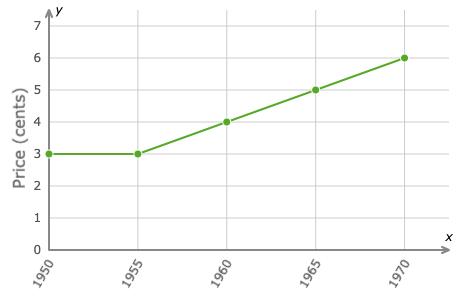
How much was a stamp in 1965?
3 cents
4 cents
5 cents
6 cents
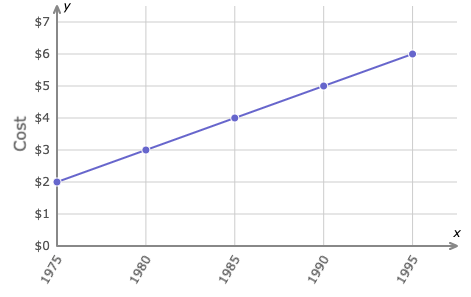
What year did a book cost $4.00?
1980
1985
1990
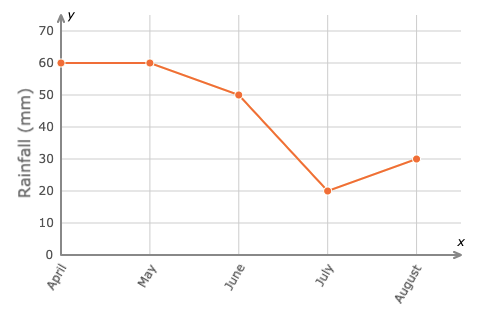
What is the rainfall total for May?
60 mm
50 mm
30 mm
20 mm





