
 Worksheets
Close the Gap-Force and Motion Test Review
Total questions: 113
Worksheet time: 1hrs 10mins

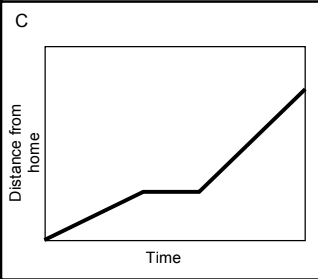
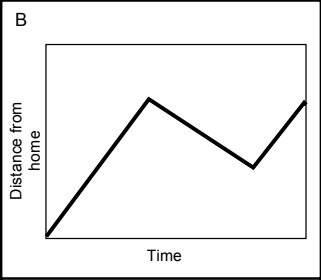
Consider the graph shown below. Which description below is consistent with the graph?
The object moves slowly at a constant speed and then faster at a constant speed.
The object accelerates in the positive direction and then accelerates more rapidly.
The object moves forward, changes direction and then accelerates more rapidly.

Which one of the following graphs describes an object that is at rest?
a.
b.
c.
d.
Which one of the following graphs describes an object that is moving at a constant speed to the right (+ direction)?
a.
b.
c.
d.

Which one of the following graphs describes an object that is moving to the right and slowing down?
a.
b.
c.
d.

At 8 s what is the objects position?
2 m
4 m
10 m
20 m
What is the unit for time?
m
s
m/s
m/s/s

from 3rd second to 5th second, the object is
moving at a constant speed
speeding up
not moving
slowing down
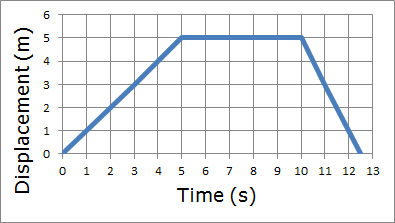
According to the graph how far does the person travel in the first 5 seconds?
2 m
10 m
0 m
5 m
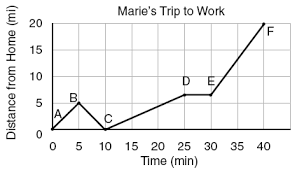
How does her speed at 3 minutes compare with her speed at 7 minutes?
She is driving faster at 3 minutes.
She is driving faster at 7 minutes
She is driving forward at 3 minutes and back at 7.
She is moving up at 3 minutes and down at 7 minutes

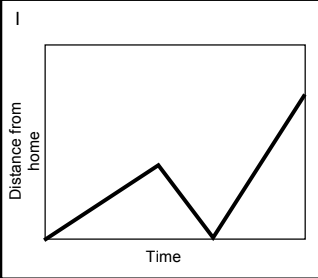
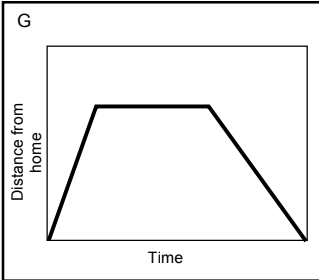
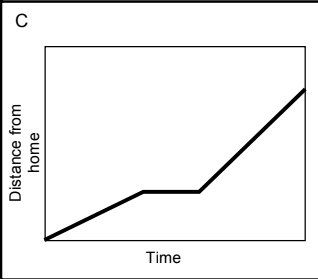
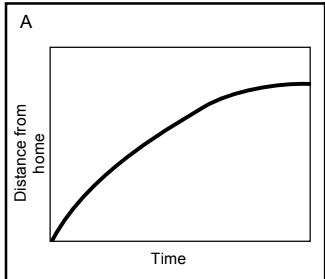

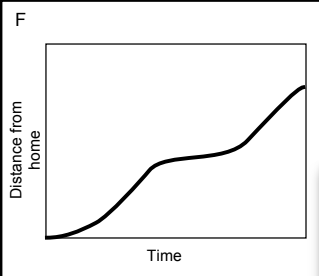
Consider the graph shown. Which description below is consistent with the graph?
The object moves slowly at a constant speed and then faster at a constant speed.
The object accelerates in the positive direction and then accelerates more rapidly.
The object moves forward, changes direction and then accelerates more rapidly.
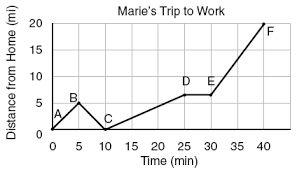
When was Marie driving the fastest?
C to D
D to E
E to F
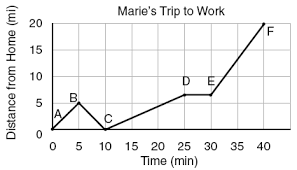
During what period of time was Marie stopped?
0-5 minutes
5-10 minutes
10-25 minutes
25-30 minutes
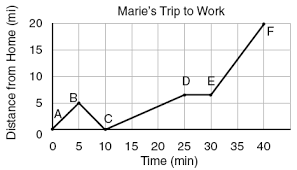
What could account for Marie’s motion at 27 minutes?
She was late so she broke the speed limit
She forgot something at home and ran back to get it
She was stopped at a red light
She was driving across the top of a hill
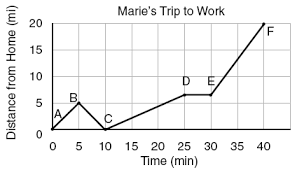
It usually takes Marie 30 minutes to get to work. Did her trip take...
The average amount of time.
Longer then average amount of time.
Shorter then average amount of time.
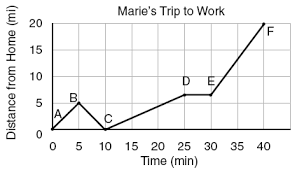
How far away is Marie's work from her house?
40 mi
25 mi
20 mi
5 mi
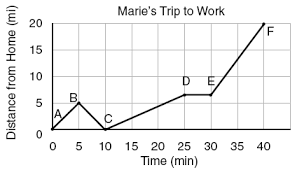
What could be a possible explanation for why Marie turned around at point B.
She arrived at work.
She forgot her lunch
She was waiting at a stop light.
She was sick and went home to sleep.
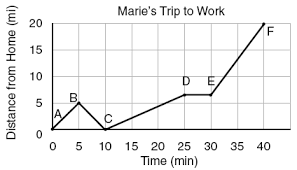
How far did Marie go before she turned around?
20 mi
5 mi
10 mi
25 mi

In Segment DE Marie was stopped at a red light. How long was she stopped for?
1 min.
10 min.
30 min.
5 min.
from 3 seconds to 5 seconds the object is
moving at a constant speed
speeding up
not moving
slowing down

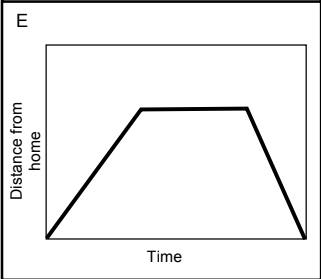
What is happening at E?
Stationary
Accelerating
Fast steady speed; moving away from the starting position
Steady speed; returning to start position
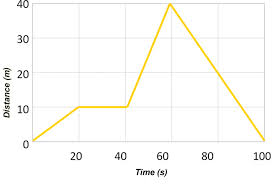

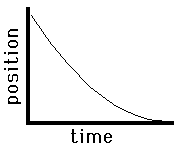
This position vs. time graph shows an object...
not moving
moving with constant velocity
moving with changing velocity

This position vs. time graph shows an object...
not moving
moving with constant velocity
moving with changing velocity

This position vs. time graph shows an object...
not moving
moving with constant velocity
moving with changing velocity
Which of these position vs. time graphs shows an object changing direction?


According to the graph, what was the Speed for the first 5 seconds?
1 m/s
0.5 m/s
5 m/s
2 m/s

What is the total distance traveled over the whole trip (0-9 seconds)?
5 meters
2 meters
1 meter
3 meters
Match the description to the graph:
"The car is stopped."


Match the description to the graph:
"The car is traveling at a constant speed."
Match the description to the graph:
"The speed of the car is decreasing."
Match the description to the graph:
"The car is coming back."

Segment O-A The bus is _________________.
at rest
returning (to original position)
moving forward
Segment A-B The bus is _________________.
at rest
returning (to original position)
moving forward
Segment B-C The bus is _________________.
at rest
returning (to original position)
moving forward
Segment C-D The bus is _________________.
at rest
returning (to original position)
moving forward
Segment D-E The bus is _________________.
at rest
returning (to original position)
moving forward
Segment E-F The bus is _________________.
at rest
returning (to original position)
moving forward

Which runner won the race?
Albert
Bob
Charlie
Which runner stopped for a rest?
Albert
Bob
Charlie
How long did Charlie stop for a rest?
2.5 seconds
2 seconds
3 seconds
5 seconds
How long did Bob take to complete the race?
17 seconds
12 seconds
14 seconds
15 seconds
Calculate Albert's average speed for the 100-meter race.
8.33 m/s
5 m/s
7.14 m/s
5.88 m/s
Which of the graphs shows that one of runners ended the race 10 yards ahead of the other?





Match the description to the graph:
"The car is traveling at a constant speed."




Which of the following is the correct equation for calculating SPEED?
s = d / t
s = d x t
s = t / d
s = d - t


The graph shows the movement of an object.
How long did it take this object to travel 10 m?
0 s
10 s
15 s
20 s

The graph shows the movement of an object.
At 60 seconds, how far had this object traveled?
0 m
10 m
20 m
40 m
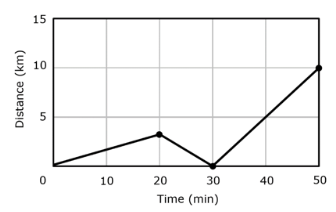
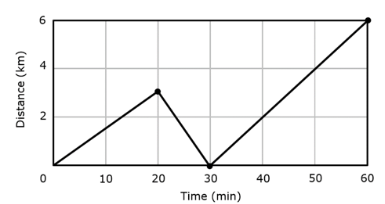
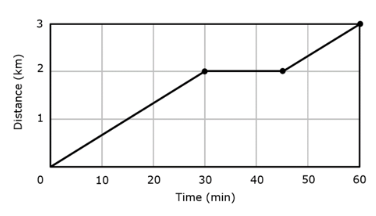
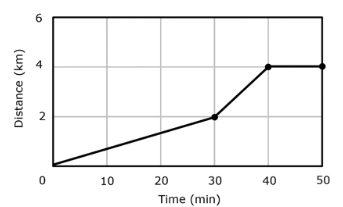
A student walks 2.0 km in a time of 30 minutes. The student then stop for 15 minutes to eat a snack then travels 1.0 km in 15 minutes.
Which graph shows the journey described?

Edward drove 80 miles from his home to London.
He stopped and visited his friend Nicola on the way.
Here is the distance-time graph for the journey.
How long did Edward stop for?
2 hours
1 hour
1.2 hours
1.5 hours

Anne cycles from Bristol to Salisbury.
The diagram shows the distance-time graph of her journey.
How far from Bristol is Anne at 8:00?
15 miles
20 miles
10 miles
40 miles

Anne cycles from Bristol to Salisbury.
The diagram shows the distance-time graph of her journey.
What is Anne's speed for the first two hours of her journey?
40 mph
30 mph
20 mph
10 mph

Which part of this graph shows the journey home?
A
B
C
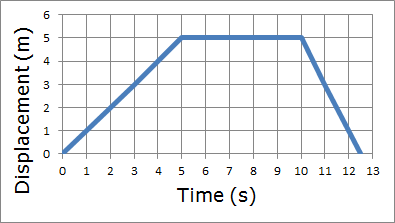



Which line represents the slower speed?
green
red


Who was running at constant speed at the beginning of the race?
A)Albert
B)Bob
C)Charlie

Which interval has the slowest speed?
A
B
C

Which interval has the fastest speed?
A
B
C
Gabriel sprinted down the hallway for a science project. He ran a total of 40 meters in 20 seconds. What was his average speed?
2 meters per second
20 meters per second
40 meters per second
10 meters for second

What is the speed of the marble at 2 s?
5 m/s
5 s/m
20 m/s
20 s/m

What is the speed of the marble at 3 seconds?
5 m/s
45 m/s
5 s/m
45 s/m

Alan travels 100 km in 5hrs. Find his average speed in km/h
5km/hr
10km/hr
50km/hr
20km/hr

Total distance divided by total time is
average speed
average time
average distance
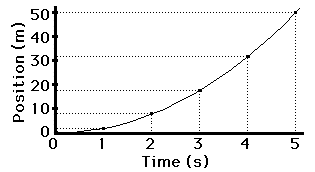
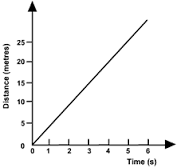
What is the line on this graph showing?
moving away from starting point at a constant speed
moving back towards the starting point at a constant speed
acceleration (getting faster)
deceleration (getting slower)
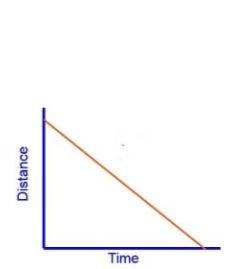
What is this line of this graph showing?
moving away from starting point at a constant speed
moving back towards the starting point at a constant speed
acceleration (getting faster)
deceleration (getting slower)


Abby recorded the distance and time of a ball rolling down a ramp in the table below.
Which best describes the motion of the ball?
** helps if you plot the points on a distance time graph
The ball does not move.
The ball increases speed.
The ball decreases speed.
The ball rolls at a constant speed.
Anna ran 100 meters in 20 seconds. What was her average speed?
2 m/s
5 m/s
20 m/s
25 m/s
Tom, Bob, and Bill are in a bicycle race. Tom travels 1.5 miles in 12 minutes, Bob travels 2 miles in 22.3 minutes, and Bill travels 2.9 miles in 10 minutes. Who had the greatest speed? (speed = distance ÷ time)
Tom
Bob
Bill
Students observed a turtle in the schoolyard. They measured the distance that the turtle traveled in 30 minutes. If the turtle walked 40 meters in that time, what was its average speed?
0.75 m/h
20 m/s
80 m/h
1,200 m/h
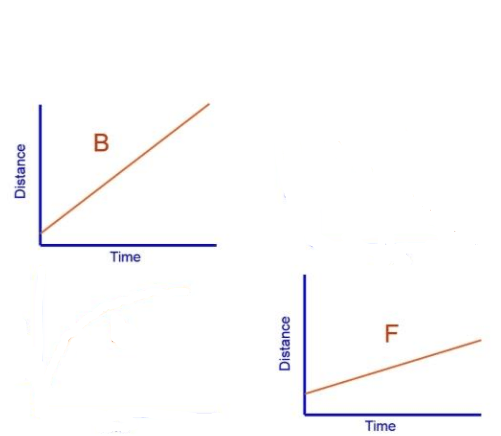
Which graph best illustrates a car moving at a positive constant speed?


What is this graph showing?
Constant speed
Gradually speeding up
Gradually slowing down
At rest
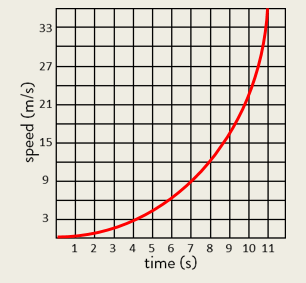
What is this graph showing?
Gradually slowing down
Gradually speeding up
Constant speed
Stopped

