
 Worksheets
Last Chance #4
Total questions: 131
Worksheet time: 1hrs 11mins
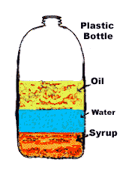


A crayon has a mass of 10.0 g and volume of 5.0 mL. What is the density?
30 g/mL
15 g/mL
1.0 g/mL
2.o g/mL

A block of aluminum occupies a volume of 15 mL and has a mass of 40.5 g. What is its density?
.37 g/mL
605.5 g/mL
2.7 g/mL
25.5 g/mL
Jack has a rock. The rock has a mass of 14g and a volume of 2cm3. What is the density of the rock?
7 mL
7 g/cm3
28 g/cm3
1/7 g/cm3


As part of a classifying elements lab Joe was finding the density of different samples. One sample had a mass of 26.4 and a volume of 12 mL. What element is it?
Sulfur
Carbon
Boron
Krypton
M = D/V
M = V/D
M = D x V
A piece of copper has a mass of 89g and a volume of 10.0 cm3. What would be the density of the copper?
0.89 g/cm3
89 g/cm3
8.9 g/cm3
890 g/cm3

Use the density chart to identify the substance. If the substance has a volume of 5 cm3 and a mass of 52.5.
lead
aluminum
silver
water

In the picture, a can of Pepsi sunk and a can of Diet Pepsi are put into water. The Pepsi must be
more dense than water
less dense than water
it has no density
it has a density of 1 g/mL

If the volume of the Coke and Diet coke is 380 cm3, The mass of the coke must be...
equal to to 1 g
less than 380 g
more than 380 mL
more than 380 g
We can use density to identify substances because it is a
Chemical property
Physical Property
Characteristic Physical Property
Materialistic Property
when an object is compressed so that its mass is packed into a smaller space, its density
increases
decreases
remains constant

A. gasoline 0.7 g/ cm3
B. lead 11.3 g/ cm3
C. mercury 13.6 g/ cm3
D. Paraffin(wax) 0.87 g/ cm3
E. platinum 21.4 g/ cm3
Which will not sink in water?
A & B
C & E
B & C
A & D
Why does ice float
Liquid water is less dense than solid water.
Solid water is less dense than liquid water.
Gaseous water is less dense than solid water.
Liquid water is less dense than gaseous water.

In this picture, what is true?
Box A has a lower volume
Box B has a greater volume
The boxes have the same mass
The boxes have the same volume

In which section is the car undergoing positive acceleration?
a to b
b to c
c to d
d to e
f to g
In which section does the car have zero acceleration?
a to b
b to c
c to d
d to e
f to g
In which section does the car have negative acceleration?
a to b
b to c
c to d
d to e
f to g
In which section is the car moving backwards?
a to b
b to c
c to d
d to e
f to g
In which section does the car have a positive velocity?
a to b
b to c
c to d
d to e
f to g
The slope of a Velocity - Time Graph gives the ______ of the object.
acceleration
velocity
speed or velocity
displacement
The path of the object cannot be determined from a:
Velocity-Time Graph
Distance-Time Graph
Neither a Velocity-Time Graph or a Distance-Time Graph
Velocity-Time graphs tell if an object is going faster or slower, not farther.
true
false

Check all that apply to the graph.
moving away from the original position
moving towards the original position
object at rest
positive acceleration
negative acceleration

Check all that apply to the graph.
positive acceleration
negative acceleration
zero acceleration
increasing speed
decreasing speed

Check all that apply to the graph.
positive acceleration
increasing speed
getting farther away from the starting position
constant velocity
object at rest

Check all that apply to the graph.
negative acceleration
deceleration
increasing speed
constant or uniform acceleration
decreasing speed

Check all that apply.
constant speed
constant acceleration
zero acceleration
increasing velocity

Check all that apply.
constant velocity
zero acceleration
object at rest
increasing velocity
decreasing velocity

Check all that apply to the graph.
decreasing velocity
negative acceleration
deceleration
increasing velocity
moving towards original position
In which section is the car undergoing positive acceleration?
a to b
b to c
c to d
d to e
f to g
In which section does the car have zero acceleration?
a to b
b to c
c to d
d to e
f to g
In which section does the car have negative acceleration?
a to b
b to c
c to d
d to e
f to g
In which section is the car moving backwards?
a to b
b to c
c to d
d to e
f to g
In which section does the car have a positive velocity?
a to b
b to c
c to d
d to e
f to g
The slope of a Velocity - Time Graph gives the ______ of the object.
acceleration
velocity
speed or velocity
displacement
The path of the object cannot be determined from a:
Velocity-Time Graph
Distance-Time Graph
Neither a Velocity-Time Graph or a Distance-Time Graph
Velocity-Time graphs tell if an object is going faster or slower, not farther.
true
false
Check all that apply to the graph.
moving away from the original position
moving towards the original position
object at rest
positive acceleration
negative acceleration
Check all that apply to the graph.
positive acceleration
negative acceleration
zero acceleration
increasing speed
decreasing speed
Check all that apply to the graph.
positive acceleration
increasing speed
getting farther away from the starting position
constant velocity
object at rest
Check all that apply to the graph.
negative acceleration
deceleration
increasing speed
constant or uniform acceleration
decreasing speed
Check all that apply.
constant speed
constant acceleration
zero acceleration
increasing velocity
Check all that apply.
constant velocity
zero acceleration
object at rest
increasing velocity
decreasing velocity
Check all that apply to the graph.
decreasing velocity
negative acceleration
deceleration
increasing velocity
moving towards original position
Did you watch the video?
Yes
No
An object is __________ when its distance from a reference point is changing.
in motion
speeding
not moving
at rest
Speed in a given direction is called ___________.
velocity
asking for directions
science is awesome
a green light
________ can be calculated if you know the distance an object traveled and the unit of time. (distance ÷ time)
Speed
Motion
Opportunity
Velocity
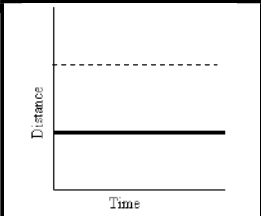
What does the solid line on this graph represent?
Constant speed
Acceleration
At rest
deceleration
What is the formula for speed?
speed = distance · time
speed = distance ÷ time
speed = time - distance
speed = distance + time
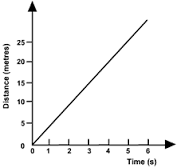
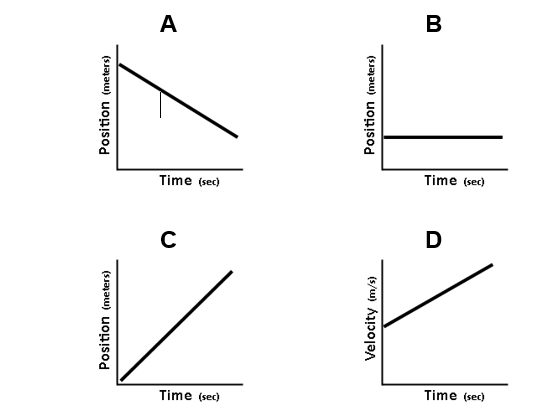
What is the line on this graph showing?
moving away from starting point at a constant speed
moving back towards the starting point at a constant speed
acceleration (getting faster)
deceleration (getting slower)
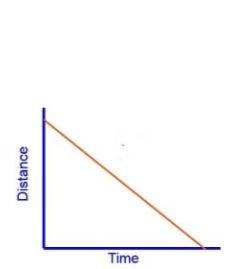
What is this line of this graph showing?
moving away from starting point at a constant speed
moving back towards the starting point at a constant speed
acceleration (getting faster)
deceleration (getting slower)



The graph represents the motion of a car over 10 seconds. What is the average speed of the car during the first 4 seconds? (Hint: distance 10 meters and time 4 seconds)
.4 m/s
2.5 m/s
10 m/s
40 m/s
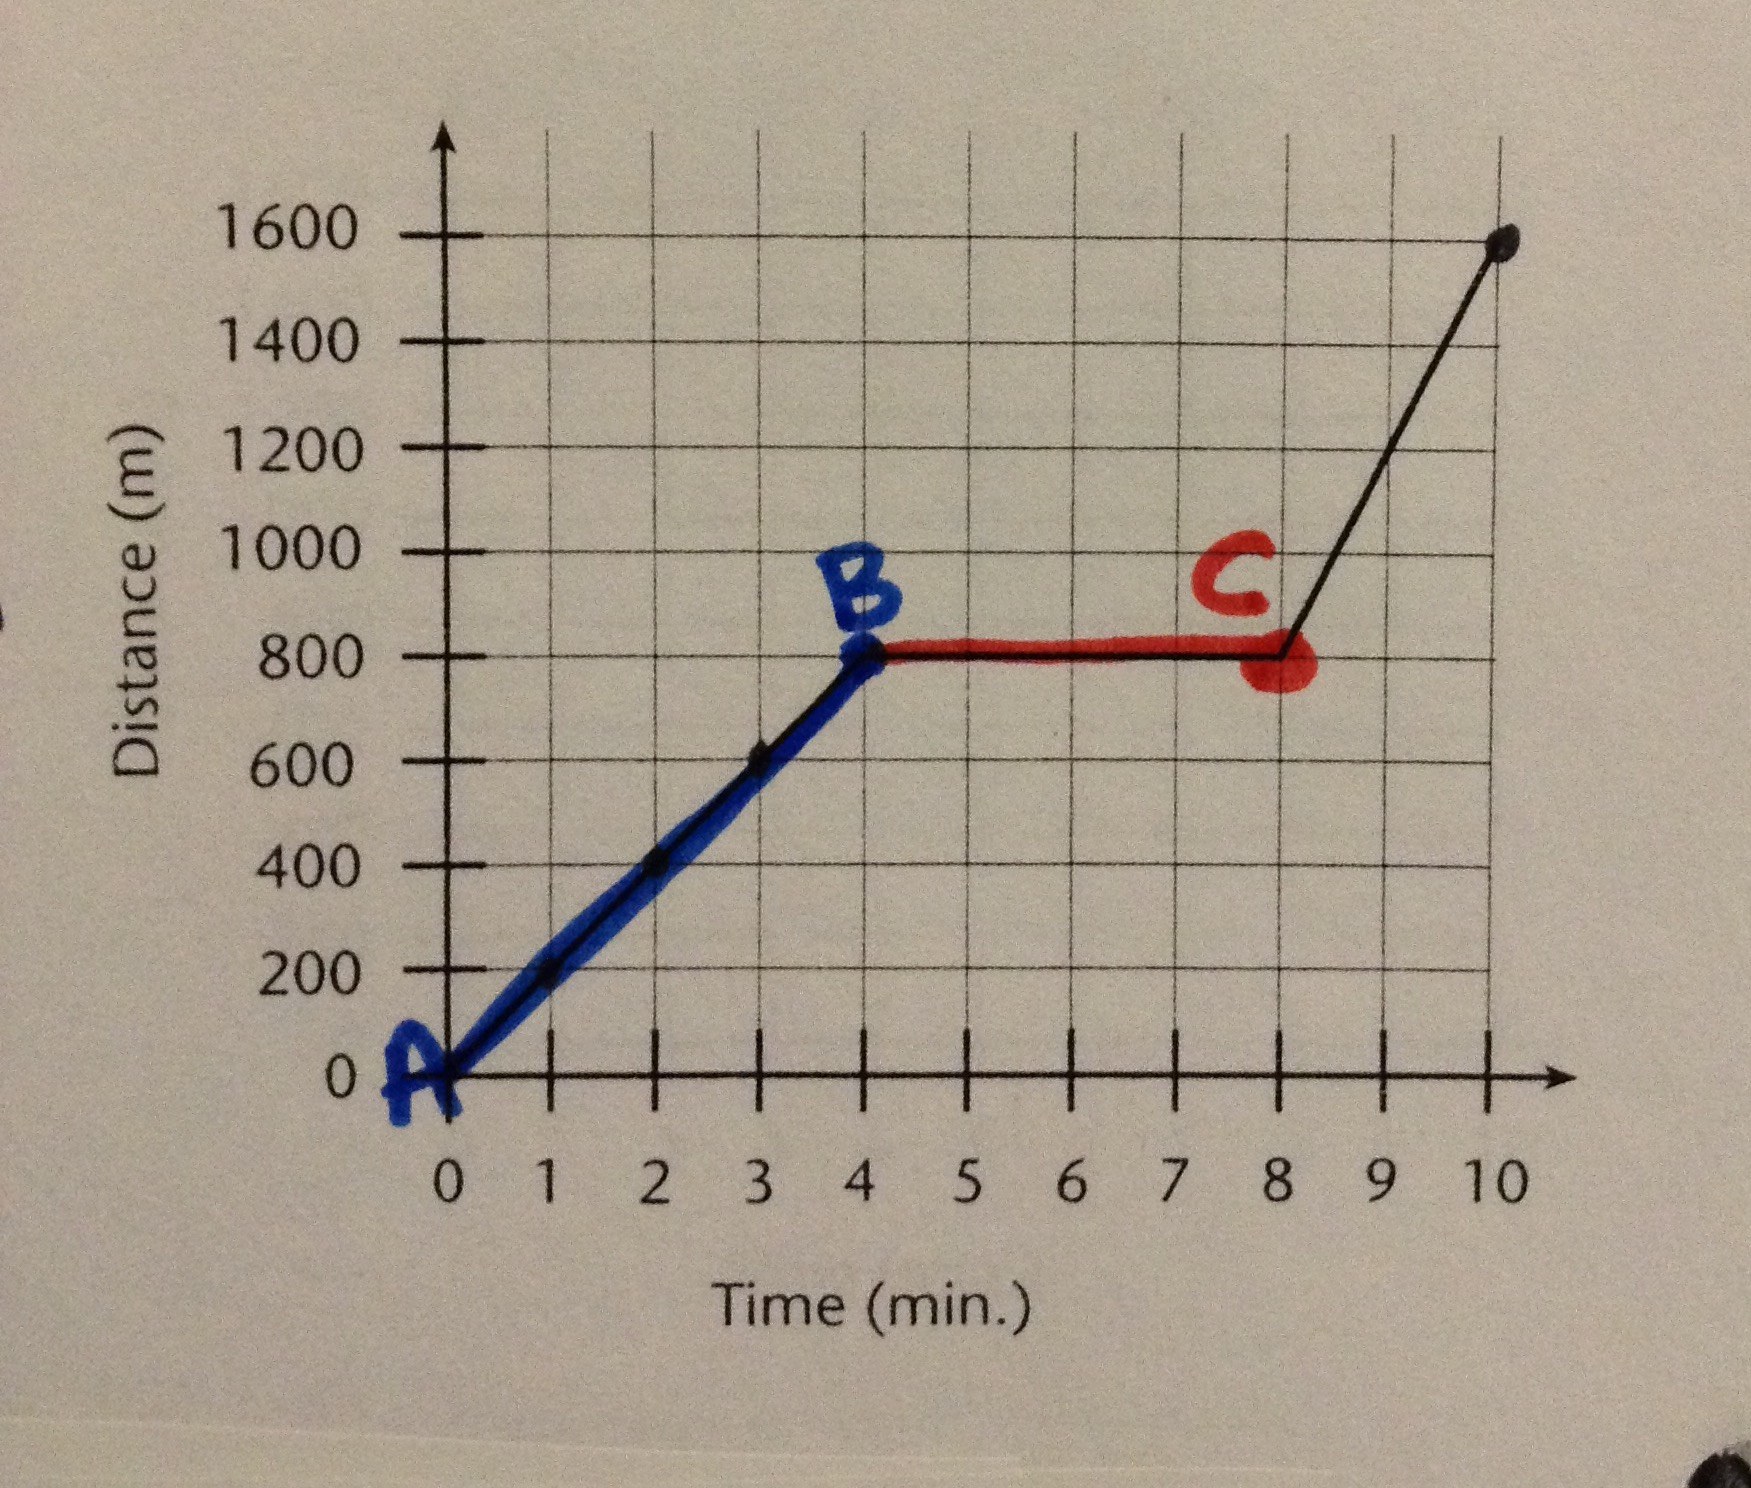
What is occurring from point A to point B?
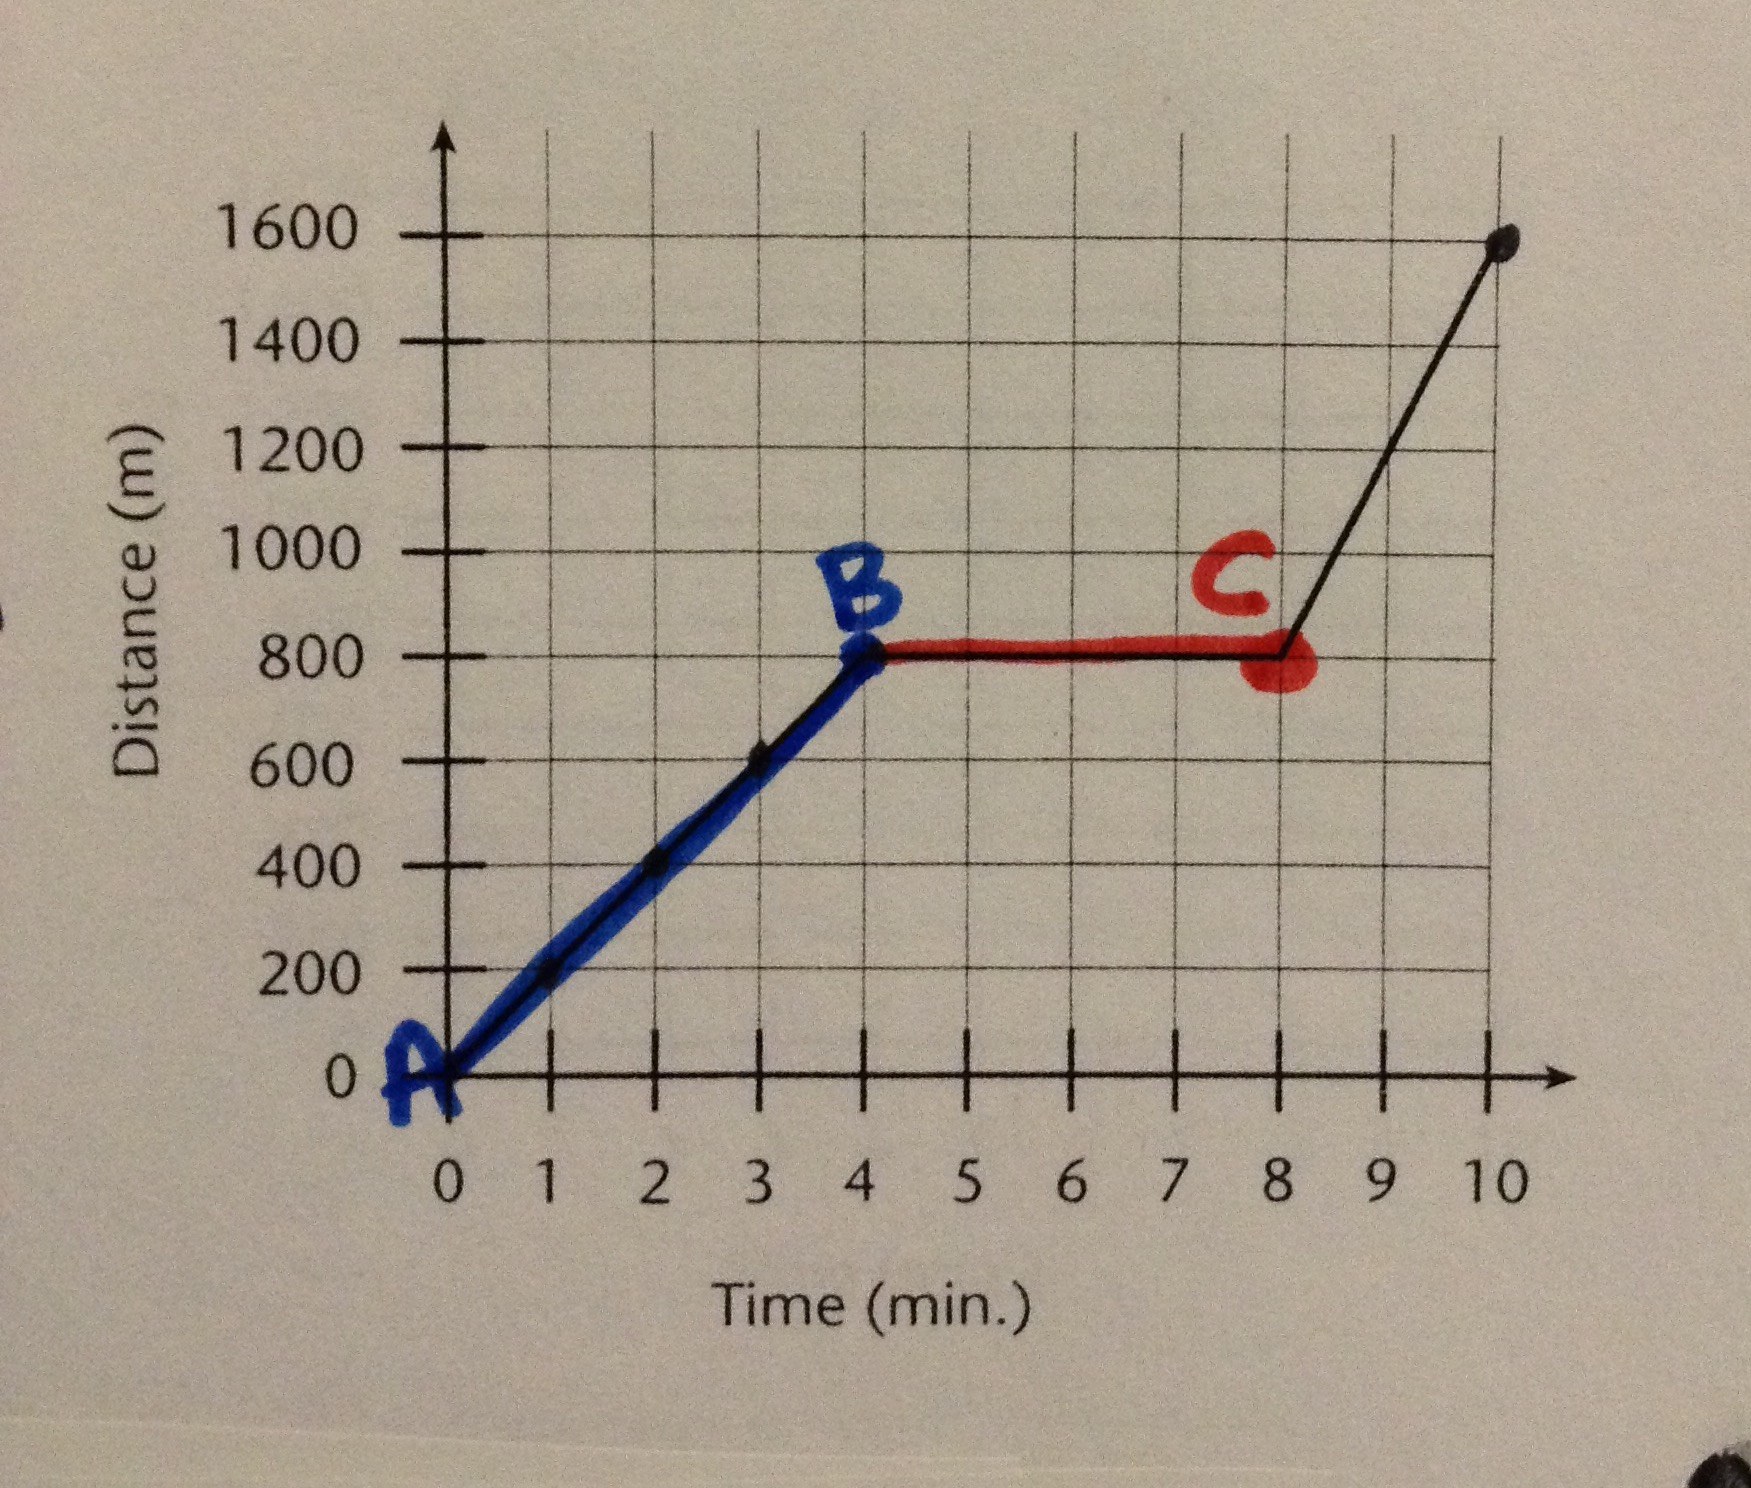
What was occurring from point B to point C?


During which interval is the object speeding up?
A to B
B to C
D to E
E to F
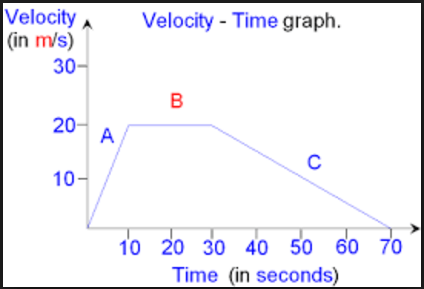


What is occurring on this graph?
slowing down in the positive direction
moving at a constant speed in the positive direction
positive change in momentum
positive net force
This graph represents slowing down in the positive direction then speeding up in the positive direction.



