
 Worksheets
Ch 1.1 The Science of Biology
Total questions: 125
Worksheet time: 2hrs 50mins
What is the goal of “basic science?”
What is the goal of “applied science?”
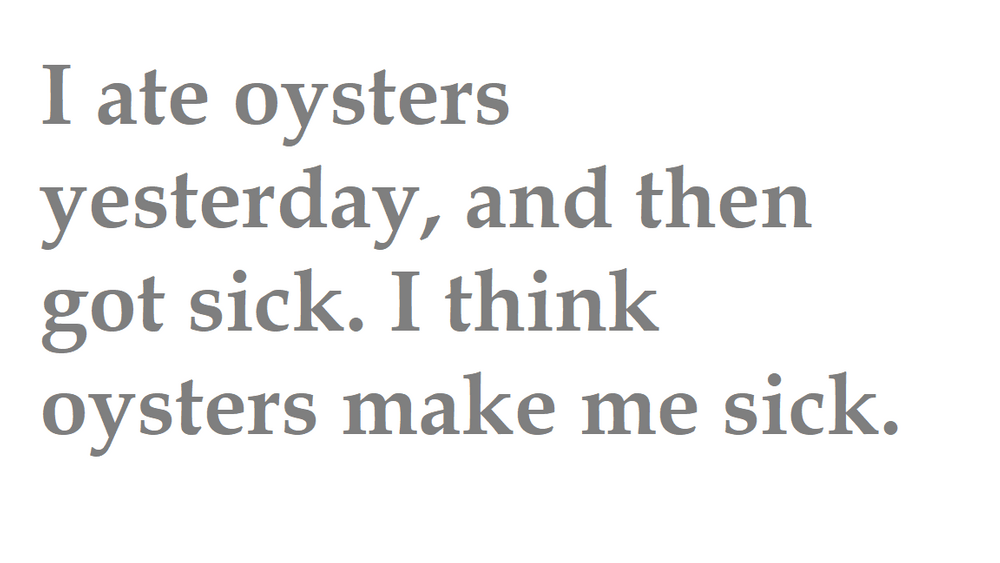
Inductive or Deductive?
Inductive
Deductive
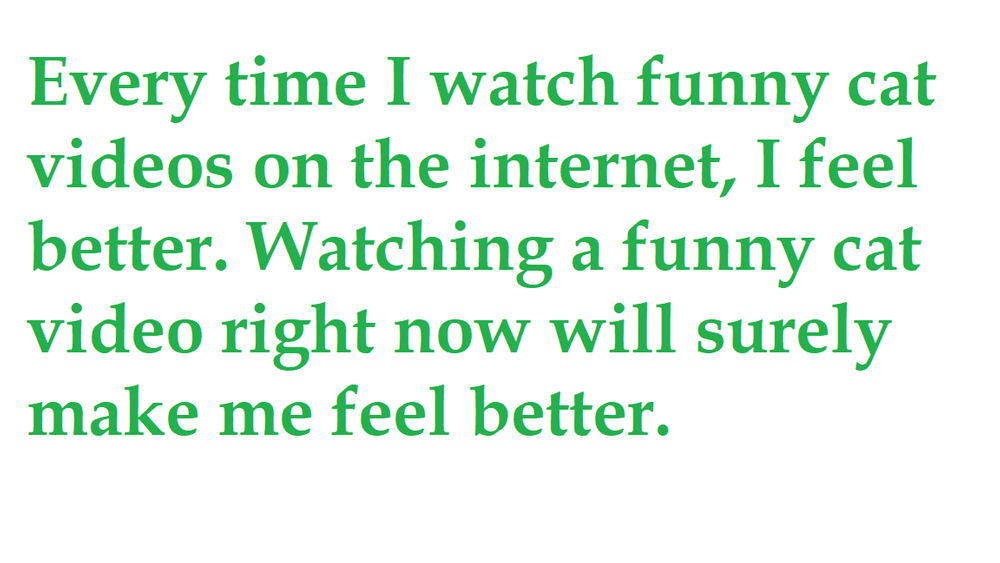
Is the reasoning Inductive or Deductive?
Inductive
Deductive
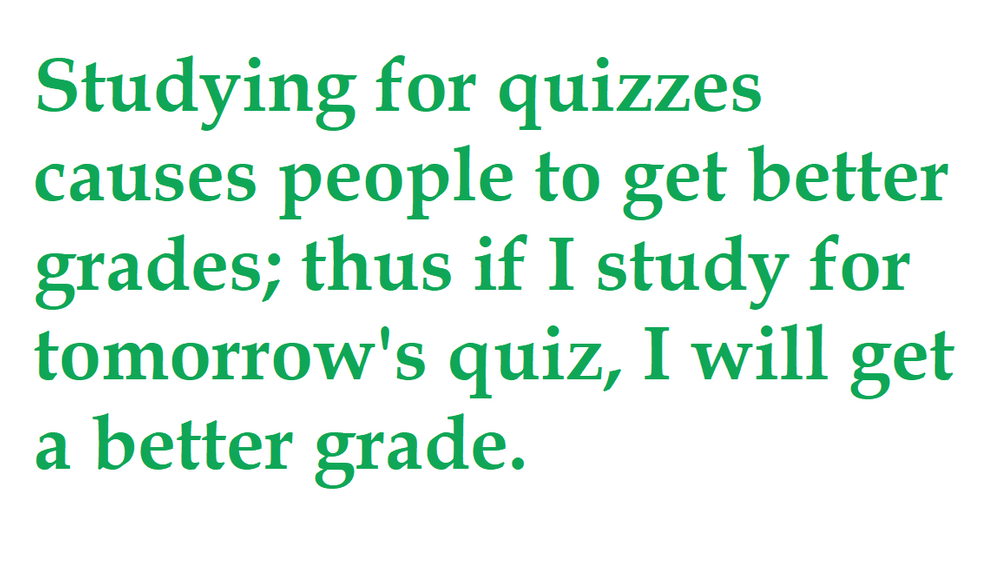
Inductive or Deductive?
Inductive
Deductive
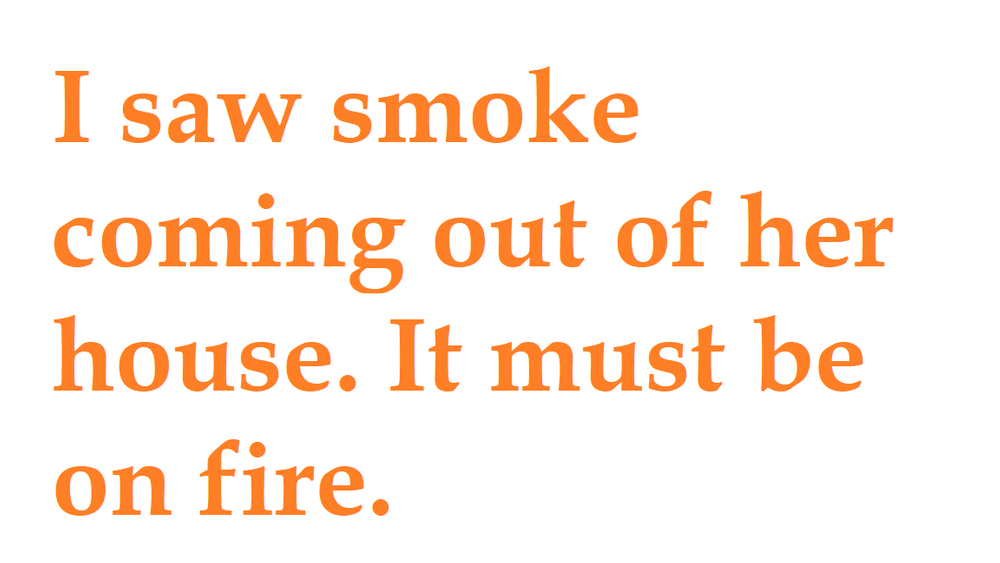
Is this Inductive or Deductive reasoning?
Inductive
Deductive
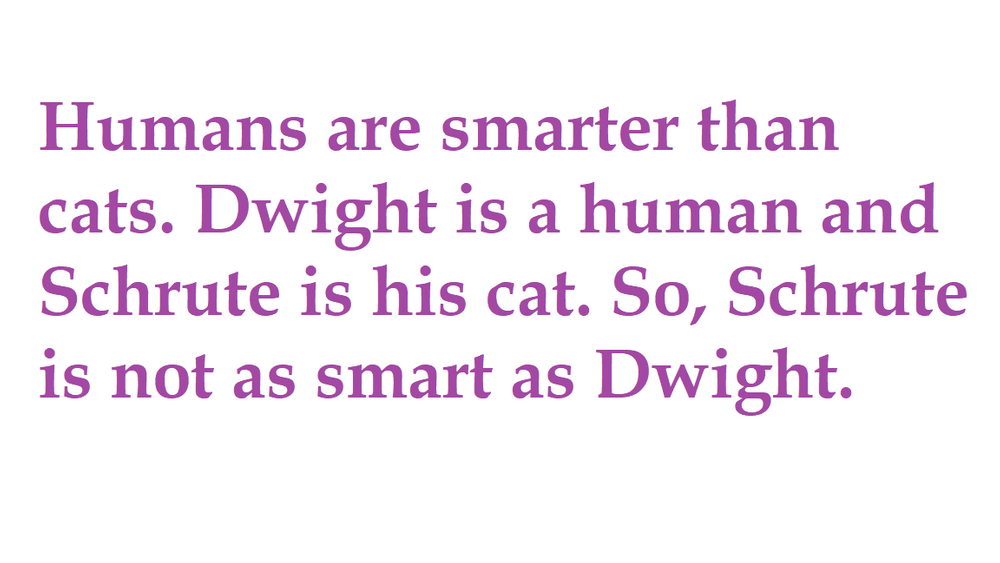
Inductive or Deductive? You choose.
Inductive
Deductive
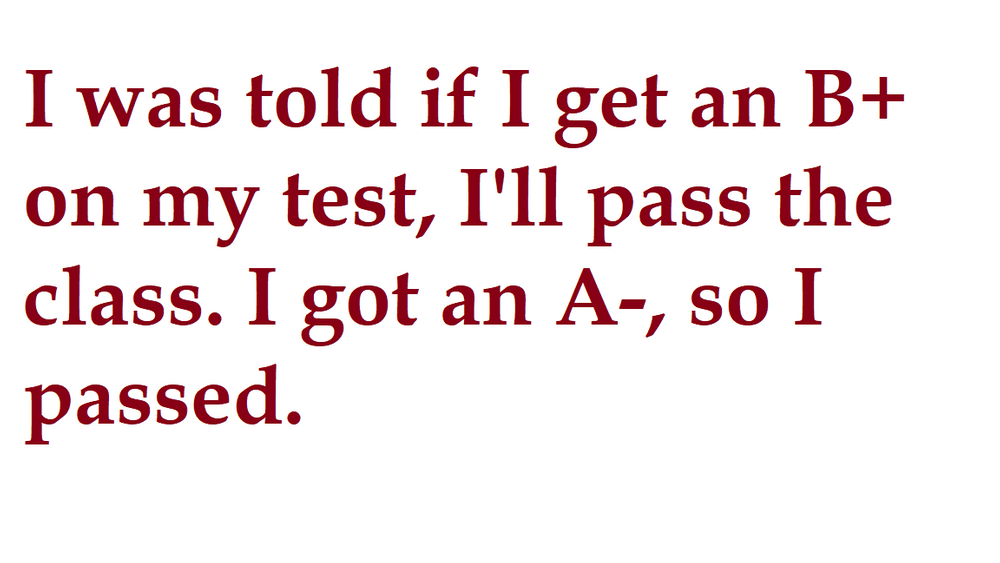
Is this Inductive or Deductive reasoning?
Inductive
Deductive
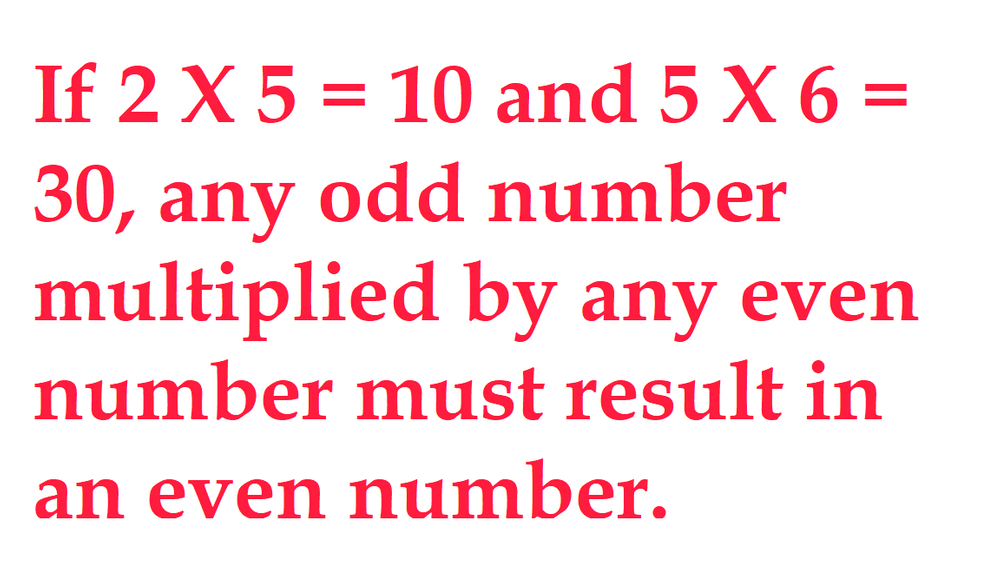
Is this Inductive or Deductive logic?
Inductive
Deductive
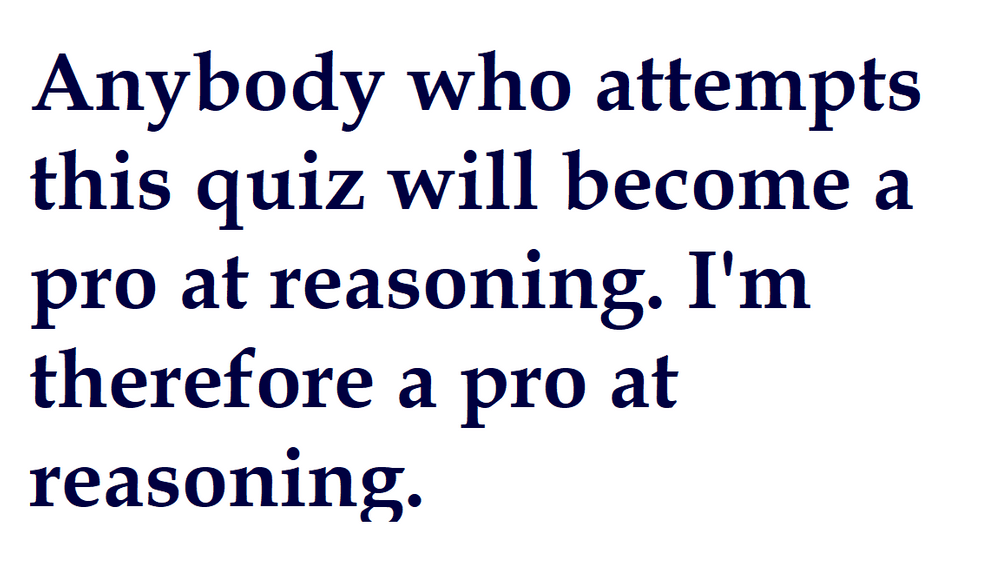
Inductive or Deductive?
Inductive
Deductive

Which of the following question marks can be solved by Inductive reasoning?
2, 4, 6, 8, ?
2, 4, ?, 8, 10
0, 1, 3, 6, ?, 15
-3, -2, -1, ?
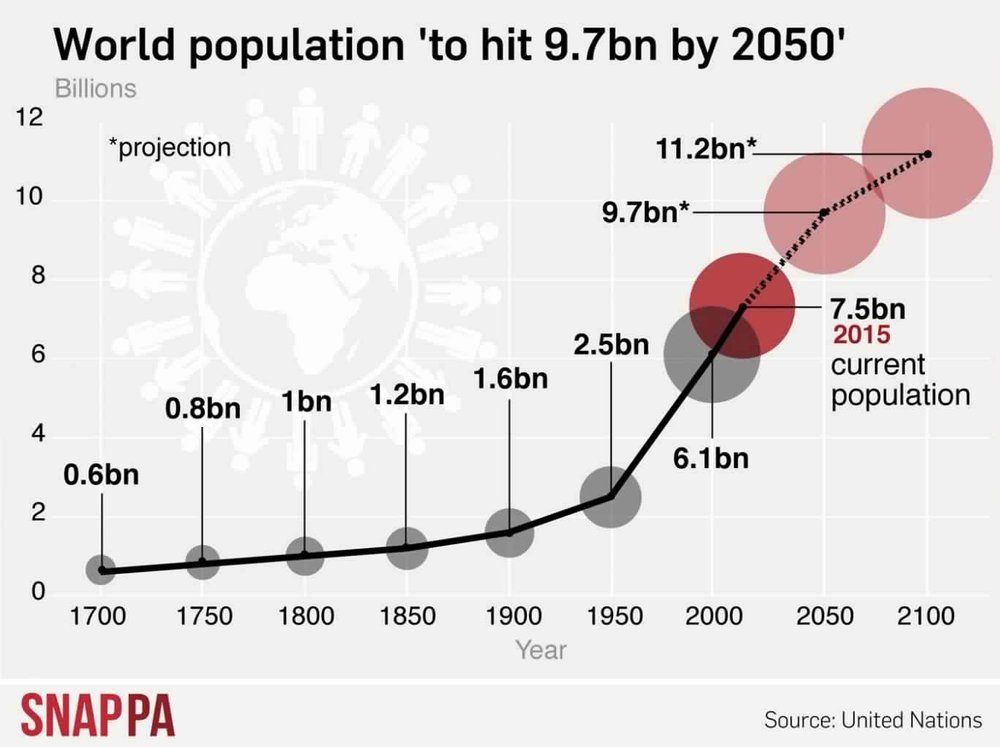
Which reasoning method can support the population prediction below?
Inductive
Deductive
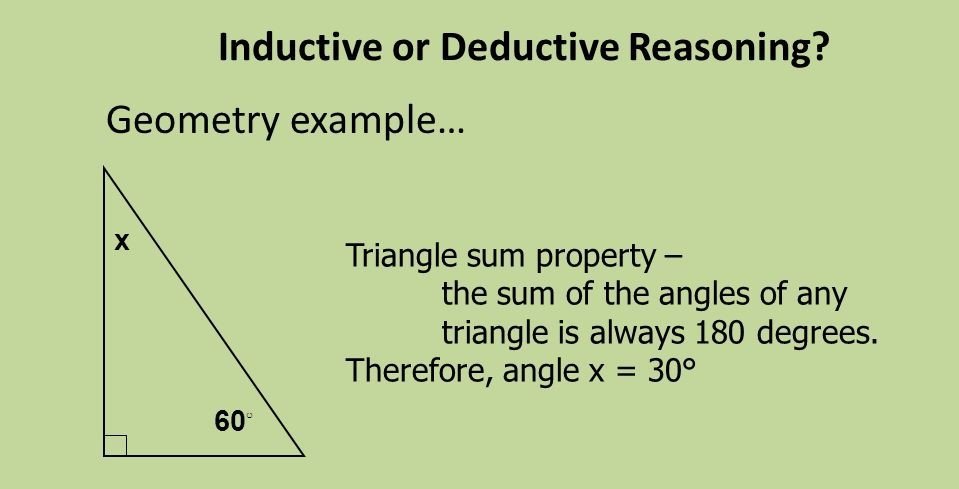
The conclusion that X=30 degrees is Inductive or Deductive reasoning?
Inductive
Deductive
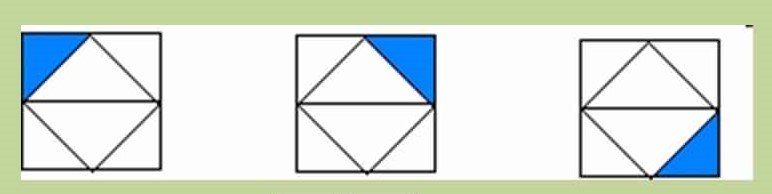
What reasoning method will we need to find the next member of this pattern?
Inductive
Deductive
The null hypothesis is also written as
H0
H1
A0
A1
A (a) hypothesis for an experiment would predict no difference in the dependent variable between conditions of the independent variable
A researcher found no difference in their DV between the conditions of their IV. What hypothesis should they accept?
Null hypothesis
Alternative hypothesis
This symbol denotes the alternative hypothesis
Null hypothesis
Alternative hypothesis
H0
H1
A hypothesis is...
what the researcher measures
something unwanted that can affect results
a testable prediction
what the researcher changes or compares
The dependent variable is...
what the researcher measures
something unwanted that can affect results
a testable prediction
what the researcher changes or compares
The independent variable is...
what the researcher measures
something unwanted that can affect results
a testable prediction
what the researcher changes or compares
This part of the experiment serves as a basis of comparison:
control group
Independent variable
dependent variable
data
This variable in an experiment is the one being deliberately changed by the scientist.
dependent variable
independent variable
data
control group
An experiment is performed on plants to see how different liquids affect plant growth. Each plant in the experiment is given a different liquid; water, apple juice, or milk. Each plant has the same amount of soil, sunlight, and listens to the same music. In this investigation, the independent variable is ...
type of plant
the amount of sunlight
the type of music
the type of liquid
The summary at the end of an experiment that explains the results.
conclusion
hypothesis
procedure
question
A student wants to test the effects of type of exercise on heart rate. What is the dependent variable?
time of day exercise occurs
amount of exercise
heart rate
type of exercise
Observations made during an experiment are called:
data
problems
conclusions
questions
An experiment is performed on plants to see how different liquids affect plant growth. Each plant in the experiment is given a different liquid; water, apple juice, or milk. Each plant has the same amount of soil, sunlight, and listens to the same music. In this investigation, what are the controlled variables?
type of plant, amount of music, and sunlight
plant growth
water, apple juice, milk
Which is true about a hypothesis?
It may reject or accepts your prediction.
It summarizes the result on the experiment.
It is the final answer to the question.
It is an educated guess or possible answer to the question.

The graph below shows atmospheric carbon dioxide levels since the year 1880.Which of the following conclusions can be drawn from this graph
Atmospheric carbon dioxide levels are responsible for global temperature change.
Atmospheric carbon dioxide levels have been rising at about the same rate for the past century.
Atmospheric carbon dioxide levels have remained the same over the past century.
Atmospheric carbon dioxide levels have been rising at an increasingly higher rate as the past century has progressed.
In order to be accepted, a scientific theory must be
based on the results of a single experiment
widely tested and supported by extensive data
in line with all previous historical ideas
controversial and cause debate
Conclusions based on an experiment are most likely to be accepted when
they are consistent with experimental data and observations
they are derived from investigations having many experimental variables
scientists agree that only one hypothesis has been tested
hypotheses are based on one experimental design
An experiment was carried out to determine whether drinking caffeinated soda increases pulse rate. The pulse rates of two groups of people at rest were measured. Group A was then given caffeinated soda and group B was given caffeine-free soda. One hour after drinking the soda, the pulse rates were measured. The participants in the experiment were all the same age, and they were all given the same amount of soda. The dependent variable in this experiment is the
type of soda given to each group
amount of soda given to each group
pulse rate of each group
age of participants in each group
What effect does fertilizer have on plant growth? Identify the correct step from the choices below.
ask a question
state the hypothesis
collect the data
draw conclusions
Which type of data involves numbers that are obtained by counting or measuring?
quantitative
qualitative
Which type of data involves descriptions that cannot be counted or measured?
qualitative
quantitative
How do scientists prove their claim?
With a story
With evidence
With an experiment
With an essay
A testable question should include what two things?
A hypothesis and question
A question and a dependent variable
An independent variable but no dependent variable
An independent variable and a dependent variable
(Or therefore, or due to, or as a result of, or according to).
This is an example of a ________.
This is an example of a ________.
Which of these statements is NOT a claim?
Global temperatures are increasing due to carbon dioxide.
Missing assignments do not affect your grades.
I like blue Jolly Ranchers.
Select the RELEVANT evidence for this claim: Schools should start later in the morning.
Schools would get out later in the day, which gives students less time to complete homework or after school activities.
Students would get more sleep in the mornings and be more awake for class.
What should NOT be included in your evidence?
Observations from an investigation.
Numbers from your data table.
Opinions about the scientific data.
Why do you need to include reasoning in your CER?
It shows how or why the evidence supports the claim
It provides justification about why the evidence is important
It includes the scientific principle to support the claim
All of the above

What is the best claim based on the data in this graph?
When the weight of particles increase, the length decreases
When the weight of particles increase, the length also increases
The length of particles is not related to weight of particles.

What is the best claim based on the data in this graph?
More cars are being made every year
Electric cars are better than gas cars
The number of electric cars worldwide is increasing
Electric cars stopped being sold in 2019
CER is a form of writing that...
can be used to make an argument
can be used to summarize a story
can be used to tell a fictional story
What steps should you take when writing a CER paragraph?
1. Cite evidence 2. Answer the question with a claim 3. Explain your reasoning
1. Explain your reasoning 2. Cite evidence 3. Answer the question with a claim
1. Answer the question with a claim 2. Cite evidence 3. Explain your reasoning
1. Answer the question with a claim 2. Explain your reasoning 3. Cite evidence
Which sentence is the claim?
Which sentence is the evidence?
Which sentence is the reasoning?


At what time is the rocket the highest according to the graph?
60 seconds
80 seconds
100 seconds
120 seconds

Which person is running the fastest?
A
B
C
Impossible to determine

Which line represents a quick decrease of data at a CONSTANT rate.
D
A
F
B


Which bar graph displays the same information as the table provided?


In what year is it expected that India will overtake China as the worlds largest population
2022
2025
2050
2100

Which plant type has the best growth rate in partial shade?
geranium
impatiens
fuchsia
trillium

What is the vaccination rate in Australia at the latest date on Aug 2021?
20%
25%
30%
36%

Which quarter had the highest engagement in social media?
quarter 1
quarter 2
quarter 3
quarter 4
Francis was recording plant heights for an experiment. Each time that she took a measurement, she wrote it down. Then, she measured the plant again and compared the new measurement to the one that she had recorded in her notebook. What was she most likely trying to do?
revise her hypothesis
check her memory
make the data more valid
form a conclusion
check her memory
make the data more valid
form a conclusion
For a conclusion to be accepted by the scientific community, the data must be accurate, free from error, and
reproducible.
varied.
unique.
surprising.
unique.
surprising.
What is the best definition of a conclusion?
a written description of events that occurred during an experiment
an act of recognizing and noting an occurrence by using the senses
a possible explanation of a scientific question based on observation
an explanation that uses data to support or reject a hypothesis

Anjuli performed an experiment to determine the respiration rate of yeast. She determined this by measuring carbon dioxide (CO2) production over time. Then, she produced the following graph.
Her teacher suggested that she redraw her graph as a line graph. Why should she redraw the graph?
A line graph looks better in a scientific report.
She was measuring a rate of change.
She had graphed the wrong relationship.
Her experiment had many different variables.
Maria wanted to learn more about the birds that visit her backyard. She installed several bird feeders and offered the same variety of bird seed mixes in each feeder in order to attract a mix of bird species. For a month, she observed the bird feeders three times a day for an hour each day and counted the types of birds that visited the feeders. Then, she made a pie chart to compare the numbers of birds of each species that visited the feeders.
What is the most likely reason that she chose a pie chart?
To show the total number of birds that she observed.
To show the number of times that each bird visited the feeders.
To show which bird species were most common.
To show how the bird species changed over time.
A geologist and a biologist performed an experiment together and examined the data. Each scientist formed a different conclusion. Both conclusions were supported by the evidence. How is this possible?
Both conclusions are the same but have different wording.
If more than one conclusion is supported, the hypothesis is invalid.
There can be alternative explanations for the same evidence.
Each conclusion is based on different data.
How can evidence from an experiment be explained in relationship to the hypothesis?
as a prediction
as a question
as an inference
as a conclusion
Why are line graphs useful when interpreting data?
They make trends in the data easier to see.
They are easier to make than data tables.
They take the place of pictures in a report.
They can be used to show additional data.
How does a good experimental conclusion differ from an inference?
A conclusion states whether it supports the hypothesis; an inference is a guess.
A conclusion explains data; an inference predicts what will occur next.
A conclusion provides little information; an inference is more complete.
A conclusion is proven to be correct; an inference is disproved by an experiment.


Based only on the data table, what is MOST LIKELY a source of error?
The students did not use the same starting water temperature for each trial
The students used 2 minute time intervals and should have used longer ones
The students only performed 1 trial
Their was a measurement error in trial #3

What kind of data helps you understand the reasoning, opinions and motivations of why customers provide positive or negative feedback to your value proposition?
Quantitative data
Qualitative data

The pH scale measures the acidity or the basicity of a solution. Solutions that have a pH below 7 are acids. Solutions that have a low pH are more acidic than solutions that have a higher pH. The graph below shows the pH of four common fruit juices.
A student studying acidity of juices did a taste test and determined that the orange juice was the sweetest juice and the lemon and lime juices were the sourest. Based on this information, and the data shown in the bar graphs, which is the best inference the student could make about acidity?
Juices with more sugar content have a lower pH.
Higher acidity causes juices to taste more sour.
Juice that tastes sour has a lower pH than juice that tastes sweet.
Grapefruit juice tastes more sour than lime juice.
Lilly was trying to explain to her friend the difference between a theory and a law in science. She used the theory of plate tectonics and the law of superposition as examples. Lilli explained the difference by using non-scientific language. Which statement could Lilly use to correctly describe the difference between a theory and a law in science?
A theory describes a natural event, while a law explains it.
A theory explains a natural event, while a law predicts it.
A theory explains a natural event, while a law describes it.
A theory predicts a natural event, while a law explains it.
Joe tells Gabby his theory about why sea turtles nest on the beach instead of in the ocean. He says, “The turtle eggs would sink to the bottom of the ocean, and the baby turtle would drown. I know this because my uncle is a fisherman, and he told me this information. Gabby tells Joe that his theory is not scientific. Why does Joe’s idea not meet the requirements to be a scientific theory?
Joe’s idea is already a scientific law.
Joe’s idea is not supported by scientific evidence.
Joe’s idea is a good guess that can be tested by experiments.
Joe and his uncle are not scientists.
Which of these explain how a natural phenomenon works or happens?
theory
law
Which of these describes a natural phenomenon or relationship that always occurs under specific conditions
theory
law
In 1859, Charles Darwin described a model of how living things change over time. He described this model and the evidence that supported it in a book called On The Origin of Species. Which scientific term is used to describe a testable model that seeks to explain natural phenomena?
data
hypothesis
theory
observation
Scientists ___________ experiments to make sure the results are meaningful.
perform
repeat
conclude
communicate
Before a scientific theory is accepted and supported, it has
been tested by only one scientist.
been published in scientific journals.
been tested many times by different scientists.
been approved by the International Committee of Scientists.
Scientists create both scientific theories and scientific laws as they make observations and conduct experiments about the natural world. Which of the following statements most accurately compares the difference between scientific theories and scientific laws?
Scientific laws are based on evidence, while scientific theories are not.
Scientific theories involve only biology, while laws involve all types of science.
Scientific theories involve mathematical equations, while scientific laws are based on observations.
Scientific theories are ideas that explain natural events, while scientific laws more reliably predict natural events.
Which of the following ways describe how scientific theories and scientific laws are alike?
Both scientific theories and scientific laws explain why events occur in nature.
Both scientific theories and scientific laws can be modified if new evidence is discovered.
Both scientific theories and scientific laws are accepted by only the minority of scientists in their field.
Scientific theories and scientific laws are not alike in any ways.
Which of the following tells what happens every time under certain conditions?
Theory
Law
Both
Neither
Which of the following is supported by lots of evidence?
Theory
Law
Both
Neither
Theory or Law? Is a DESCRIPTION of what a scientists expects to happen every time under a certain set of conditions.
Law
Theory
Theory or Law? Is a well-tested EXPLANATION for a wide range of observations and experimental results.
Law
Theory
Generally accepted to be true and is universal
Law
Theory
Both
Can be expressed by a mathematical equation
Law
Theory
Both
Does not need complex external proof
Law
Theory
Both
Governs a single action
Law
Theory
Both
Accepted to be true by the scientific community
Law
Theory
Both
Used to make predictions of events
Law
Theory
Both
Uses advanced technology
Law
Theory
Both

